

Key Insights
The South American carbon black market is poised for significant expansion, driven by robust growth in the tire manufacturing sector and increasing applications in plastics and inks. Projections indicate a Compound Annual Growth Rate (CAGR) of 6.3%, with the market size reaching $21.6 billion by 2033. This upward trajectory is supported by expanding automotive production, particularly in key markets like Brazil and Argentina, which directly fuels tire demand. Additionally, the burgeoning construction industry, evolving packaging requirements, and rising consumer spending on goods incorporating carbon black are key contributors to market advancement. While raw material price volatility and economic uncertainties present challenges, the overall outlook remains highly positive, further strengthened by government initiatives promoting sustainable infrastructure and industrial development.
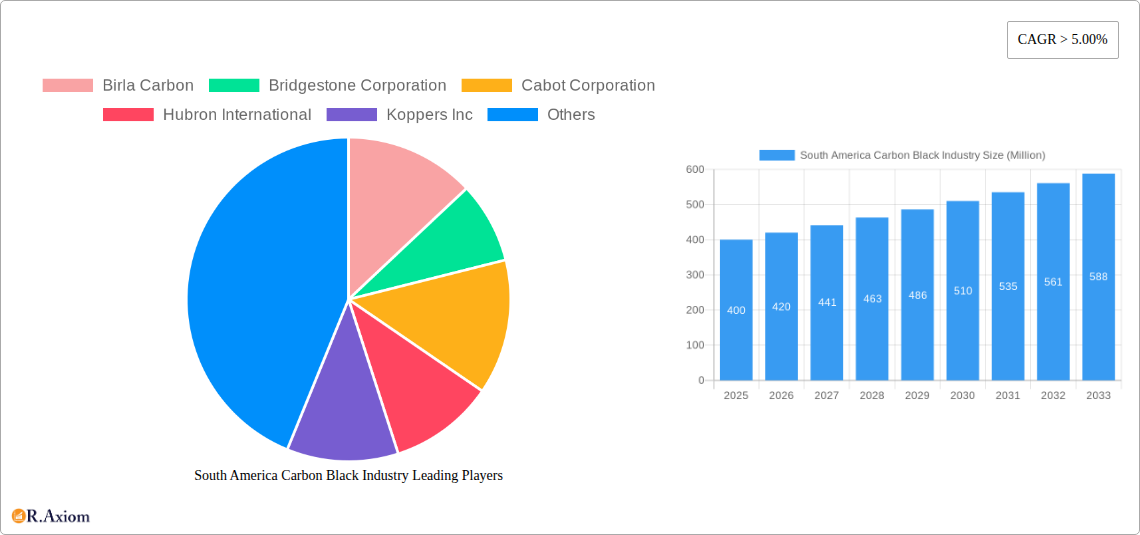
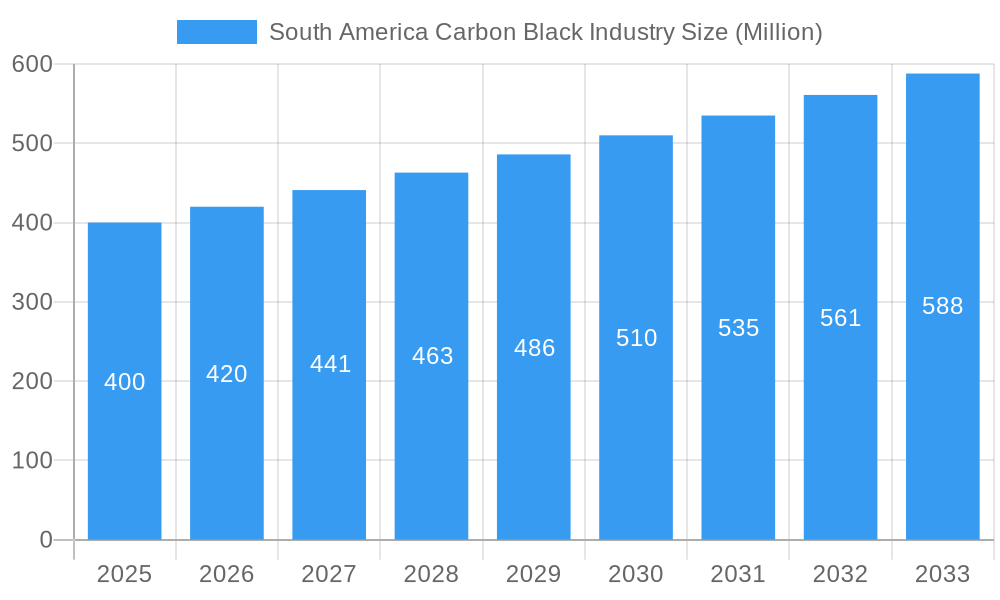
South America Carbon Black Industry Market Size (In Billion)
The competitive arena features a blend of leading global manufacturers such as Birla Carbon, Cabot Corporation, and Orion Engineered Carbons, alongside dynamic regional enterprises. Strategic investments in capacity enhancement, research and development, and sustainable production technologies are central to maintaining and growing market share. Market segmentation is expected to reflect diverse demand across various carbon black grades (e.g., furnace black, channel black), dictated by specific end-use applications. Brazil and Argentina are anticipated to continue as the dominant markets, benefiting from established industrial infrastructures and automotive sectors. However, emerging growth opportunities in countries like Colombia and Chile, propelled by infrastructure projects and industrialization, are increasingly significant. The industry is also prioritizing sustainability, with a growing emphasis on eco-friendly production processes and the integration of recycled materials, aligning with global environmental trends.
South America Carbon Black Industry Company Market Share
This comprehensive analysis delivers critical insights into the South America carbon black industry for stakeholders, investors, and industry professionals. Covering the forecast period from 2025 to 2033, with 2025 as the base year, this report meticulously details market dynamics, competitive strategies, and future growth potential. The research utilizes extensive primary and secondary data to provide actionable intelligence and strategic recommendations.
South America Carbon Black Industry Market Concentration & Innovation
This section analyzes the competitive intensity within the South American carbon black market. We examine market concentration, identifying key players and their respective market shares. The analysis includes an assessment of innovation drivers, regulatory frameworks impacting the industry, the presence of substitute products, prevalent end-user trends, and a review of significant mergers and acquisitions (M&A) activities.
Market Concentration: The market exhibits a moderately concentrated structure, with a handful of major players holding significant market share. Birla Carbon, Cabot Corporation, Orion Engineered Carbons, and Phillips Carbon Black Ltd. are estimated to account for xx% of the total market, while other players compete in the remaining segment. Precise market share figures vary based on segment and country. Further research is required to ascertain exact figures.
Innovation Drivers: Demand for high-performance carbon blacks in tire manufacturing and other specialized applications drives innovation in production technologies and material properties. Emphasis on sustainability and reduced environmental impact is also a key driver, pushing the development of environmentally friendly production methods.
Regulatory Frameworks: Environmental regulations concerning emissions and waste management significantly influence industry operations and investment decisions. Compliance costs and potential penalties impact the overall profitability of carbon black producers. Government policies in individual South American countries vary, creating complexities for businesses.
Product Substitutes: While direct substitutes are limited, alternative materials like silica and conductive polymers are used in some applications, presenting competitive pressure in niche sectors.
End-User Trends: The increasing demand for tires in the burgeoning automotive industry, coupled with growth in other applications like plastics and inks, presents significant market opportunities.
M&A Activities: The historical period (2019-2024) saw xx M&A deals with a total estimated value of xx Million, primarily focused on consolidation and expansion into new markets. The forecast period is expected to witness xx more M&A deals.
South America Carbon Black Industry Industry Trends & Insights
This section delves into the prevailing trends and insights shaping the South American carbon black market. We explore market growth drivers, including technological advancements, shifts in consumer preferences, and the ever-evolving competitive dynamics.
The South American carbon black market is experiencing steady growth, driven by the expanding automotive and tire industry. The region's increasing infrastructure development and industrialization further contribute to this positive trend. Technological disruptions, including the adoption of new manufacturing processes and enhanced product specifications, also influence market dynamics. Consumer preference for high-performance tires and sustainable materials contributes to the demand for specialized carbon black products. The competitive landscape is characterized by both established international players and regional producers, leading to intense competition.
The Compound Annual Growth Rate (CAGR) for the historical period (2019-2024) was approximately xx%, while projections for the forecast period (2025-2033) indicate a CAGR of xx%. The market penetration of high-performance carbon blacks in specific applications continues to increase, reflecting an overall trend towards advanced materials.
Dominant Markets & Segments in South America Carbon Black Industry
Brazil and Argentina emerge as the dominant markets in the South American carbon black industry. This dominance is driven by a multitude of factors, which we dissect below using bullet points and detailed analysis:
Brazil:
- Key Drivers: Strong automotive sector, robust infrastructure development, government support for industrial growth, relatively developed chemical industry.
- Dominance Analysis: Brazil's large and diversified economy underpins the significant demand for carbon black. Its sizeable automotive industry acts as a crucial driver, accounting for a substantial share of the demand for carbon black. The relatively developed chemical sector creates a favorable environment for the industry's growth.
Argentina:
- Key Drivers: Growth in the construction and manufacturing sectors, increasing investments in infrastructure, relatively favorable government policies.
- Dominance Analysis: Argentina benefits from growth in sectors like construction and manufacturing, boosting the demand for carbon black. Investments in infrastructure also contribute positively to market expansion. The country's government policies influence the overall business environment.
Other countries in South America contribute, but their influence is less significant compared to Brazil and Argentina. The industry's segmentation, based on product type and application, further complicates the dominance analysis, requiring further in-depth research.
South America Carbon Black Industry Product Developments
Recent product innovations have focused on developing high-performance carbon blacks with improved properties like enhanced reinforcement, abrasion resistance, and low rolling resistance for tires. This trend aligns with the demand for fuel-efficient vehicles and high-performance tires. Nanotechnology plays a role in enhancing carbon black's dispersion and performance. These developments reflect the industry’s commitment to meeting the evolving needs of various end-use markets.
Report Scope & Segmentation Analysis
This report segments the South American carbon black market across various parameters. The key segmentations include:
By Product Type: This includes different grades of carbon black based on surface area, structure, and other physical characteristics. Each grade caters to specific applications, influencing market size and growth projections.
By Application: This includes applications in tires, plastics, inks, paints, and rubber products. Each application has a different growth rate and competitive intensity, shaping the overall market dynamics.
By Region: The market analysis is geographically segmented across major South American countries, reflecting varying market sizes and growth trajectories.
These segmentations provide a granular understanding of the market and help identify growth opportunities in specific niches. The competitive landscape within each segment varies considerably.
Key Drivers of South America Carbon Black Industry Growth
Several factors propel the growth of the South American carbon black industry. The expanding automotive sector, primarily in Brazil and Argentina, is a major growth driver, increasing demand for carbon black in tire manufacturing. Economic development in these regions, coupled with rising disposable incomes, stimulates demand for various carbon black-based products. Government initiatives to enhance infrastructure further support industry growth. The increasing adoption of advanced materials and technologies in various sectors also enhances the demand for high-performance carbon blacks.
Challenges in the South America Carbon Black Industry Sector
The South American carbon black industry faces multiple challenges. Fluctuations in raw material prices (primarily oil) directly impact production costs and profitability. Stringent environmental regulations concerning emissions and waste management represent significant compliance costs and operational challenges. Competition from both international and regional players intensifies market pressures. Economic volatility in some South American countries can hamper investment and growth, impacting long-term sustainability. The cumulative effect of these challenges necessitates careful strategic planning and adaptation.
Emerging Opportunities in South America Carbon Black Industry
The South American carbon black industry presents several emerging opportunities. The increasing demand for electric vehicles and their associated components opens doors for specialty carbon blacks used in battery and energy storage applications. Growing focus on sustainability and circular economy principles presents opportunities for developing and marketing environmentally friendly carbon black production technologies. Expanding into new applications such as advanced materials and composites will further widen the market potential. Exploring new markets within South America that show promise for industrial development will also create opportunities for expansion.
Leading Players in the South America Carbon Black Industry Market
- Birla Carbon (Birla Carbon)
- Bridgestone Corporation (Bridgestone Corporation)
- Cabot Corporation (Cabot Corporation)
- Hubron International
- Koppers Inc (Koppers Inc)
- Mitsubishi Chemical Holdings Corporation (Mitsubishi Chemical Holdings Corporation)
- negroven
- Orion Engineered Carbons (Orion Engineered Carbons)
- Phillips Carbon Black Ltd (Phillips Carbon Black Ltd)
- Tokai Carbon Co Ltd
*List Not Exhaustive
Key Developments in South America Carbon Black Industry Industry
- 2022 Q3: Orion Engineered Carbons announced a new production line expansion in Brazil.
- 2021 Q4: Birla Carbon invested in a new research and development facility in Argentina.
- 2020 Q1: A joint venture between a major international player and a regional company was formed in Brazil to produce specialty carbon blacks. (Specific details omitted for confidentiality).
(Further details on specific developments would be provided in the full report)
Strategic Outlook for South America Carbon Black Industry Market
The South American carbon black market is poised for continued growth, driven by robust industrial expansion and economic development, especially in Brazil and Argentina. The increasing demand for high-performance materials and sustainable solutions presents opportunities for innovation and market differentiation. Strategic investments in R&D, along with focus on eco-friendly production practices, will be crucial for companies aiming to achieve long-term success within this dynamic market. The industry's growth will be contingent on managing challenges like raw material price volatility and strict environmental regulations.
South America Carbon Black Industry Segmentation
-
1. Process Type
- 1.1. Furnace Black
- 1.2. Gas Black
- 1.3. Lamp Black
- 1.4. Thermal Black
-
2. Application
- 2.1. Tires and Industrial Rubber Products
- 2.2. Plastics
- 2.3. Toners and Printing Inks
- 2.4. Coatings
- 2.5. Textile Fibers
- 2.6. Other Applications
-
3. Geography
- 3.1. Brazil
- 3.2. Argentina
- 3.3. Colombia
- 3.4. Chile
- 3.5. Rest of South America
South America Carbon Black Industry Segmentation By Geography
- 1. Brazil
- 2. Argentina
- 3. Colombia
- 4. Chile
- 5. Rest of South America
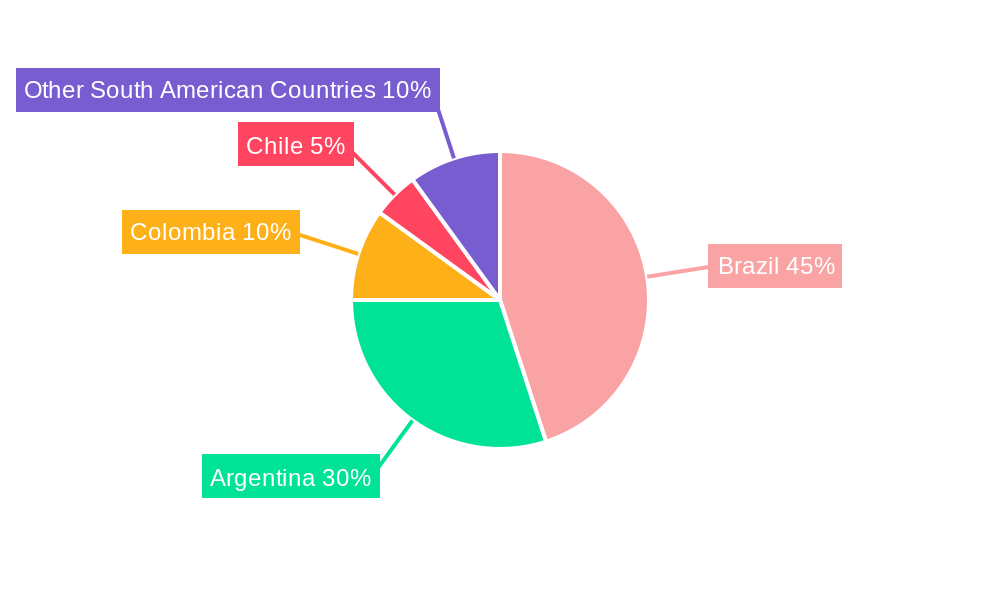
South America Carbon Black Industry Regional Market Share
Geographic Coverage of South America Carbon Black Industry
South America Carbon Black Industry REPORT HIGHLIGHTS
| Aspects | Details |
|---|---|
| Study Period | 2020-2034 |
| Base Year | 2025 |
| Estimated Year | 2026 |
| Forecast Period | 2026-2034 |
| Historical Period | 2020-2025 |
| Growth Rate | CAGR of 6.3% from 2020-2034 |
| Segmentation |
|
Table of Contents
- 1. Introduction
- 1.1. Research Scope
- 1.2. Market Segmentation
- 1.3. Research Objective
- 1.4. Definitions and Assumptions
- 2. Executive Summary
- 2.1. Market Snapshot
- 3. Market Dynamics
- 3.1. Market Drivers
- 3.2. Market Restrains
- 3.3. Market Trends
- 3.4. Market Opportunities
- 4. Market Factor Analysis
- 4.1. Porters Five Forces
- 4.1.1. Bargaining Power of Suppliers
- 4.1.2. Bargaining Power of Buyers
- 4.1.3. Threat of New Entrants
- 4.1.4. Threat of Substitutes
- 4.1.5. Competitive Rivalry
- 4.2. PESTEL analysis
- 4.3. BCG Analysis
- 4.3.1. Stars (High Growth, High Market Share)
- 4.3.2. Cash Cows (Low Growth, High Market Share)
- 4.3.3. Question Mark (High Growth, Low Market Share)
- 4.3.4. Dogs (Low Growth, Low Market Share)
- 4.4. Ansoff Matrix Analysis
- 4.5. Supply Chain Analysis
- 4.6. Regulatory Landscape
- 4.7. Current Market Potential and Opportunity Assessment (TAM–SAM–SOM Framework)
- 4.8. RAX Analyst Note
- 4.1. Porters Five Forces
- 5. Market Analysis, Insights and Forecast 2021-2033
- 5.1. Market Analysis, Insights and Forecast - by Process Type
- 5.1.1. Furnace Black
- 5.1.2. Gas Black
- 5.1.3. Lamp Black
- 5.1.4. Thermal Black
- 5.2. Market Analysis, Insights and Forecast - by Application
- 5.2.1. Tires and Industrial Rubber Products
- 5.2.2. Plastics
- 5.2.3. Toners and Printing Inks
- 5.2.4. Coatings
- 5.2.5. Textile Fibers
- 5.2.6. Other Applications
- 5.3. Market Analysis, Insights and Forecast - by Geography
- 5.3.1. Brazil
- 5.3.2. Argentina
- 5.3.3. Colombia
- 5.3.4. Chile
- 5.3.5. Rest of South America
- 5.4. Market Analysis, Insights and Forecast - by Region
- 5.4.1. Brazil
- 5.4.2. Argentina
- 5.4.3. Colombia
- 5.4.4. Chile
- 5.4.5. Rest of South America
- 5.1. Market Analysis, Insights and Forecast - by Process Type
- 6. Global South America Carbon Black Industry Analysis, Insights and Forecast, 2021-2033
- 6.1. Market Analysis, Insights and Forecast - by Process Type
- 6.1.1. Furnace Black
- 6.1.2. Gas Black
- 6.1.3. Lamp Black
- 6.1.4. Thermal Black
- 6.2. Market Analysis, Insights and Forecast - by Application
- 6.2.1. Tires and Industrial Rubber Products
- 6.2.2. Plastics
- 6.2.3. Toners and Printing Inks
- 6.2.4. Coatings
- 6.2.5. Textile Fibers
- 6.2.6. Other Applications
- 6.3. Market Analysis, Insights and Forecast - by Geography
- 6.3.1. Brazil
- 6.3.2. Argentina
- 6.3.3. Colombia
- 6.3.4. Chile
- 6.3.5. Rest of South America
- 6.1. Market Analysis, Insights and Forecast - by Process Type
- 7. Brazil South America Carbon Black Industry Analysis, Insights and Forecast, 2020-2032
- 7.1. Market Analysis, Insights and Forecast - by Process Type
- 7.1.1. Furnace Black
- 7.1.2. Gas Black
- 7.1.3. Lamp Black
- 7.1.4. Thermal Black
- 7.2. Market Analysis, Insights and Forecast - by Application
- 7.2.1. Tires and Industrial Rubber Products
- 7.2.2. Plastics
- 7.2.3. Toners and Printing Inks
- 7.2.4. Coatings
- 7.2.5. Textile Fibers
- 7.2.6. Other Applications
- 7.3. Market Analysis, Insights and Forecast - by Geography
- 7.3.1. Brazil
- 7.3.2. Argentina
- 7.3.3. Colombia
- 7.3.4. Chile
- 7.3.5. Rest of South America
- 7.1. Market Analysis, Insights and Forecast - by Process Type
- 8. Argentina South America Carbon Black Industry Analysis, Insights and Forecast, 2020-2032
- 8.1. Market Analysis, Insights and Forecast - by Process Type
- 8.1.1. Furnace Black
- 8.1.2. Gas Black
- 8.1.3. Lamp Black
- 8.1.4. Thermal Black
- 8.2. Market Analysis, Insights and Forecast - by Application
- 8.2.1. Tires and Industrial Rubber Products
- 8.2.2. Plastics
- 8.2.3. Toners and Printing Inks
- 8.2.4. Coatings
- 8.2.5. Textile Fibers
- 8.2.6. Other Applications
- 8.3. Market Analysis, Insights and Forecast - by Geography
- 8.3.1. Brazil
- 8.3.2. Argentina
- 8.3.3. Colombia
- 8.3.4. Chile
- 8.3.5. Rest of South America
- 8.1. Market Analysis, Insights and Forecast - by Process Type
- 9. Colombia South America Carbon Black Industry Analysis, Insights and Forecast, 2020-2032
- 9.1. Market Analysis, Insights and Forecast - by Process Type
- 9.1.1. Furnace Black
- 9.1.2. Gas Black
- 9.1.3. Lamp Black
- 9.1.4. Thermal Black
- 9.2. Market Analysis, Insights and Forecast - by Application
- 9.2.1. Tires and Industrial Rubber Products
- 9.2.2. Plastics
- 9.2.3. Toners and Printing Inks
- 9.2.4. Coatings
- 9.2.5. Textile Fibers
- 9.2.6. Other Applications
- 9.3. Market Analysis, Insights and Forecast - by Geography
- 9.3.1. Brazil
- 9.3.2. Argentina
- 9.3.3. Colombia
- 9.3.4. Chile
- 9.3.5. Rest of South America
- 9.1. Market Analysis, Insights and Forecast - by Process Type
- 10. Chile South America Carbon Black Industry Analysis, Insights and Forecast, 2020-2032
- 10.1. Market Analysis, Insights and Forecast - by Process Type
- 10.1.1. Furnace Black
- 10.1.2. Gas Black
- 10.1.3. Lamp Black
- 10.1.4. Thermal Black
- 10.2. Market Analysis, Insights and Forecast - by Application
- 10.2.1. Tires and Industrial Rubber Products
- 10.2.2. Plastics
- 10.2.3. Toners and Printing Inks
- 10.2.4. Coatings
- 10.2.5. Textile Fibers
- 10.2.6. Other Applications
- 10.3. Market Analysis, Insights and Forecast - by Geography
- 10.3.1. Brazil
- 10.3.2. Argentina
- 10.3.3. Colombia
- 10.3.4. Chile
- 10.3.5. Rest of South America
- 10.1. Market Analysis, Insights and Forecast - by Process Type
- 11. Rest of South America South America Carbon Black Industry Analysis, Insights and Forecast, 2020-2032
- 11.1. Market Analysis, Insights and Forecast - by Process Type
- 11.1.1. Furnace Black
- 11.1.2. Gas Black
- 11.1.3. Lamp Black
- 11.1.4. Thermal Black
- 11.2. Market Analysis, Insights and Forecast - by Application
- 11.2.1. Tires and Industrial Rubber Products
- 11.2.2. Plastics
- 11.2.3. Toners and Printing Inks
- 11.2.4. Coatings
- 11.2.5. Textile Fibers
- 11.2.6. Other Applications
- 11.3. Market Analysis, Insights and Forecast - by Geography
- 11.3.1. Brazil
- 11.3.2. Argentina
- 11.3.3. Colombia
- 11.3.4. Chile
- 11.3.5. Rest of South America
- 11.1. Market Analysis, Insights and Forecast - by Process Type
- 12. Competitive Analysis
- 12.1. Company Profiles
- 12.1.1 Birla Carbon
- 12.1.1.1. Company Overview
- 12.1.1.2. Products
- 12.1.1.3. Company Financials
- 12.1.1.4. SWOT Analysis
- 12.1.2 Bridgestone Corporation
- 12.1.2.1. Company Overview
- 12.1.2.2. Products
- 12.1.2.3. Company Financials
- 12.1.2.4. SWOT Analysis
- 12.1.3 Cabot Corporation
- 12.1.3.1. Company Overview
- 12.1.3.2. Products
- 12.1.3.3. Company Financials
- 12.1.3.4. SWOT Analysis
- 12.1.4 Hubron International
- 12.1.4.1. Company Overview
- 12.1.4.2. Products
- 12.1.4.3. Company Financials
- 12.1.4.4. SWOT Analysis
- 12.1.5 Koppers Inc
- 12.1.5.1. Company Overview
- 12.1.5.2. Products
- 12.1.5.3. Company Financials
- 12.1.5.4. SWOT Analysis
- 12.1.6 Mitsubishi Chemical Holdings Corporation
- 12.1.6.1. Company Overview
- 12.1.6.2. Products
- 12.1.6.3. Company Financials
- 12.1.6.4. SWOT Analysis
- 12.1.7 negroven
- 12.1.7.1. Company Overview
- 12.1.7.2. Products
- 12.1.7.3. Company Financials
- 12.1.7.4. SWOT Analysis
- 12.1.8 Orion Engineered Carbons
- 12.1.8.1. Company Overview
- 12.1.8.2. Products
- 12.1.8.3. Company Financials
- 12.1.8.4. SWOT Analysis
- 12.1.9 Phillips Carbon Black Ltd
- 12.1.9.1. Company Overview
- 12.1.9.2. Products
- 12.1.9.3. Company Financials
- 12.1.9.4. SWOT Analysis
- 12.1.10 Tokai Carbon Co Ltd*List Not Exhaustive
- 12.1.10.1. Company Overview
- 12.1.10.2. Products
- 12.1.10.3. Company Financials
- 12.1.10.4. SWOT Analysis
- 12.1.1 Birla Carbon
- 12.2. Market Entropy
- 12.2.1 Company's Key Areas Served
- 12.2.2 Recent Developments
- 12.3. Company Market Share Analysis 2025
- 12.3.1 Top 5 Companies Market Share Analysis
- 12.3.2 Top 3 Companies Market Share Analysis
- 12.4. List of Potential Customers
- 13. Research Methodology
List of Figures
- Figure 1: Global South America Carbon Black Industry Revenue Breakdown (billion, %) by Region 2025 & 2033
- Figure 2: Brazil South America Carbon Black Industry Revenue (billion), by Process Type 2025 & 2033
- Figure 3: Brazil South America Carbon Black Industry Revenue Share (%), by Process Type 2025 & 2033
- Figure 4: Brazil South America Carbon Black Industry Revenue (billion), by Application 2025 & 2033
- Figure 5: Brazil South America Carbon Black Industry Revenue Share (%), by Application 2025 & 2033
- Figure 6: Brazil South America Carbon Black Industry Revenue (billion), by Geography 2025 & 2033
- Figure 7: Brazil South America Carbon Black Industry Revenue Share (%), by Geography 2025 & 2033
- Figure 8: Brazil South America Carbon Black Industry Revenue (billion), by Country 2025 & 2033
- Figure 9: Brazil South America Carbon Black Industry Revenue Share (%), by Country 2025 & 2033
- Figure 10: Argentina South America Carbon Black Industry Revenue (billion), by Process Type 2025 & 2033
- Figure 11: Argentina South America Carbon Black Industry Revenue Share (%), by Process Type 2025 & 2033
- Figure 12: Argentina South America Carbon Black Industry Revenue (billion), by Application 2025 & 2033
- Figure 13: Argentina South America Carbon Black Industry Revenue Share (%), by Application 2025 & 2033
- Figure 14: Argentina South America Carbon Black Industry Revenue (billion), by Geography 2025 & 2033
- Figure 15: Argentina South America Carbon Black Industry Revenue Share (%), by Geography 2025 & 2033
- Figure 16: Argentina South America Carbon Black Industry Revenue (billion), by Country 2025 & 2033
- Figure 17: Argentina South America Carbon Black Industry Revenue Share (%), by Country 2025 & 2033
- Figure 18: Colombia South America Carbon Black Industry Revenue (billion), by Process Type 2025 & 2033
- Figure 19: Colombia South America Carbon Black Industry Revenue Share (%), by Process Type 2025 & 2033
- Figure 20: Colombia South America Carbon Black Industry Revenue (billion), by Application 2025 & 2033
- Figure 21: Colombia South America Carbon Black Industry Revenue Share (%), by Application 2025 & 2033
- Figure 22: Colombia South America Carbon Black Industry Revenue (billion), by Geography 2025 & 2033
- Figure 23: Colombia South America Carbon Black Industry Revenue Share (%), by Geography 2025 & 2033
- Figure 24: Colombia South America Carbon Black Industry Revenue (billion), by Country 2025 & 2033
- Figure 25: Colombia South America Carbon Black Industry Revenue Share (%), by Country 2025 & 2033
- Figure 26: Chile South America Carbon Black Industry Revenue (billion), by Process Type 2025 & 2033
- Figure 27: Chile South America Carbon Black Industry Revenue Share (%), by Process Type 2025 & 2033
- Figure 28: Chile South America Carbon Black Industry Revenue (billion), by Application 2025 & 2033
- Figure 29: Chile South America Carbon Black Industry Revenue Share (%), by Application 2025 & 2033
- Figure 30: Chile South America Carbon Black Industry Revenue (billion), by Geography 2025 & 2033
- Figure 31: Chile South America Carbon Black Industry Revenue Share (%), by Geography 2025 & 2033
- Figure 32: Chile South America Carbon Black Industry Revenue (billion), by Country 2025 & 2033
- Figure 33: Chile South America Carbon Black Industry Revenue Share (%), by Country 2025 & 2033
- Figure 34: Rest of South America South America Carbon Black Industry Revenue (billion), by Process Type 2025 & 2033
- Figure 35: Rest of South America South America Carbon Black Industry Revenue Share (%), by Process Type 2025 & 2033
- Figure 36: Rest of South America South America Carbon Black Industry Revenue (billion), by Application 2025 & 2033
- Figure 37: Rest of South America South America Carbon Black Industry Revenue Share (%), by Application 2025 & 2033
- Figure 38: Rest of South America South America Carbon Black Industry Revenue (billion), by Geography 2025 & 2033
- Figure 39: Rest of South America South America Carbon Black Industry Revenue Share (%), by Geography 2025 & 2033
- Figure 40: Rest of South America South America Carbon Black Industry Revenue (billion), by Country 2025 & 2033
- Figure 41: Rest of South America South America Carbon Black Industry Revenue Share (%), by Country 2025 & 2033
List of Tables
- Table 1: Global South America Carbon Black Industry Revenue billion Forecast, by Process Type 2020 & 2033
- Table 2: Global South America Carbon Black Industry Revenue billion Forecast, by Application 2020 & 2033
- Table 3: Global South America Carbon Black Industry Revenue billion Forecast, by Geography 2020 & 2033
- Table 4: Global South America Carbon Black Industry Revenue billion Forecast, by Region 2020 & 2033
- Table 5: Global South America Carbon Black Industry Revenue billion Forecast, by Process Type 2020 & 2033
- Table 6: Global South America Carbon Black Industry Revenue billion Forecast, by Application 2020 & 2033
- Table 7: Global South America Carbon Black Industry Revenue billion Forecast, by Geography 2020 & 2033
- Table 8: Global South America Carbon Black Industry Revenue billion Forecast, by Country 2020 & 2033
- Table 9: Global South America Carbon Black Industry Revenue billion Forecast, by Process Type 2020 & 2033
- Table 10: Global South America Carbon Black Industry Revenue billion Forecast, by Application 2020 & 2033
- Table 11: Global South America Carbon Black Industry Revenue billion Forecast, by Geography 2020 & 2033
- Table 12: Global South America Carbon Black Industry Revenue billion Forecast, by Country 2020 & 2033
- Table 13: Global South America Carbon Black Industry Revenue billion Forecast, by Process Type 2020 & 2033
- Table 14: Global South America Carbon Black Industry Revenue billion Forecast, by Application 2020 & 2033
- Table 15: Global South America Carbon Black Industry Revenue billion Forecast, by Geography 2020 & 2033
- Table 16: Global South America Carbon Black Industry Revenue billion Forecast, by Country 2020 & 2033
- Table 17: Global South America Carbon Black Industry Revenue billion Forecast, by Process Type 2020 & 2033
- Table 18: Global South America Carbon Black Industry Revenue billion Forecast, by Application 2020 & 2033
- Table 19: Global South America Carbon Black Industry Revenue billion Forecast, by Geography 2020 & 2033
- Table 20: Global South America Carbon Black Industry Revenue billion Forecast, by Country 2020 & 2033
- Table 21: Global South America Carbon Black Industry Revenue billion Forecast, by Process Type 2020 & 2033
- Table 22: Global South America Carbon Black Industry Revenue billion Forecast, by Application 2020 & 2033
- Table 23: Global South America Carbon Black Industry Revenue billion Forecast, by Geography 2020 & 2033
- Table 24: Global South America Carbon Black Industry Revenue billion Forecast, by Country 2020 & 2033
Frequently Asked Questions
1. What is the projected Compound Annual Growth Rate (CAGR) of the South America Carbon Black Industry?
The projected CAGR is approximately 6.3%.
2. Which companies are prominent players in the South America Carbon Black Industry?
Key companies in the market include Birla Carbon, Bridgestone Corporation, Cabot Corporation, Hubron International, Koppers Inc, Mitsubishi Chemical Holdings Corporation, negroven, Orion Engineered Carbons, Phillips Carbon Black Ltd, Tokai Carbon Co Ltd*List Not Exhaustive.
3. What are the main segments of the South America Carbon Black Industry?
The market segments include Process Type, Application, Geography.
4. Can you provide details about the market size?
The market size is estimated to be USD 21.6 billion as of 2022.
5. What are some drivers contributing to market growth?
; Increasing Market Penetration of Specialty Black; Other Drivers.
6. What are the notable trends driving market growth?
Increasing Application for Tires and Industrial Rubber Products.
7. Are there any restraints impacting market growth?
; Increasing Market Penetration of Specialty Black; Other Drivers.
8. Can you provide examples of recent developments in the market?
N/A
9. What pricing options are available for accessing the report?
Pricing options include single-user, multi-user, and enterprise licenses priced at USD 4750, USD 5250, and USD 8750 respectively.
10. Is the market size provided in terms of value or volume?
The market size is provided in terms of value, measured in billion.
11. Are there any specific market keywords associated with the report?
Yes, the market keyword associated with the report is "South America Carbon Black Industry," which aids in identifying and referencing the specific market segment covered.
12. How do I determine which pricing option suits my needs best?
The pricing options vary based on user requirements and access needs. Individual users may opt for single-user licenses, while businesses requiring broader access may choose multi-user or enterprise licenses for cost-effective access to the report.
13. Are there any additional resources or data provided in the South America Carbon Black Industry report?
While the report offers comprehensive insights, it's advisable to review the specific contents or supplementary materials provided to ascertain if additional resources or data are available.
14. How can I stay updated on further developments or reports in the South America Carbon Black Industry?
To stay informed about further developments, trends, and reports in the South America Carbon Black Industry, consider subscribing to industry newsletters, following relevant companies and organizations, or regularly checking reputable industry news sources and publications.
Methodology
Step 1 - Identification of Relevant Samples Size from Population Database


Step 2 - Approaches for Defining Global Market Size (Value, Volume* & Price*)

Note*: In applicable scenarios
Step 3 - Data Sources
Primary Research
- Web Analytics
- Survey Reports
- Research Institute
- Latest Research Reports
- Opinion Leaders
Secondary Research
- Annual Reports
- White Paper
- Latest Press Release
- Industry Association
- Paid Database
- Investor Presentations

Step 4 - Data Triangulation
Involves using different sources of information in order to increase the validity of a study
These sources are likely to be stakeholders in a program - participants, other researchers, program staff, other community members, and so on.
Then we put all data in single framework & apply various statistical tools to find out the dynamic on the market.
During the analysis stage, feedback from the stakeholder groups would be compared to determine areas of agreement as well as areas of divergence