

Key Insights
The South American water treatment chemicals market is poised for significant expansion, driven by accelerated industrialization, rapid urbanization, and increasingly stringent environmental mandates. Projections indicate a compound annual growth rate (CAGR) of 7.4%, propelling the market size from $2.9 billion in the base year 2024 to substantial future growth. The market is strategically segmented by chemical type (e.g., coagulants, flocculants, disinfectants), application (municipal and industrial), and key South American geographies including Brazil, Argentina, and Chile. Leading industry participants such as Nouryon, Ecolab, Solenis, and Kemira are actively shaping the landscape through technological innovation and strategic collaborations. Escalating demand for potable and industrial water, coupled with substantial investments in water infrastructure, are primary growth enablers. Challenges include regional economic volatility and raw material price fluctuations. A key emerging trend is the growing adoption of sustainable and eco-friendly water treatment solutions, influencing product development and market trajectory.
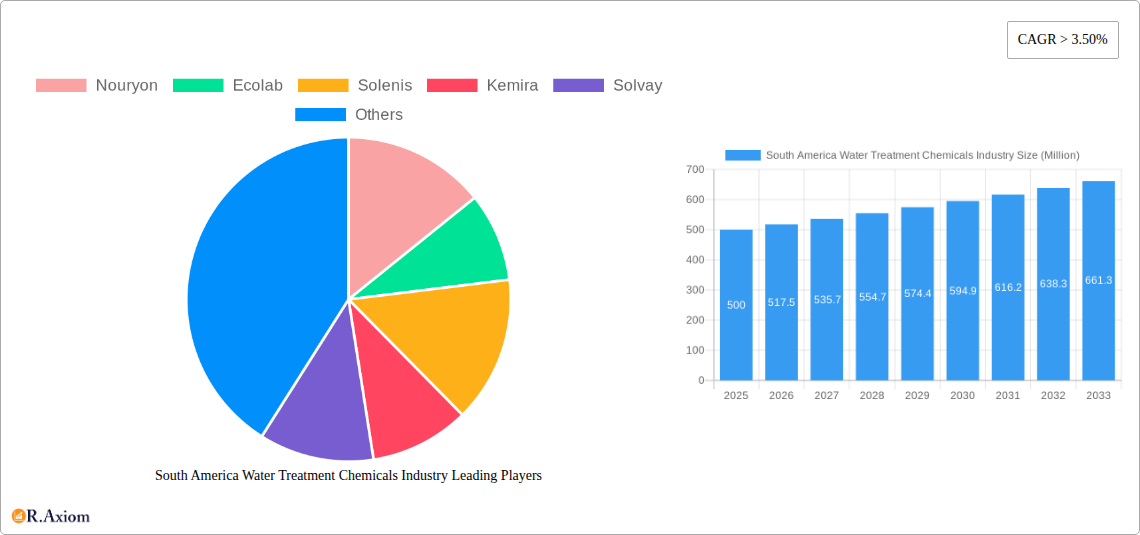
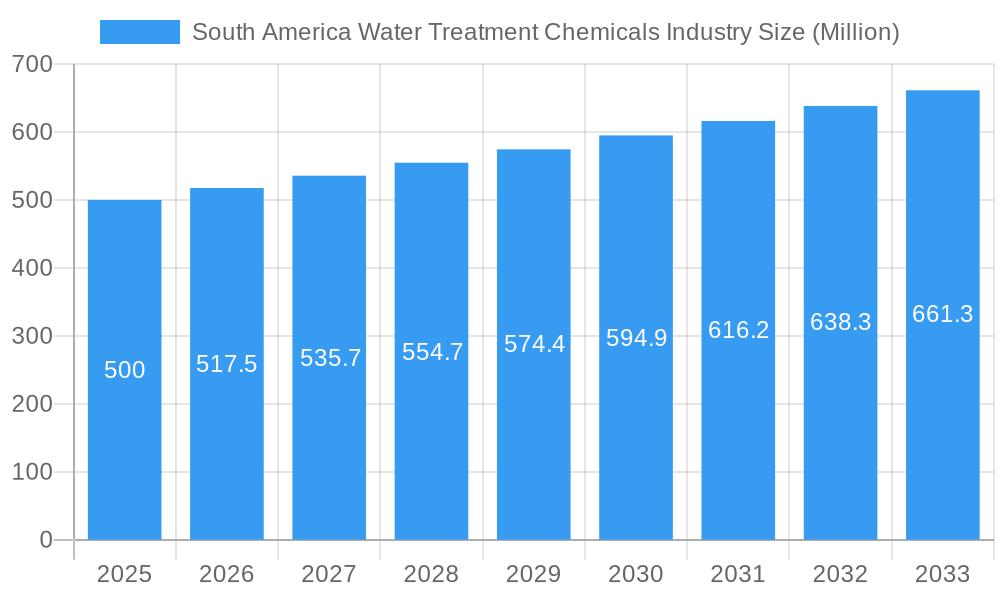
South America Water Treatment Chemicals Industry Market Size (In Billion)
Brazil is anticipated to lead the South American market due to its significant population and robust industrial sector. Argentina and Chile are also projected to experience considerable growth, supported by expanding industrial operations and heightened emphasis on water resource management. The market size is projected to reach $2.9 billion by 2024, with continued expansion anticipated throughout the forecast period driven by the aforementioned CAGR. The ongoing enforcement of rigorous environmental regulations across the region is a key catalyst for the adoption of advanced water treatment chemicals and technologies, fostering innovation and contributing to overall market growth. Competitive dynamics are characterized by an intense focus on product differentiation, technological advancement, and strategic partnerships to secure and enhance market share.
South America Water Treatment Chemicals Industry Company Market Share
South America Water Treatment Chemicals Industry: A Comprehensive Market Analysis (2019-2033)
This comprehensive report provides an in-depth analysis of the South America Water Treatment Chemicals industry, offering invaluable insights for stakeholders, investors, and industry professionals. The study covers the period 2019-2033, with 2025 as the base and estimated year. The report leverages robust data analysis to forecast market trends and identify key opportunities for growth.
South America Water Treatment Chemicals Industry Market Concentration & Innovation
The South American water treatment chemicals market exhibits a moderately concentrated structure, with major players like Nouryon, Ecolab, Solenis, Kemira, Solvay, Lonza, Kurita Water Industries Ltd, SNF, and Suez holding significant market share. However, the presence of numerous regional and smaller players indicates a competitive landscape. The combined market share of the top five players in 2025 is estimated at xx%. Innovation is driven by stringent environmental regulations, growing industrialization, and increasing demand for sustainable water management solutions. Mergers and acquisitions (M&A) activity has been moderate in recent years, with deal values averaging approximately xx Million annually during the historical period (2019-2024). Key innovation drivers include the development of advanced oxidation processes, membrane filtration technologies, and environmentally friendly chemicals. Regulatory frameworks, particularly those related to water quality and discharge limits, significantly influence market dynamics. The presence of substitute technologies, such as reverse osmosis and ultraviolet disinfection, also shapes the competitive landscape. End-user trends toward water conservation and reuse are driving demand for efficient and cost-effective water treatment solutions.
- Market Share (2025): Top 5 players – xx%
- Average M&A Deal Value (2019-2024): xx Million
- Key Innovation Drivers: Advanced oxidation processes, membrane filtration, eco-friendly chemicals.
South America Water Treatment Chemicals Industry Industry Trends & Insights
The South American water treatment chemicals market is experiencing robust growth, driven by factors including rapid urbanization, industrial expansion, and increasing awareness of water scarcity. The market is projected to register a Compound Annual Growth Rate (CAGR) of xx% during the forecast period (2025-2033). Technological disruptions, such as the adoption of automation and digitalization in water treatment plants, are transforming industry operations. Consumer preferences are shifting towards sustainable and environmentally friendly solutions, driving demand for bio-based and biodegradable chemicals. Competitive dynamics are characterized by intense rivalry among established players and the emergence of innovative startups offering specialized solutions. Market penetration of advanced water treatment technologies is steadily increasing, particularly in the municipal and industrial sectors. Specific growth drivers include rising government investments in water infrastructure, increasing demand from the mining and energy sectors, and growing adoption of water reuse strategies.
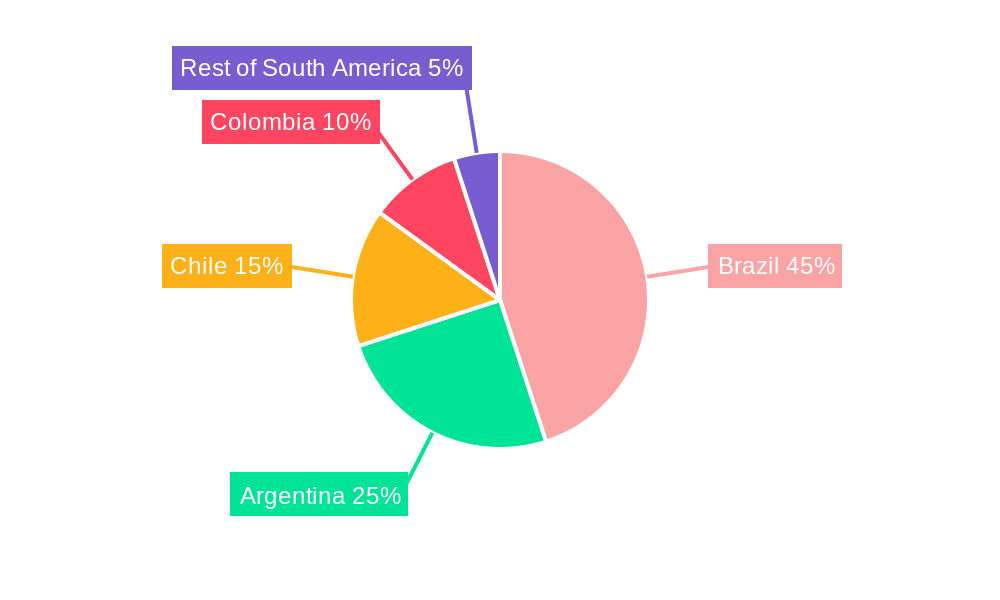
Dominant Markets & Segments in South America Water Treatment Chemicals Industry
Brazil stands as the dominant market in South America for water treatment chemicals, driven by its large population, extensive industrial base, and significant investments in water infrastructure projects. Other key markets include Colombia, Argentina, and Chile, exhibiting significant growth potential. The municipal segment holds the largest market share, driven by government initiatives for improved water supply and sanitation. The industrial segment is also experiencing rapid growth, propelled by stringent environmental regulations and the rising demand for water-efficient industrial processes.
- Key Drivers of Brazil's Dominance: Large population, industrial growth, infrastructure investments.
- Key Drivers of Municipal Segment Growth: Government initiatives, improved sanitation standards.
- Key Drivers of Industrial Segment Growth: Stringent regulations, water efficiency demands.
South America Water Treatment Chemicals Industry Product Developments
Recent product developments emphasize environmentally friendly formulations, enhanced efficacy, and improved cost-effectiveness. Technological trends include the increased use of bio-based chemicals, nanotechnology-enhanced products, and advanced oxidation technologies. These innovations aim to meet the growing demand for sustainable and efficient water treatment solutions, while also addressing specific challenges faced by different market segments. The focus on improved market fit encompasses tailored solutions for diverse applications, including drinking water treatment, wastewater treatment, and industrial process water management.
Report Scope & Segmentation Analysis
This report segments the South American water treatment chemicals market by product type (coagulants, flocculants, disinfectants, corrosion inhibitors, scale inhibitors, etc.), application (municipal, industrial, oil & gas, power generation, etc.), and region (Brazil, Argentina, Colombia, Chile, etc.). Each segment is analyzed in detail, with growth projections, market size estimations, and competitive landscape assessments. The market is further segmented based on the type of water treatment plants (conventional, advanced). Each segment exhibits distinct growth dynamics and competitive dynamics reflecting specific market needs and regulatory environments.
Key Drivers of South America Water Treatment Chemicals Industry Growth
The growth of the South American water treatment chemicals market is propelled by a confluence of factors: increasing urbanization leading to higher water demand, stringent environmental regulations promoting sustainable water management, and expanding industrial activities requiring efficient water treatment. Government initiatives aimed at improving water infrastructure and sanitation further accelerate market growth. Moreover, the growing adoption of advanced water treatment technologies contributes significantly to market expansion. These factors collectively create a favorable environment for sustained market growth.
Challenges in the South America Water Treatment Chemicals Industry Sector
The South American water treatment chemicals industry faces several challenges, including the economic volatility impacting investment in water infrastructure, fluctuations in raw material prices, and the complexity of regulatory frameworks varying across different countries. Furthermore, competition from both established players and emerging local businesses creates pressure on pricing and profitability. Supply chain disruptions can lead to production delays and increased costs. These combined challenges require strategic planning and adaptability to mitigate their impact.
Emerging Opportunities in South America Water Treatment Chemicals Industry
Emerging opportunities exist in the growing adoption of sustainable and eco-friendly water treatment solutions, the increasing demand for advanced oxidation processes, and the expansion of water reuse and recycling initiatives. The development of innovative technologies addressing specific water quality challenges in different regions also presents substantial growth potential. Focus on niche applications and customized solutions can unlock further market expansion opportunities.
Key Developments in South America Water Treatment Chemicals Industry Industry
- 2023: Ecolab launched a new range of sustainable water treatment chemicals for the industrial sector in Brazil.
- 2022: Solenis acquired a regional water treatment chemicals company in Argentina, expanding its market presence.
- 2021: Kemira partnered with a local government to implement an advanced water treatment project in Chile.
- 2020: Nouryon invested in expanding its production capacity for coagulants in Brazil.
- Further developments will be included in the complete report.
Strategic Outlook for South America Water Treatment Chemicals Market
The South American water treatment chemicals market is poised for significant growth over the next decade, driven by factors such as increasing urbanization, industrialization, and rising awareness of water scarcity issues. Opportunities abound for companies that can offer innovative, sustainable, and cost-effective water treatment solutions tailored to the specific needs of diverse market segments. Strategic investments in research and development, expansion of production capacity, and strategic partnerships will be key to capitalizing on this market potential.
South America Water Treatment Chemicals Industry Segmentation
-
1. Product Type
- 1.1. Flocculant & Coagulants
- 1.2. Biocides & Disinfectants
- 1.3. Defoamers & Defoaming Agents
- 1.4. pH & Adjusters & Softeners
- 1.5. Scale & Corrosion Inhibitors
- 1.6. Others
-
2. End-user Industry
- 2.1. Power
- 2.2. Oil & Gas
- 2.3. Chemical Manufcaturing
- 2.4. Mining & Mineral Processing
- 2.5. Mining and Mineral Processing
- 2.6. Food & Beverage
- 2.7. Pulp & Ppaer
- 2.8. Others
-
3. Geography
- 3.1. Brazil
- 3.2. Argentina
- 3.3. Rest of South America
South America Water Treatment Chemicals Industry Segmentation By Geography
- 1. Brazil
- 2. Argentina
- 3. Rest of South America
South America Water Treatment Chemicals Industry Regional Market Share
Geographic Coverage of South America Water Treatment Chemicals Industry
South America Water Treatment Chemicals Industry REPORT HIGHLIGHTS
| Aspects | Details |
|---|---|
| Study Period | 2020-2034 |
| Base Year | 2025 |
| Estimated Year | 2026 |
| Forecast Period | 2026-2034 |
| Historical Period | 2020-2025 |
| Growth Rate | CAGR of 7.4% from 2020-2034 |
| Segmentation |
|
Table of Contents
- 1. Introduction
- 1.1. Research Scope
- 1.2. Market Segmentation
- 1.3. Research Objective
- 1.4. Definitions and Assumptions
- 2. Executive Summary
- 2.1. Market Snapshot
- 3. Market Dynamics
- 3.1. Market Drivers
- 3.2. Market Restrains
- 3.3. Market Trends
- 3.4. Market Opportunities
- 4. Market Factor Analysis
- 4.1. Porters Five Forces
- 4.1.1. Bargaining Power of Suppliers
- 4.1.2. Bargaining Power of Buyers
- 4.1.3. Threat of New Entrants
- 4.1.4. Threat of Substitutes
- 4.1.5. Competitive Rivalry
- 4.2. PESTEL analysis
- 4.3. BCG Analysis
- 4.3.1. Stars (High Growth, High Market Share)
- 4.3.2. Cash Cows (Low Growth, High Market Share)
- 4.3.3. Question Mark (High Growth, Low Market Share)
- 4.3.4. Dogs (Low Growth, Low Market Share)
- 4.4. Ansoff Matrix Analysis
- 4.5. Supply Chain Analysis
- 4.6. Regulatory Landscape
- 4.7. Current Market Potential and Opportunity Assessment (TAM–SAM–SOM Framework)
- 4.8. RAX Analyst Note
- 4.1. Porters Five Forces
- 5. Market Analysis, Insights and Forecast 2021-2033
- 5.1. Market Analysis, Insights and Forecast - by Product Type
- 5.1.1. Flocculant & Coagulants
- 5.1.2. Biocides & Disinfectants
- 5.1.3. Defoamers & Defoaming Agents
- 5.1.4. pH & Adjusters & Softeners
- 5.1.5. Scale & Corrosion Inhibitors
- 5.1.6. Others
- 5.2. Market Analysis, Insights and Forecast - by End-user Industry
- 5.2.1. Power
- 5.2.2. Oil & Gas
- 5.2.3. Chemical Manufcaturing
- 5.2.4. Mining & Mineral Processing
- 5.2.5. Mining and Mineral Processing
- 5.2.6. Food & Beverage
- 5.2.7. Pulp & Ppaer
- 5.2.8. Others
- 5.3. Market Analysis, Insights and Forecast - by Geography
- 5.3.1. Brazil
- 5.3.2. Argentina
- 5.3.3. Rest of South America
- 5.4. Market Analysis, Insights and Forecast - by Region
- 5.4.1. Brazil
- 5.4.2. Argentina
- 5.4.3. Rest of South America
- 5.1. Market Analysis, Insights and Forecast - by Product Type
- 6. Global South America Water Treatment Chemicals Industry Analysis, Insights and Forecast, 2021-2033
- 6.1. Market Analysis, Insights and Forecast - by Product Type
- 6.1.1. Flocculant & Coagulants
- 6.1.2. Biocides & Disinfectants
- 6.1.3. Defoamers & Defoaming Agents
- 6.1.4. pH & Adjusters & Softeners
- 6.1.5. Scale & Corrosion Inhibitors
- 6.1.6. Others
- 6.2. Market Analysis, Insights and Forecast - by End-user Industry
- 6.2.1. Power
- 6.2.2. Oil & Gas
- 6.2.3. Chemical Manufcaturing
- 6.2.4. Mining & Mineral Processing
- 6.2.5. Mining and Mineral Processing
- 6.2.6. Food & Beverage
- 6.2.7. Pulp & Ppaer
- 6.2.8. Others
- 6.3. Market Analysis, Insights and Forecast - by Geography
- 6.3.1. Brazil
- 6.3.2. Argentina
- 6.3.3. Rest of South America
- 6.1. Market Analysis, Insights and Forecast - by Product Type
- 7. Brazil South America Water Treatment Chemicals Industry Analysis, Insights and Forecast, 2020-2032
- 7.1. Market Analysis, Insights and Forecast - by Product Type
- 7.1.1. Flocculant & Coagulants
- 7.1.2. Biocides & Disinfectants
- 7.1.3. Defoamers & Defoaming Agents
- 7.1.4. pH & Adjusters & Softeners
- 7.1.5. Scale & Corrosion Inhibitors
- 7.1.6. Others
- 7.2. Market Analysis, Insights and Forecast - by End-user Industry
- 7.2.1. Power
- 7.2.2. Oil & Gas
- 7.2.3. Chemical Manufcaturing
- 7.2.4. Mining & Mineral Processing
- 7.2.5. Mining and Mineral Processing
- 7.2.6. Food & Beverage
- 7.2.7. Pulp & Ppaer
- 7.2.8. Others
- 7.3. Market Analysis, Insights and Forecast - by Geography
- 7.3.1. Brazil
- 7.3.2. Argentina
- 7.3.3. Rest of South America
- 7.1. Market Analysis, Insights and Forecast - by Product Type
- 8. Argentina South America Water Treatment Chemicals Industry Analysis, Insights and Forecast, 2020-2032
- 8.1. Market Analysis, Insights and Forecast - by Product Type
- 8.1.1. Flocculant & Coagulants
- 8.1.2. Biocides & Disinfectants
- 8.1.3. Defoamers & Defoaming Agents
- 8.1.4. pH & Adjusters & Softeners
- 8.1.5. Scale & Corrosion Inhibitors
- 8.1.6. Others
- 8.2. Market Analysis, Insights and Forecast - by End-user Industry
- 8.2.1. Power
- 8.2.2. Oil & Gas
- 8.2.3. Chemical Manufcaturing
- 8.2.4. Mining & Mineral Processing
- 8.2.5. Mining and Mineral Processing
- 8.2.6. Food & Beverage
- 8.2.7. Pulp & Ppaer
- 8.2.8. Others
- 8.3. Market Analysis, Insights and Forecast - by Geography
- 8.3.1. Brazil
- 8.3.2. Argentina
- 8.3.3. Rest of South America
- 8.1. Market Analysis, Insights and Forecast - by Product Type
- 9. Rest of South America South America Water Treatment Chemicals Industry Analysis, Insights and Forecast, 2020-2032
- 9.1. Market Analysis, Insights and Forecast - by Product Type
- 9.1.1. Flocculant & Coagulants
- 9.1.2. Biocides & Disinfectants
- 9.1.3. Defoamers & Defoaming Agents
- 9.1.4. pH & Adjusters & Softeners
- 9.1.5. Scale & Corrosion Inhibitors
- 9.1.6. Others
- 9.2. Market Analysis, Insights and Forecast - by End-user Industry
- 9.2.1. Power
- 9.2.2. Oil & Gas
- 9.2.3. Chemical Manufcaturing
- 9.2.4. Mining & Mineral Processing
- 9.2.5. Mining and Mineral Processing
- 9.2.6. Food & Beverage
- 9.2.7. Pulp & Ppaer
- 9.2.8. Others
- 9.3. Market Analysis, Insights and Forecast - by Geography
- 9.3.1. Brazil
- 9.3.2. Argentina
- 9.3.3. Rest of South America
- 9.1. Market Analysis, Insights and Forecast - by Product Type
- 10. Competitive Analysis
- 10.1. Company Profiles
- 10.1.1 Nouryon
- 10.1.1.1. Company Overview
- 10.1.1.2. Products
- 10.1.1.3. Company Financials
- 10.1.1.4. SWOT Analysis
- 10.1.2 Ecolab
- 10.1.2.1. Company Overview
- 10.1.2.2. Products
- 10.1.2.3. Company Financials
- 10.1.2.4. SWOT Analysis
- 10.1.3 Solenis
- 10.1.3.1. Company Overview
- 10.1.3.2. Products
- 10.1.3.3. Company Financials
- 10.1.3.4. SWOT Analysis
- 10.1.4 Kemira
- 10.1.4.1. Company Overview
- 10.1.4.2. Products
- 10.1.4.3. Company Financials
- 10.1.4.4. SWOT Analysis
- 10.1.5 Solvay
- 10.1.5.1. Company Overview
- 10.1.5.2. Products
- 10.1.5.3. Company Financials
- 10.1.5.4. SWOT Analysis
- 10.1.6 Lonza
- 10.1.6.1. Company Overview
- 10.1.6.2. Products
- 10.1.6.3. Company Financials
- 10.1.6.4. SWOT Analysis
- 10.1.7 Kurita Water industries Ltd
- 10.1.7.1. Company Overview
- 10.1.7.2. Products
- 10.1.7.3. Company Financials
- 10.1.7.4. SWOT Analysis
- 10.1.8 SNF
- 10.1.8.1. Company Overview
- 10.1.8.2. Products
- 10.1.8.3. Company Financials
- 10.1.8.4. SWOT Analysis
- 10.1.9 Suez*List Not Exhaustive
- 10.1.9.1. Company Overview
- 10.1.9.2. Products
- 10.1.9.3. Company Financials
- 10.1.9.4. SWOT Analysis
- 10.1.1 Nouryon
- 10.2. Market Entropy
- 10.2.1 Company's Key Areas Served
- 10.2.2 Recent Developments
- 10.3. Company Market Share Analysis 2025
- 10.3.1 Top 5 Companies Market Share Analysis
- 10.3.2 Top 3 Companies Market Share Analysis
- 10.4. List of Potential Customers
- 11. Research Methodology
List of Figures
- Figure 1: Global South America Water Treatment Chemicals Industry Revenue Breakdown (billion, %) by Region 2025 & 2033
- Figure 2: Brazil South America Water Treatment Chemicals Industry Revenue (billion), by Product Type 2025 & 2033
- Figure 3: Brazil South America Water Treatment Chemicals Industry Revenue Share (%), by Product Type 2025 & 2033
- Figure 4: Brazil South America Water Treatment Chemicals Industry Revenue (billion), by End-user Industry 2025 & 2033
- Figure 5: Brazil South America Water Treatment Chemicals Industry Revenue Share (%), by End-user Industry 2025 & 2033
- Figure 6: Brazil South America Water Treatment Chemicals Industry Revenue (billion), by Geography 2025 & 2033
- Figure 7: Brazil South America Water Treatment Chemicals Industry Revenue Share (%), by Geography 2025 & 2033
- Figure 8: Brazil South America Water Treatment Chemicals Industry Revenue (billion), by Country 2025 & 2033
- Figure 9: Brazil South America Water Treatment Chemicals Industry Revenue Share (%), by Country 2025 & 2033
- Figure 10: Argentina South America Water Treatment Chemicals Industry Revenue (billion), by Product Type 2025 & 2033
- Figure 11: Argentina South America Water Treatment Chemicals Industry Revenue Share (%), by Product Type 2025 & 2033
- Figure 12: Argentina South America Water Treatment Chemicals Industry Revenue (billion), by End-user Industry 2025 & 2033
- Figure 13: Argentina South America Water Treatment Chemicals Industry Revenue Share (%), by End-user Industry 2025 & 2033
- Figure 14: Argentina South America Water Treatment Chemicals Industry Revenue (billion), by Geography 2025 & 2033
- Figure 15: Argentina South America Water Treatment Chemicals Industry Revenue Share (%), by Geography 2025 & 2033
- Figure 16: Argentina South America Water Treatment Chemicals Industry Revenue (billion), by Country 2025 & 2033
- Figure 17: Argentina South America Water Treatment Chemicals Industry Revenue Share (%), by Country 2025 & 2033
- Figure 18: Rest of South America South America Water Treatment Chemicals Industry Revenue (billion), by Product Type 2025 & 2033
- Figure 19: Rest of South America South America Water Treatment Chemicals Industry Revenue Share (%), by Product Type 2025 & 2033
- Figure 20: Rest of South America South America Water Treatment Chemicals Industry Revenue (billion), by End-user Industry 2025 & 2033
- Figure 21: Rest of South America South America Water Treatment Chemicals Industry Revenue Share (%), by End-user Industry 2025 & 2033
- Figure 22: Rest of South America South America Water Treatment Chemicals Industry Revenue (billion), by Geography 2025 & 2033
- Figure 23: Rest of South America South America Water Treatment Chemicals Industry Revenue Share (%), by Geography 2025 & 2033
- Figure 24: Rest of South America South America Water Treatment Chemicals Industry Revenue (billion), by Country 2025 & 2033
- Figure 25: Rest of South America South America Water Treatment Chemicals Industry Revenue Share (%), by Country 2025 & 2033
List of Tables
- Table 1: Global South America Water Treatment Chemicals Industry Revenue billion Forecast, by Product Type 2020 & 2033
- Table 2: Global South America Water Treatment Chemicals Industry Revenue billion Forecast, by End-user Industry 2020 & 2033
- Table 3: Global South America Water Treatment Chemicals Industry Revenue billion Forecast, by Geography 2020 & 2033
- Table 4: Global South America Water Treatment Chemicals Industry Revenue billion Forecast, by Region 2020 & 2033
- Table 5: Global South America Water Treatment Chemicals Industry Revenue billion Forecast, by Product Type 2020 & 2033
- Table 6: Global South America Water Treatment Chemicals Industry Revenue billion Forecast, by End-user Industry 2020 & 2033
- Table 7: Global South America Water Treatment Chemicals Industry Revenue billion Forecast, by Geography 2020 & 2033
- Table 8: Global South America Water Treatment Chemicals Industry Revenue billion Forecast, by Country 2020 & 2033
- Table 9: Global South America Water Treatment Chemicals Industry Revenue billion Forecast, by Product Type 2020 & 2033
- Table 10: Global South America Water Treatment Chemicals Industry Revenue billion Forecast, by End-user Industry 2020 & 2033
- Table 11: Global South America Water Treatment Chemicals Industry Revenue billion Forecast, by Geography 2020 & 2033
- Table 12: Global South America Water Treatment Chemicals Industry Revenue billion Forecast, by Country 2020 & 2033
- Table 13: Global South America Water Treatment Chemicals Industry Revenue billion Forecast, by Product Type 2020 & 2033
- Table 14: Global South America Water Treatment Chemicals Industry Revenue billion Forecast, by End-user Industry 2020 & 2033
- Table 15: Global South America Water Treatment Chemicals Industry Revenue billion Forecast, by Geography 2020 & 2033
- Table 16: Global South America Water Treatment Chemicals Industry Revenue billion Forecast, by Country 2020 & 2033
Frequently Asked Questions
1. What is the projected Compound Annual Growth Rate (CAGR) of the South America Water Treatment Chemicals Industry?
The projected CAGR is approximately 7.4%.
2. Which companies are prominent players in the South America Water Treatment Chemicals Industry?
Key companies in the market include Nouryon, Ecolab, Solenis, Kemira, Solvay, Lonza, Kurita Water industries Ltd, SNF, Suez*List Not Exhaustive.
3. What are the main segments of the South America Water Treatment Chemicals Industry?
The market segments include Product Type, End-user Industry, Geography.
4. Can you provide details about the market size?
The market size is estimated to be USD 2.9 billion as of 2022.
5. What are some drivers contributing to market growth?
; Conformance to Stringent Environmental Regulations; Other Drivers.
6. What are the notable trends driving market growth?
Oil & Gas Industry to Dominate the Market.
7. Are there any restraints impacting market growth?
; Conformance to Stringent Environmental Regulations; Other Drivers.
8. Can you provide examples of recent developments in the market?
N/A
9. What pricing options are available for accessing the report?
Pricing options include single-user, multi-user, and enterprise licenses priced at USD 4750, USD 5250, and USD 8750 respectively.
10. Is the market size provided in terms of value or volume?
The market size is provided in terms of value, measured in billion.
11. Are there any specific market keywords associated with the report?
Yes, the market keyword associated with the report is "South America Water Treatment Chemicals Industry," which aids in identifying and referencing the specific market segment covered.
12. How do I determine which pricing option suits my needs best?
The pricing options vary based on user requirements and access needs. Individual users may opt for single-user licenses, while businesses requiring broader access may choose multi-user or enterprise licenses for cost-effective access to the report.
13. Are there any additional resources or data provided in the South America Water Treatment Chemicals Industry report?
While the report offers comprehensive insights, it's advisable to review the specific contents or supplementary materials provided to ascertain if additional resources or data are available.
14. How can I stay updated on further developments or reports in the South America Water Treatment Chemicals Industry?
To stay informed about further developments, trends, and reports in the South America Water Treatment Chemicals Industry, consider subscribing to industry newsletters, following relevant companies and organizations, or regularly checking reputable industry news sources and publications.
Methodology
Step 1 - Identification of Relevant Samples Size from Population Database


Step 2 - Approaches for Defining Global Market Size (Value, Volume* & Price*)

Note*: In applicable scenarios
Step 3 - Data Sources
Primary Research
- Web Analytics
- Survey Reports
- Research Institute
- Latest Research Reports
- Opinion Leaders
Secondary Research
- Annual Reports
- White Paper
- Latest Press Release
- Industry Association
- Paid Database
- Investor Presentations

Step 4 - Data Triangulation
Involves using different sources of information in order to increase the validity of a study
These sources are likely to be stakeholders in a program - participants, other researchers, program staff, other community members, and so on.
Then we put all data in single framework & apply various statistical tools to find out the dynamic on the market.
During the analysis stage, feedback from the stakeholder groups would be compared to determine areas of agreement as well as areas of divergence