

Key Insights
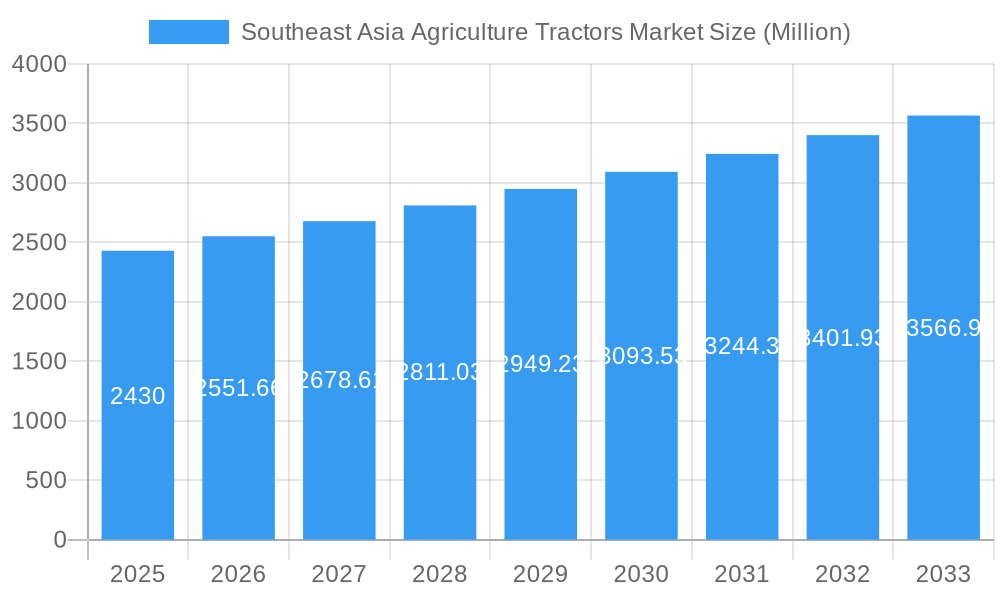
The Southeast Asia agricultural tractor market, valued at $2.43 billion in 2025, is projected to experience robust growth, driven by several key factors. Increasing agricultural mechanization needs in rapidly developing economies like India, Indonesia, Vietnam, and Thailand are fueling demand for efficient and technologically advanced tractors. Government initiatives promoting agricultural modernization and improved infrastructure are further bolstering market expansion. The rising adoption of precision farming techniques, including GPS-guided tractors and automated systems, is also contributing significantly to market growth. This segment is further segmented by tractor type (Orchard, Row-crop, Utility) and horsepower ( <12 HP, 12-99 HP, 100-175 HP, >175 HP), reflecting diverse farming needs across the region. The dominance of major players like Deere & Company, Kubota, and CNH Industrial indicates a competitive landscape with established brands vying for market share. However, challenges remain, including high initial investment costs for tractors, limited access to financing for smallholder farmers, and the need for skilled operators and maintenance services. Despite these restraints, the long-term outlook remains positive, driven by continued economic growth, rising agricultural output targets, and technological advancements in tractor technology. The increasing adoption of smaller, more fuel-efficient tractors tailored to the needs of smaller farms is also expected to contribute substantially to market expansion.
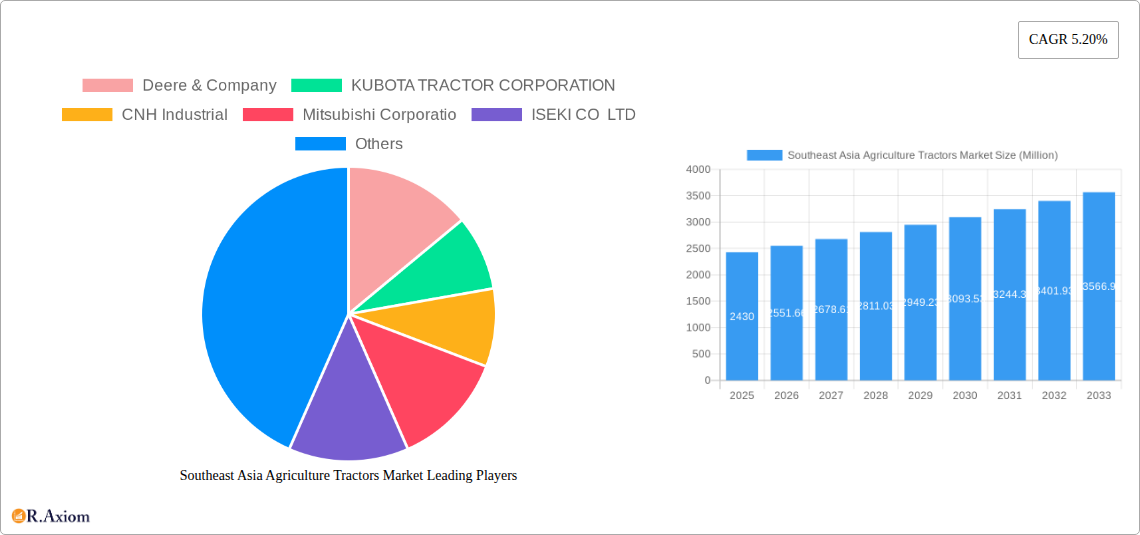
Southeast Asia Agriculture Tractors Market Market Size (In Billion)
The market's growth trajectory will be influenced by several trends, including the increasing adoption of digital technologies in agriculture, the focus on sustainable farming practices, and the demand for higher efficiency and productivity. Government policies promoting sustainable agriculture and food security are also expected to significantly impact the market's growth in Southeast Asia. Companies are strategically investing in research and development to cater to the region's unique farming challenges and preferences. Furthermore, the expansion of rural electrification and improved transportation infrastructure will play a crucial role in easing access to modern farm equipment, ultimately driving market growth. The segment encompassing tractors with horsepower between 12 HP and 99 HP is likely to dominate the market due to its suitability for a large portion of farms in the region. Competition will intensify as new entrants and existing players focus on improving product offerings and expanding their distribution networks.
Southeast Asia Agriculture Tractors Market Company Market Share
Southeast Asia Agriculture Tractors Market: A Comprehensive Report (2019-2033)
This comprehensive report provides an in-depth analysis of the Southeast Asia Agriculture Tractors Market, offering invaluable insights for stakeholders across the agricultural machinery industry. Covering the period from 2019 to 2033, with a focus on 2025, this report examines market trends, competitive dynamics, and future growth prospects. The study incorporates detailed segmentation by tractor type (Orchard, Row-Crop, Utility) and horsepower (Less than 12 HP, 12 HP to 99 HP, 100 HP to 175 HP, Above 175 HP), providing a granular understanding of this dynamic market. Key players like Deere & Company, KUBOTA TRACTOR CORPORATION, CNH Industrial, Mitsubishi Corporation, ISEKI CO LTD, CLAAS KGaA mbH, and YANMAR CO LTD are analyzed for their market share, strategies, and innovations.
Southeast Asia Agriculture Tractors Market Concentration & Innovation
The Southeast Asia agriculture tractor market exhibits a moderately concentrated landscape, with a few major players holding significant market share. However, the presence of numerous regional and smaller players indicates a competitive environment. Innovation is a crucial driver, spurred by the increasing demand for efficiency, precision, and sustainability in farming practices. Regulatory frameworks, particularly those related to emissions and safety standards, influence market dynamics. The market is witnessing increased adoption of technology, like precision farming tools and automation, which are changing the nature of agricultural operations. Product substitutes, including animal labor and smaller, less-mechanized tools, continue to exist but their market share is declining. End-user trends indicate a preference for fuel-efficient, technologically advanced, and easy-to-maintain tractors. M&A activities in recent years have involved modest investments in the range of xx Million to xx Million, with a focus on enhancing technology and expanding regional presence. Increased investments in R&D by leading players such as Deere & Company are driving growth in innovative technologies for farming.
- Market Share: Deere & Company holds an estimated xx% market share, followed by Kubota with xx%.
- M&A Activity: The past five years have seen xx M&A deals, totaling approximately xx Million in value.
Southeast Asia Agriculture Tractors Market Industry Trends & Insights
The Southeast Asia agriculture tractors market is experiencing robust growth, driven by factors such as increasing agricultural land under cultivation, rising demand for food, and government initiatives promoting agricultural modernization. The CAGR during the historical period (2019-2024) was xx%, and is projected to be xx% during the forecast period (2025-2033). Technological advancements, like the introduction of autonomous and electric tractors, are disrupting traditional farming practices, enhancing efficiency, and reducing labor costs. Consumer preferences are shifting towards fuel-efficient models with advanced features, including GPS-guided systems and precision farming tools. Competitive dynamics are shaped by the global players' strategies to capture market share through product innovation and strategic partnerships. Market penetration of technologically advanced tractors is growing, though traditional models still hold a substantial portion of the market.
Dominant Markets & Segments in Southeast Asia Agriculture Tractors Market
The Indonesian and Vietnamese markets are currently the dominant forces in the Southeast Asia agriculture tractor market, driven by their large agricultural sectors and increasing investments in agricultural modernization.
- Leading Regions: Indonesia and Vietnam.
- Leading Segments:
- Type: Utility tractors hold the largest market share due to their versatility.
- Horsepower: The 12 HP to 99 HP segment dominates, reflecting the typical needs of small and medium-sized farms.
Key Drivers for Indonesia and Vietnam:
- Economic Policies: Government support for agricultural development and mechanization.
- Infrastructure: Growing road networks and improved logistics are crucial for tractor sales and distribution.
- Land Area: Extensive arable land provides a substantial market for agricultural equipment.
Southeast Asia Agriculture Tractors Market Product Developments
Recent years have witnessed significant product innovations, including the introduction of autonomous and electric tractors, along with advanced precision farming technologies. These developments enhance efficiency, reduce environmental impact, and improve overall farm productivity. Companies are focusing on developing tractors with increased fuel efficiency and enhanced safety features to meet growing consumer demands. This focus on technological advancement aims to improve market fit by providing solutions tailored to the specific needs of diverse agricultural landscapes in Southeast Asia.
Report Scope & Segmentation Analysis
This report segments the Southeast Asia agriculture tractors market based on tractor type (Orchard, Row-Crop, Utility) and horsepower (Less than 12 HP, 12 HP to 99 HP, 100 HP to 175 HP, Above 175 HP). Each segment is analyzed in terms of market size, growth projections, and competitive dynamics. For example, the Utility Tractor segment is expected to exhibit strong growth due to its adaptability to various farming applications. Similarly, the 12 HP to 99 HP horsepower segment is projected to dominate due to its suitability for a wide range of farm sizes.
Key Drivers of Southeast Asia Agriculture Tractors Market Growth
Several factors drive market growth, including rising food demands, supportive government policies promoting mechanization, increasing agricultural land under cultivation, and technological advancements in tractor design and capabilities, such as the integration of precision farming technologies and automation.
Challenges in the Southeast Asia Agriculture Tractors Market Sector
Challenges include high initial investment costs for advanced tractors, limited access to financing for smallholder farmers, uneven infrastructure development in certain regions impacting distribution and maintenance, and fluctuating fuel prices. These factors pose considerable restraints on market growth.
Emerging Opportunities in Southeast Asia Agriculture Tractors Market
Opportunities exist in the growing adoption of precision farming techniques, the development of fuel-efficient and environmentally friendly tractors, and the expansion into underserved rural markets. The increasing adoption of technology, particularly IoT and data analytics, will create new opportunities for connected agriculture.
Leading Players in the Southeast Asia Agriculture Tractors Market Market
- Deere & Company
- KUBOTA TRACTOR CORPORATION
- CNH Industrial
- Mitsubishi Corporation
- ISEKI CO LTD
- CLAAS KGaA mbH
- YANMAR CO LTD
Key Developments in Southeast Asia Agriculture Tractors Market Industry
- January 2024: Kubota unveiled the New Actually Concept, a fully electric and autonomous tractor at CES 2024. This signals a significant shift towards sustainable and automated farming.
- January 2024: John Deere and Space X partnered to provide satellite communication services to growers, improving connectivity and data access in remote areas.
- February 2024: John Deere launched a wide range of agricultural equipment for the Southeast Asia region at the Commodity Classic trade show, including autonomous-ready tractors, showcasing a commitment to advanced technologies.
Strategic Outlook for Southeast Asia Agriculture Tractors Market Market
The Southeast Asia agriculture tractors market holds significant future potential, driven by ongoing technological advancements, supportive government policies, and the increasing demand for efficient and sustainable farming practices. The market is expected to witness considerable growth, propelled by innovation in automation, precision farming, and electrification. Companies focusing on adapting their products to local needs and offering financing solutions will be best positioned for success.
Southeast Asia Agriculture Tractors Market Segmentation
- 1. Production Analysis
- 2. Consumption Analysis
- 3. Import Market Analysis (Value & Volume)
- 4. Export Market Analysis (Value & Volume)
- 5. Price Trend Analysis
Southeast Asia Agriculture Tractors Market Segmentation By Geography
-
1. North America
- 1.1. United States
- 1.2. Canada
- 1.3. Mexico
-
2. South America
- 2.1. Brazil
- 2.2. Argentina
- 2.3. Rest of South America
-
3. Europe
- 3.1. United Kingdom
- 3.2. Germany
- 3.3. France
- 3.4. Italy
- 3.5. Spain
- 3.6. Russia
- 3.7. Benelux
- 3.8. Nordics
- 3.9. Rest of Europe
-
4. Middle East & Africa
- 4.1. Turkey
- 4.2. Israel
- 4.3. GCC
- 4.4. North Africa
- 4.5. South Africa
- 4.6. Rest of Middle East & Africa
-
5. Asia Pacific
- 5.1. China
- 5.2. India
- 5.3. Japan
- 5.4. South Korea
- 5.5. ASEAN
- 5.6. Oceania
- 5.7. Rest of Asia Pacific
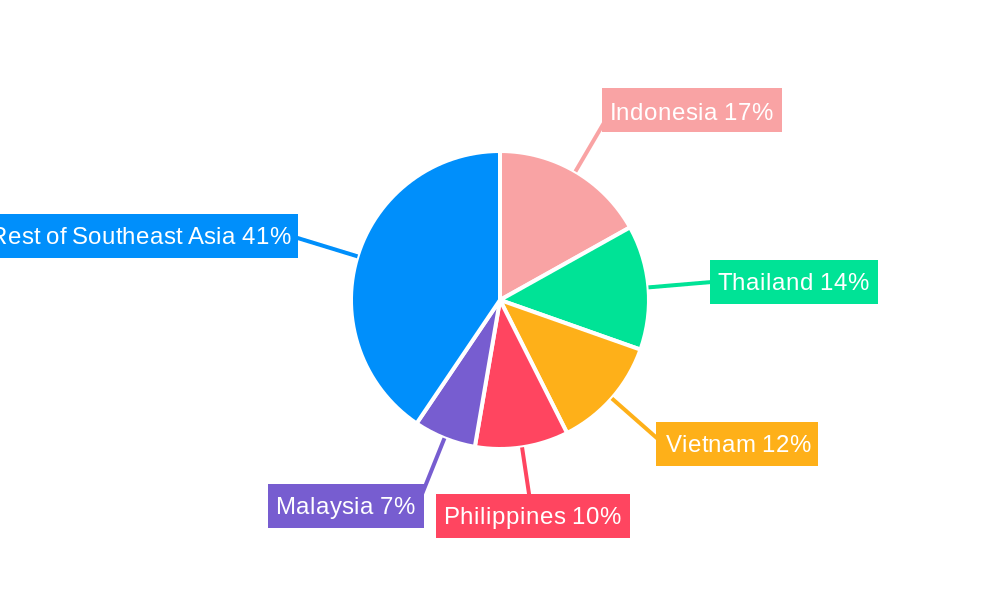
Southeast Asia Agriculture Tractors Market Regional Market Share
Geographic Coverage of Southeast Asia Agriculture Tractors Market
Southeast Asia Agriculture Tractors Market REPORT HIGHLIGHTS
| Aspects | Details |
|---|---|
| Study Period | 2020-2034 |
| Base Year | 2025 |
| Estimated Year | 2026 |
| Forecast Period | 2026-2034 |
| Historical Period | 2020-2025 |
| Growth Rate | CAGR of 5.20% from 2020-2034 |
| Segmentation |
|
Table of Contents
- 1. Introduction
- 1.1. Research Scope
- 1.2. Market Segmentation
- 1.3. Research Objective
- 1.4. Definitions and Assumptions
- 2. Executive Summary
- 2.1. Market Snapshot
- 3. Market Dynamics
- 3.1. Market Drivers
- 3.2. Market Restrains
- 3.3. Market Trends
- 3.4. Market Opportunities
- 4. Market Factor Analysis
- 4.1. Porters Five Forces
- 4.1.1. Bargaining Power of Suppliers
- 4.1.2. Bargaining Power of Buyers
- 4.1.3. Threat of New Entrants
- 4.1.4. Threat of Substitutes
- 4.1.5. Competitive Rivalry
- 4.2. PESTEL analysis
- 4.3. BCG Analysis
- 4.3.1. Stars (High Growth, High Market Share)
- 4.3.2. Cash Cows (Low Growth, High Market Share)
- 4.3.3. Question Mark (High Growth, Low Market Share)
- 4.3.4. Dogs (Low Growth, Low Market Share)
- 4.4. Ansoff Matrix Analysis
- 4.5. Supply Chain Analysis
- 4.6. Regulatory Landscape
- 4.7. Current Market Potential and Opportunity Assessment (TAM–SAM–SOM Framework)
- 4.8. RAX Analyst Note
- 4.1. Porters Five Forces
- 5. Market Analysis, Insights and Forecast 2021-2033
- 5.1. Market Analysis, Insights and Forecast - by Production Analysis
- 5.2. Market Analysis, Insights and Forecast - by Consumption Analysis
- 5.3. Market Analysis, Insights and Forecast - by Import Market Analysis (Value & Volume)
- 5.4. Market Analysis, Insights and Forecast - by Export Market Analysis (Value & Volume)
- 5.5. Market Analysis, Insights and Forecast - by Price Trend Analysis
- 5.6. Market Analysis, Insights and Forecast - by Region
- 5.6.1. North America
- 5.6.2. South America
- 5.6.3. Europe
- 5.6.4. Middle East & Africa
- 5.6.5. Asia Pacific
- 6. Global Southeast Asia Agriculture Tractors Market Analysis, Insights and Forecast, 2021-2033
- 6.1. Market Analysis, Insights and Forecast - by Production Analysis
- 6.2. Market Analysis, Insights and Forecast - by Consumption Analysis
- 6.3. Market Analysis, Insights and Forecast - by Import Market Analysis (Value & Volume)
- 6.4. Market Analysis, Insights and Forecast - by Export Market Analysis (Value & Volume)
- 6.5. Market Analysis, Insights and Forecast - by Price Trend Analysis
- 7. North America Southeast Asia Agriculture Tractors Market Analysis, Insights and Forecast, 2020-2032
- 7.1. Market Analysis, Insights and Forecast - by Production Analysis
- 7.2. Market Analysis, Insights and Forecast - by Consumption Analysis
- 7.3. Market Analysis, Insights and Forecast - by Import Market Analysis (Value & Volume)
- 7.4. Market Analysis, Insights and Forecast - by Export Market Analysis (Value & Volume)
- 7.5. Market Analysis, Insights and Forecast - by Price Trend Analysis
- 8. South America Southeast Asia Agriculture Tractors Market Analysis, Insights and Forecast, 2020-2032
- 8.1. Market Analysis, Insights and Forecast - by Production Analysis
- 8.2. Market Analysis, Insights and Forecast - by Consumption Analysis
- 8.3. Market Analysis, Insights and Forecast - by Import Market Analysis (Value & Volume)
- 8.4. Market Analysis, Insights and Forecast - by Export Market Analysis (Value & Volume)
- 8.5. Market Analysis, Insights and Forecast - by Price Trend Analysis
- 9. Europe Southeast Asia Agriculture Tractors Market Analysis, Insights and Forecast, 2020-2032
- 9.1. Market Analysis, Insights and Forecast - by Production Analysis
- 9.2. Market Analysis, Insights and Forecast - by Consumption Analysis
- 9.3. Market Analysis, Insights and Forecast - by Import Market Analysis (Value & Volume)
- 9.4. Market Analysis, Insights and Forecast - by Export Market Analysis (Value & Volume)
- 9.5. Market Analysis, Insights and Forecast - by Price Trend Analysis
- 10. Middle East & Africa Southeast Asia Agriculture Tractors Market Analysis, Insights and Forecast, 2020-2032
- 10.1. Market Analysis, Insights and Forecast - by Production Analysis
- 10.2. Market Analysis, Insights and Forecast - by Consumption Analysis
- 10.3. Market Analysis, Insights and Forecast - by Import Market Analysis (Value & Volume)
- 10.4. Market Analysis, Insights and Forecast - by Export Market Analysis (Value & Volume)
- 10.5. Market Analysis, Insights and Forecast - by Price Trend Analysis
- 11. Asia Pacific Southeast Asia Agriculture Tractors Market Analysis, Insights and Forecast, 2020-2032
- 11.1. Market Analysis, Insights and Forecast - by Production Analysis
- 11.2. Market Analysis, Insights and Forecast - by Consumption Analysis
- 11.3. Market Analysis, Insights and Forecast - by Import Market Analysis (Value & Volume)
- 11.4. Market Analysis, Insights and Forecast - by Export Market Analysis (Value & Volume)
- 11.5. Market Analysis, Insights and Forecast - by Price Trend Analysis
- 12. Competitive Analysis
- 12.1. Company Profiles
- 12.1.1 Deere & Company
- 12.1.1.1. Company Overview
- 12.1.1.2. Products
- 12.1.1.3. Company Financials
- 12.1.1.4. SWOT Analysis
- 12.1.2 KUBOTA TRACTOR CORPORATION
- 12.1.2.1. Company Overview
- 12.1.2.2. Products
- 12.1.2.3. Company Financials
- 12.1.2.4. SWOT Analysis
- 12.1.3 CNH Industrial
- 12.1.3.1. Company Overview
- 12.1.3.2. Products
- 12.1.3.3. Company Financials
- 12.1.3.4. SWOT Analysis
- 12.1.4 Mitsubishi Corporatio
- 12.1.4.1. Company Overview
- 12.1.4.2. Products
- 12.1.4.3. Company Financials
- 12.1.4.4. SWOT Analysis
- 12.1.5 ISEKI CO LTD
- 12.1.5.1. Company Overview
- 12.1.5.2. Products
- 12.1.5.3. Company Financials
- 12.1.5.4. SWOT Analysis
- 12.1.6 CLAAS KGaA mbH
- 12.1.6.1. Company Overview
- 12.1.6.2. Products
- 12.1.6.3. Company Financials
- 12.1.6.4. SWOT Analysis
- 12.1.7 YANMAR CO LTD
- 12.1.7.1. Company Overview
- 12.1.7.2. Products
- 12.1.7.3. Company Financials
- 12.1.7.4. SWOT Analysis
- 12.1.1 Deere & Company
- 12.2. Market Entropy
- 12.2.1 Company's Key Areas Served
- 12.2.2 Recent Developments
- 12.3. Company Market Share Analysis 2025
- 12.3.1 Top 5 Companies Market Share Analysis
- 12.3.2 Top 3 Companies Market Share Analysis
- 12.4. List of Potential Customers
- 13. Research Methodology
List of Figures
- Figure 1: Global Southeast Asia Agriculture Tractors Market Revenue Breakdown (Million, %) by Region 2025 & 2033
- Figure 2: North America Southeast Asia Agriculture Tractors Market Revenue (Million), by Production Analysis 2025 & 2033
- Figure 3: North America Southeast Asia Agriculture Tractors Market Revenue Share (%), by Production Analysis 2025 & 2033
- Figure 4: North America Southeast Asia Agriculture Tractors Market Revenue (Million), by Consumption Analysis 2025 & 2033
- Figure 5: North America Southeast Asia Agriculture Tractors Market Revenue Share (%), by Consumption Analysis 2025 & 2033
- Figure 6: North America Southeast Asia Agriculture Tractors Market Revenue (Million), by Import Market Analysis (Value & Volume) 2025 & 2033
- Figure 7: North America Southeast Asia Agriculture Tractors Market Revenue Share (%), by Import Market Analysis (Value & Volume) 2025 & 2033
- Figure 8: North America Southeast Asia Agriculture Tractors Market Revenue (Million), by Export Market Analysis (Value & Volume) 2025 & 2033
- Figure 9: North America Southeast Asia Agriculture Tractors Market Revenue Share (%), by Export Market Analysis (Value & Volume) 2025 & 2033
- Figure 10: North America Southeast Asia Agriculture Tractors Market Revenue (Million), by Price Trend Analysis 2025 & 2033
- Figure 11: North America Southeast Asia Agriculture Tractors Market Revenue Share (%), by Price Trend Analysis 2025 & 2033
- Figure 12: North America Southeast Asia Agriculture Tractors Market Revenue (Million), by Country 2025 & 2033
- Figure 13: North America Southeast Asia Agriculture Tractors Market Revenue Share (%), by Country 2025 & 2033
- Figure 14: South America Southeast Asia Agriculture Tractors Market Revenue (Million), by Production Analysis 2025 & 2033
- Figure 15: South America Southeast Asia Agriculture Tractors Market Revenue Share (%), by Production Analysis 2025 & 2033
- Figure 16: South America Southeast Asia Agriculture Tractors Market Revenue (Million), by Consumption Analysis 2025 & 2033
- Figure 17: South America Southeast Asia Agriculture Tractors Market Revenue Share (%), by Consumption Analysis 2025 & 2033
- Figure 18: South America Southeast Asia Agriculture Tractors Market Revenue (Million), by Import Market Analysis (Value & Volume) 2025 & 2033
- Figure 19: South America Southeast Asia Agriculture Tractors Market Revenue Share (%), by Import Market Analysis (Value & Volume) 2025 & 2033
- Figure 20: South America Southeast Asia Agriculture Tractors Market Revenue (Million), by Export Market Analysis (Value & Volume) 2025 & 2033
- Figure 21: South America Southeast Asia Agriculture Tractors Market Revenue Share (%), by Export Market Analysis (Value & Volume) 2025 & 2033
- Figure 22: South America Southeast Asia Agriculture Tractors Market Revenue (Million), by Price Trend Analysis 2025 & 2033
- Figure 23: South America Southeast Asia Agriculture Tractors Market Revenue Share (%), by Price Trend Analysis 2025 & 2033
- Figure 24: South America Southeast Asia Agriculture Tractors Market Revenue (Million), by Country 2025 & 2033
- Figure 25: South America Southeast Asia Agriculture Tractors Market Revenue Share (%), by Country 2025 & 2033
- Figure 26: Europe Southeast Asia Agriculture Tractors Market Revenue (Million), by Production Analysis 2025 & 2033
- Figure 27: Europe Southeast Asia Agriculture Tractors Market Revenue Share (%), by Production Analysis 2025 & 2033
- Figure 28: Europe Southeast Asia Agriculture Tractors Market Revenue (Million), by Consumption Analysis 2025 & 2033
- Figure 29: Europe Southeast Asia Agriculture Tractors Market Revenue Share (%), by Consumption Analysis 2025 & 2033
- Figure 30: Europe Southeast Asia Agriculture Tractors Market Revenue (Million), by Import Market Analysis (Value & Volume) 2025 & 2033
- Figure 31: Europe Southeast Asia Agriculture Tractors Market Revenue Share (%), by Import Market Analysis (Value & Volume) 2025 & 2033
- Figure 32: Europe Southeast Asia Agriculture Tractors Market Revenue (Million), by Export Market Analysis (Value & Volume) 2025 & 2033
- Figure 33: Europe Southeast Asia Agriculture Tractors Market Revenue Share (%), by Export Market Analysis (Value & Volume) 2025 & 2033
- Figure 34: Europe Southeast Asia Agriculture Tractors Market Revenue (Million), by Price Trend Analysis 2025 & 2033
- Figure 35: Europe Southeast Asia Agriculture Tractors Market Revenue Share (%), by Price Trend Analysis 2025 & 2033
- Figure 36: Europe Southeast Asia Agriculture Tractors Market Revenue (Million), by Country 2025 & 2033
- Figure 37: Europe Southeast Asia Agriculture Tractors Market Revenue Share (%), by Country 2025 & 2033
- Figure 38: Middle East & Africa Southeast Asia Agriculture Tractors Market Revenue (Million), by Production Analysis 2025 & 2033
- Figure 39: Middle East & Africa Southeast Asia Agriculture Tractors Market Revenue Share (%), by Production Analysis 2025 & 2033
- Figure 40: Middle East & Africa Southeast Asia Agriculture Tractors Market Revenue (Million), by Consumption Analysis 2025 & 2033
- Figure 41: Middle East & Africa Southeast Asia Agriculture Tractors Market Revenue Share (%), by Consumption Analysis 2025 & 2033
- Figure 42: Middle East & Africa Southeast Asia Agriculture Tractors Market Revenue (Million), by Import Market Analysis (Value & Volume) 2025 & 2033
- Figure 43: Middle East & Africa Southeast Asia Agriculture Tractors Market Revenue Share (%), by Import Market Analysis (Value & Volume) 2025 & 2033
- Figure 44: Middle East & Africa Southeast Asia Agriculture Tractors Market Revenue (Million), by Export Market Analysis (Value & Volume) 2025 & 2033
- Figure 45: Middle East & Africa Southeast Asia Agriculture Tractors Market Revenue Share (%), by Export Market Analysis (Value & Volume) 2025 & 2033
- Figure 46: Middle East & Africa Southeast Asia Agriculture Tractors Market Revenue (Million), by Price Trend Analysis 2025 & 2033
- Figure 47: Middle East & Africa Southeast Asia Agriculture Tractors Market Revenue Share (%), by Price Trend Analysis 2025 & 2033
- Figure 48: Middle East & Africa Southeast Asia Agriculture Tractors Market Revenue (Million), by Country 2025 & 2033
- Figure 49: Middle East & Africa Southeast Asia Agriculture Tractors Market Revenue Share (%), by Country 2025 & 2033
- Figure 50: Asia Pacific Southeast Asia Agriculture Tractors Market Revenue (Million), by Production Analysis 2025 & 2033
- Figure 51: Asia Pacific Southeast Asia Agriculture Tractors Market Revenue Share (%), by Production Analysis 2025 & 2033
- Figure 52: Asia Pacific Southeast Asia Agriculture Tractors Market Revenue (Million), by Consumption Analysis 2025 & 2033
- Figure 53: Asia Pacific Southeast Asia Agriculture Tractors Market Revenue Share (%), by Consumption Analysis 2025 & 2033
- Figure 54: Asia Pacific Southeast Asia Agriculture Tractors Market Revenue (Million), by Import Market Analysis (Value & Volume) 2025 & 2033
- Figure 55: Asia Pacific Southeast Asia Agriculture Tractors Market Revenue Share (%), by Import Market Analysis (Value & Volume) 2025 & 2033
- Figure 56: Asia Pacific Southeast Asia Agriculture Tractors Market Revenue (Million), by Export Market Analysis (Value & Volume) 2025 & 2033
- Figure 57: Asia Pacific Southeast Asia Agriculture Tractors Market Revenue Share (%), by Export Market Analysis (Value & Volume) 2025 & 2033
- Figure 58: Asia Pacific Southeast Asia Agriculture Tractors Market Revenue (Million), by Price Trend Analysis 2025 & 2033
- Figure 59: Asia Pacific Southeast Asia Agriculture Tractors Market Revenue Share (%), by Price Trend Analysis 2025 & 2033
- Figure 60: Asia Pacific Southeast Asia Agriculture Tractors Market Revenue (Million), by Country 2025 & 2033
- Figure 61: Asia Pacific Southeast Asia Agriculture Tractors Market Revenue Share (%), by Country 2025 & 2033
List of Tables
- Table 1: Global Southeast Asia Agriculture Tractors Market Revenue Million Forecast, by Production Analysis 2020 & 2033
- Table 2: Global Southeast Asia Agriculture Tractors Market Revenue Million Forecast, by Consumption Analysis 2020 & 2033
- Table 3: Global Southeast Asia Agriculture Tractors Market Revenue Million Forecast, by Import Market Analysis (Value & Volume) 2020 & 2033
- Table 4: Global Southeast Asia Agriculture Tractors Market Revenue Million Forecast, by Export Market Analysis (Value & Volume) 2020 & 2033
- Table 5: Global Southeast Asia Agriculture Tractors Market Revenue Million Forecast, by Price Trend Analysis 2020 & 2033
- Table 6: Global Southeast Asia Agriculture Tractors Market Revenue Million Forecast, by Region 2020 & 2033
- Table 7: Global Southeast Asia Agriculture Tractors Market Revenue Million Forecast, by Production Analysis 2020 & 2033
- Table 8: Global Southeast Asia Agriculture Tractors Market Revenue Million Forecast, by Consumption Analysis 2020 & 2033
- Table 9: Global Southeast Asia Agriculture Tractors Market Revenue Million Forecast, by Import Market Analysis (Value & Volume) 2020 & 2033
- Table 10: Global Southeast Asia Agriculture Tractors Market Revenue Million Forecast, by Export Market Analysis (Value & Volume) 2020 & 2033
- Table 11: Global Southeast Asia Agriculture Tractors Market Revenue Million Forecast, by Price Trend Analysis 2020 & 2033
- Table 12: Global Southeast Asia Agriculture Tractors Market Revenue Million Forecast, by Country 2020 & 2033
- Table 13: United States Southeast Asia Agriculture Tractors Market Revenue (Million) Forecast, by Application 2020 & 2033
- Table 14: Canada Southeast Asia Agriculture Tractors Market Revenue (Million) Forecast, by Application 2020 & 2033
- Table 15: Mexico Southeast Asia Agriculture Tractors Market Revenue (Million) Forecast, by Application 2020 & 2033
- Table 16: Global Southeast Asia Agriculture Tractors Market Revenue Million Forecast, by Production Analysis 2020 & 2033
- Table 17: Global Southeast Asia Agriculture Tractors Market Revenue Million Forecast, by Consumption Analysis 2020 & 2033
- Table 18: Global Southeast Asia Agriculture Tractors Market Revenue Million Forecast, by Import Market Analysis (Value & Volume) 2020 & 2033
- Table 19: Global Southeast Asia Agriculture Tractors Market Revenue Million Forecast, by Export Market Analysis (Value & Volume) 2020 & 2033
- Table 20: Global Southeast Asia Agriculture Tractors Market Revenue Million Forecast, by Price Trend Analysis 2020 & 2033
- Table 21: Global Southeast Asia Agriculture Tractors Market Revenue Million Forecast, by Country 2020 & 2033
- Table 22: Brazil Southeast Asia Agriculture Tractors Market Revenue (Million) Forecast, by Application 2020 & 2033
- Table 23: Argentina Southeast Asia Agriculture Tractors Market Revenue (Million) Forecast, by Application 2020 & 2033
- Table 24: Rest of South America Southeast Asia Agriculture Tractors Market Revenue (Million) Forecast, by Application 2020 & 2033
- Table 25: Global Southeast Asia Agriculture Tractors Market Revenue Million Forecast, by Production Analysis 2020 & 2033
- Table 26: Global Southeast Asia Agriculture Tractors Market Revenue Million Forecast, by Consumption Analysis 2020 & 2033
- Table 27: Global Southeast Asia Agriculture Tractors Market Revenue Million Forecast, by Import Market Analysis (Value & Volume) 2020 & 2033
- Table 28: Global Southeast Asia Agriculture Tractors Market Revenue Million Forecast, by Export Market Analysis (Value & Volume) 2020 & 2033
- Table 29: Global Southeast Asia Agriculture Tractors Market Revenue Million Forecast, by Price Trend Analysis 2020 & 2033
- Table 30: Global Southeast Asia Agriculture Tractors Market Revenue Million Forecast, by Country 2020 & 2033
- Table 31: United Kingdom Southeast Asia Agriculture Tractors Market Revenue (Million) Forecast, by Application 2020 & 2033
- Table 32: Germany Southeast Asia Agriculture Tractors Market Revenue (Million) Forecast, by Application 2020 & 2033
- Table 33: France Southeast Asia Agriculture Tractors Market Revenue (Million) Forecast, by Application 2020 & 2033
- Table 34: Italy Southeast Asia Agriculture Tractors Market Revenue (Million) Forecast, by Application 2020 & 2033
- Table 35: Spain Southeast Asia Agriculture Tractors Market Revenue (Million) Forecast, by Application 2020 & 2033
- Table 36: Russia Southeast Asia Agriculture Tractors Market Revenue (Million) Forecast, by Application 2020 & 2033
- Table 37: Benelux Southeast Asia Agriculture Tractors Market Revenue (Million) Forecast, by Application 2020 & 2033
- Table 38: Nordics Southeast Asia Agriculture Tractors Market Revenue (Million) Forecast, by Application 2020 & 2033
- Table 39: Rest of Europe Southeast Asia Agriculture Tractors Market Revenue (Million) Forecast, by Application 2020 & 2033
- Table 40: Global Southeast Asia Agriculture Tractors Market Revenue Million Forecast, by Production Analysis 2020 & 2033
- Table 41: Global Southeast Asia Agriculture Tractors Market Revenue Million Forecast, by Consumption Analysis 2020 & 2033
- Table 42: Global Southeast Asia Agriculture Tractors Market Revenue Million Forecast, by Import Market Analysis (Value & Volume) 2020 & 2033
- Table 43: Global Southeast Asia Agriculture Tractors Market Revenue Million Forecast, by Export Market Analysis (Value & Volume) 2020 & 2033
- Table 44: Global Southeast Asia Agriculture Tractors Market Revenue Million Forecast, by Price Trend Analysis 2020 & 2033
- Table 45: Global Southeast Asia Agriculture Tractors Market Revenue Million Forecast, by Country 2020 & 2033
- Table 46: Turkey Southeast Asia Agriculture Tractors Market Revenue (Million) Forecast, by Application 2020 & 2033
- Table 47: Israel Southeast Asia Agriculture Tractors Market Revenue (Million) Forecast, by Application 2020 & 2033
- Table 48: GCC Southeast Asia Agriculture Tractors Market Revenue (Million) Forecast, by Application 2020 & 2033
- Table 49: North Africa Southeast Asia Agriculture Tractors Market Revenue (Million) Forecast, by Application 2020 & 2033
- Table 50: South Africa Southeast Asia Agriculture Tractors Market Revenue (Million) Forecast, by Application 2020 & 2033
- Table 51: Rest of Middle East & Africa Southeast Asia Agriculture Tractors Market Revenue (Million) Forecast, by Application 2020 & 2033
- Table 52: Global Southeast Asia Agriculture Tractors Market Revenue Million Forecast, by Production Analysis 2020 & 2033
- Table 53: Global Southeast Asia Agriculture Tractors Market Revenue Million Forecast, by Consumption Analysis 2020 & 2033
- Table 54: Global Southeast Asia Agriculture Tractors Market Revenue Million Forecast, by Import Market Analysis (Value & Volume) 2020 & 2033
- Table 55: Global Southeast Asia Agriculture Tractors Market Revenue Million Forecast, by Export Market Analysis (Value & Volume) 2020 & 2033
- Table 56: Global Southeast Asia Agriculture Tractors Market Revenue Million Forecast, by Price Trend Analysis 2020 & 2033
- Table 57: Global Southeast Asia Agriculture Tractors Market Revenue Million Forecast, by Country 2020 & 2033
- Table 58: China Southeast Asia Agriculture Tractors Market Revenue (Million) Forecast, by Application 2020 & 2033
- Table 59: India Southeast Asia Agriculture Tractors Market Revenue (Million) Forecast, by Application 2020 & 2033
- Table 60: Japan Southeast Asia Agriculture Tractors Market Revenue (Million) Forecast, by Application 2020 & 2033
- Table 61: South Korea Southeast Asia Agriculture Tractors Market Revenue (Million) Forecast, by Application 2020 & 2033
- Table 62: ASEAN Southeast Asia Agriculture Tractors Market Revenue (Million) Forecast, by Application 2020 & 2033
- Table 63: Oceania Southeast Asia Agriculture Tractors Market Revenue (Million) Forecast, by Application 2020 & 2033
- Table 64: Rest of Asia Pacific Southeast Asia Agriculture Tractors Market Revenue (Million) Forecast, by Application 2020 & 2033
Frequently Asked Questions
1. What is the projected Compound Annual Growth Rate (CAGR) of the Southeast Asia Agriculture Tractors Market?
The projected CAGR is approximately 5.20%.
2. Which companies are prominent players in the Southeast Asia Agriculture Tractors Market?
Key companies in the market include Deere & Company, KUBOTA TRACTOR CORPORATION, CNH Industrial, Mitsubishi Corporatio, ISEKI CO LTD, CLAAS KGaA mbH, YANMAR CO LTD.
3. What are the main segments of the Southeast Asia Agriculture Tractors Market?
The market segments include Production Analysis, Consumption Analysis, Import Market Analysis (Value & Volume), Export Market Analysis (Value & Volume), Price Trend Analysis.
4. Can you provide details about the market size?
The market size is estimated to be USD 2.43 Million as of 2022.
5. What are some drivers contributing to market growth?
Skilled Labor Shortage; Favorable Government Policies.
6. What are the notable trends driving market growth?
Shortage of Skilled Farm Labor is Driving the Market.
7. Are there any restraints impacting market growth?
Fragmentation of Land Holdings; Increasing Interest of Farmers Toward Custom Hiring Center.
8. Can you provide examples of recent developments in the market?
February 2024: John Deere launched a wide range of agriculture equipment for the Southeast Asia region at the Commodity Classic trade show, including Autonomy-ready high-horsepower 9RX series tractors, C-Series air carts, and sprayers with weed-sensing technology. The company is committed to providing farmers innovative solutions to boost productivity, efficiency, and sustainability.
9. What pricing options are available for accessing the report?
Pricing options include single-user, multi-user, and enterprise licenses priced at USD 4750, USD 5250, and USD 8750 respectively.
10. Is the market size provided in terms of value or volume?
The market size is provided in terms of value, measured in Million.
11. Are there any specific market keywords associated with the report?
Yes, the market keyword associated with the report is "Southeast Asia Agriculture Tractors Market," which aids in identifying and referencing the specific market segment covered.
12. How do I determine which pricing option suits my needs best?
The pricing options vary based on user requirements and access needs. Individual users may opt for single-user licenses, while businesses requiring broader access may choose multi-user or enterprise licenses for cost-effective access to the report.
13. Are there any additional resources or data provided in the Southeast Asia Agriculture Tractors Market report?
While the report offers comprehensive insights, it's advisable to review the specific contents or supplementary materials provided to ascertain if additional resources or data are available.
14. How can I stay updated on further developments or reports in the Southeast Asia Agriculture Tractors Market?
To stay informed about further developments, trends, and reports in the Southeast Asia Agriculture Tractors Market, consider subscribing to industry newsletters, following relevant companies and organizations, or regularly checking reputable industry news sources and publications.
Methodology
Step 1 - Identification of Relevant Samples Size from Population Database


Step 2 - Approaches for Defining Global Market Size (Value, Volume* & Price*)

Note*: In applicable scenarios
Step 3 - Data Sources
Primary Research
- Web Analytics
- Survey Reports
- Research Institute
- Latest Research Reports
- Opinion Leaders
Secondary Research
- Annual Reports
- White Paper
- Latest Press Release
- Industry Association
- Paid Database
- Investor Presentations

Step 4 - Data Triangulation
Involves using different sources of information in order to increase the validity of a study
These sources are likely to be stakeholders in a program - participants, other researchers, program staff, other community members, and so on.
Then we put all data in single framework & apply various statistical tools to find out the dynamic on the market.
During the analysis stage, feedback from the stakeholder groups would be compared to determine areas of agreement as well as areas of divergence