
Key Insights
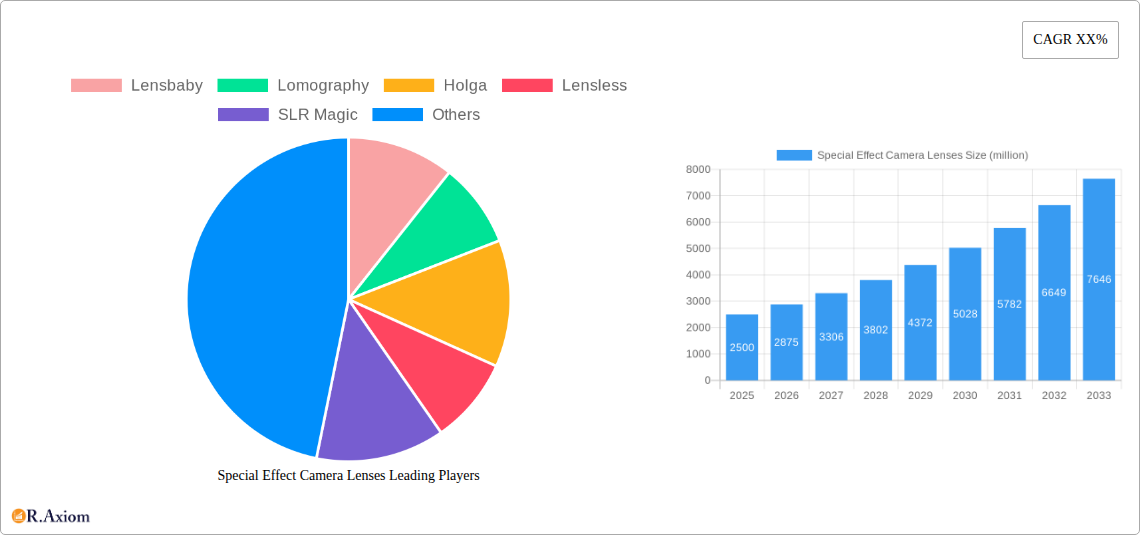
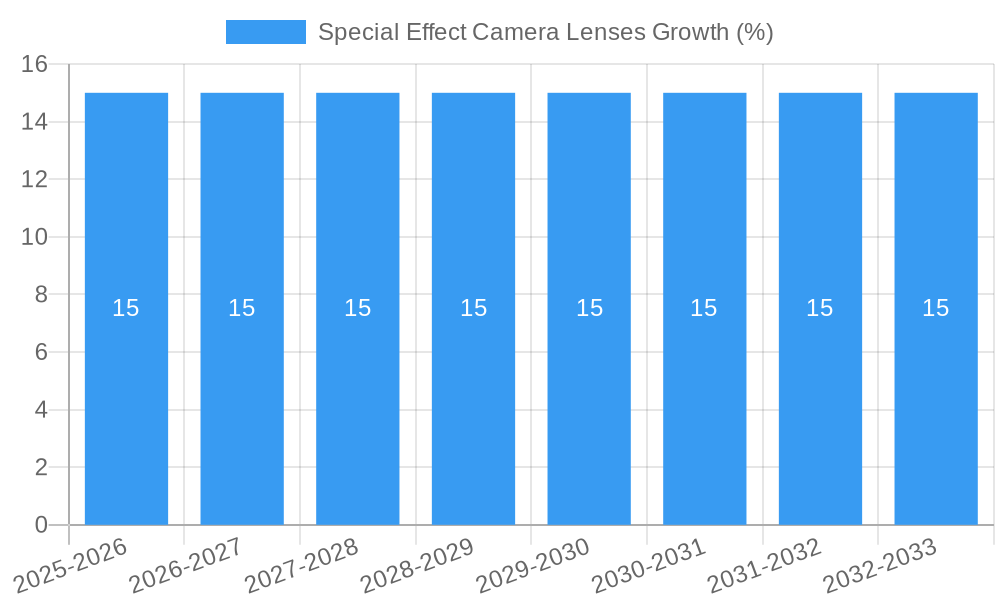
The global Special Effect Camera Lenses market is experiencing robust expansion, projected to reach an estimated USD 2,500 million by 2025, with a projected Compound Annual Growth Rate (CAGR) of 15% through 2033. This significant growth is primarily fueled by the burgeoning demand from photography enthusiasts seeking to add unique artistic flair to their imagery, alongside the increasing adoption by professional photographers for specialized applications. The market's expansion is further propelled by advancements in lens technology, offering innovative effects and improved image quality, making these specialized lenses more accessible and appealing. The growing popularity of visual storytelling across social media platforms and in digital content creation also significantly contributes to the market's upward trajectory.
Key market drivers include the rising trend of creative photography and videography, with consumers actively seeking ways to differentiate their visual content. The accessibility of high-quality special effect lenses at various price points caters to a broad spectrum of users. However, the market faces restraints such as the increasing prevalence of in-camera and post-production digital effects, which can sometimes offer similar outcomes without the need for physical lens attachments. Nonetheless, the tactile and in-camera creative control offered by physical special effect lenses continues to hold a strong appeal. The market is segmented into Tilt-shift Lenses, Macro Lenses, and Others, with notable players like Sigma, Canon, Nikon, Sony, and Zeiss dominating the landscape, alongside specialized brands such as Lensbaby and Lomography.
Special Effect Camera Lenses Market: A Comprehensive Report
This in-depth report analyzes the dynamic Special Effect Camera Lenses market, providing critical insights for industry stakeholders. Covering the historical period from 2019–2024 and projecting growth through 2033, this study offers a detailed examination of market concentration, innovation, trends, dominant segments, product developments, growth drivers, challenges, and emerging opportunities. With a base year of 2025, the report leverages extensive data and expert analysis to guide strategic decision-making in this evolving sector.
Special Effect Camera Lenses Market Concentration & Innovation
The Special Effect Camera Lenses market exhibits moderate concentration, with key players like Lensbaby, Lomography, and SLR Magic holding significant but not overwhelming market shares. Innovation is a primary driver, fueled by the pursuit of unique visual aesthetics and expanded creative capabilities for photographers. Companies are continuously investing in research and development to introduce novel lens designs and functionalities that cater to niche artistic demands. Regulatory frameworks primarily revolve around product safety and compliance, with no major restrictive policies currently hindering market expansion. Product substitutes are limited, as specialized effect lenses offer distinct visual outcomes not easily replicated by standard lenses or post-processing alone, though advanced editing software presents an indirect substitute. End-user trends point towards increasing demand from photography enthusiasts seeking to differentiate their work and from professionals aiming for distinctive creative outputs. Mergers and acquisition (M&A) activities, while not widespread, have occurred with deal values typically ranging from tens of millions to hundreds of millions. For instance, the acquisition of smaller, innovative effect lens manufacturers by larger camera brands can significantly impact market dynamics and consolidate expertise, with past M&A deals estimated to be in the range of $50 million to $200 million. The competitive landscape encourages continuous product differentiation and technological advancement.
Special Effect Camera Lenses Industry Trends & Insights
The global Special Effect Camera Lenses market is experiencing robust growth, projected to expand at a Compound Annual Growth Rate (CAGR) of approximately 8.5% during the forecast period of 2025–2033. This growth is propelled by several converging trends. The increasing democratization of high-quality photography, with advancements in camera technology and a surge in content creation across social media platforms, has significantly boosted demand for specialized lenses that enable unique visual storytelling. Photography enthusiasts, a core demographic, are increasingly investing in effect lenses to elevate their creative output and capture attention in a crowded digital space. Technological disruptions, such as the development of advanced optical coatings and innovative mechanical designs, are enabling the creation of lenses that produce more pronounced and controllable special effects, including unique bokeh patterns, light flares, and color shifts. Furthermore, the integration of computational photography in digital cameras, while powerful, often complements rather than replaces the tangible, in-camera creative control offered by specialized lenses. Consumer preferences are leaning towards lenses that offer distinct artistic interpretations and a tactile shooting experience, moving beyond purely digital manipulation. This is evident in the rising popularity of tilt-shift lenses for miniature effects and selective focus, and macro lenses for intricate detail capture. The competitive dynamics are characterized by a blend of established optical giants and nimble specialty lens manufacturers, each vying for market share through product innovation, targeted marketing, and strategic partnerships. Market penetration is steadily increasing, particularly in developed economies where disposable income and access to advanced photography equipment are higher, with an estimated penetration rate of 25% among active photography enthusiasts in the base year of 2025. The influence of visual trends on platforms like Instagram and TikTok also plays a crucial role, driving demand for lenses that can create visually striking and shareable imagery. The market penetration for effect lenses is projected to reach 40% by 2030.
Dominant Markets & Segments in Special Effect Camera Lenses
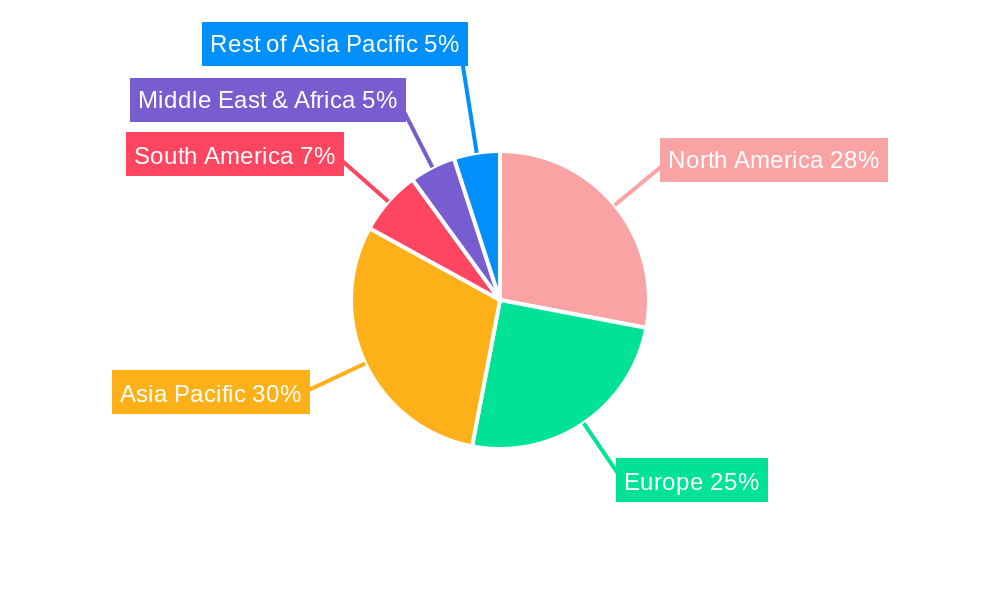
The Special Effect Camera Lenses market demonstrates clear regional and segmental dominance, driven by economic policies, infrastructure development, and consumer behavior. North America and Europe are the leading geographical markets, accounting for an estimated 35% and 30% of the global market share respectively in 2025. This dominance is attributed to a strong tradition of photography, high disposable incomes, and widespread access to advanced camera equipment. Within these regions, countries like the United States, Germany, and the United Kingdom exhibit the highest market penetration. The application segment of Photography Enthusiasts is currently the largest, representing approximately 55% of the market. This segment's growth is fueled by the desire for creative expression and the accessibility of effect lenses that can significantly alter visual output without requiring extensive post-processing skills. Economic policies supporting small businesses and creative industries indirectly benefit this segment by fostering a vibrant community of independent photographers and content creators. Infrastructure, particularly robust e-commerce platforms and photography communities online, further supports the accessibility and adoption of these lenses.
The Types segment of Tilt-shift Lenses is a significant driver of market growth, holding an estimated 30% market share within the effect lens category. These lenses are highly sought after for their ability to manipulate perspective and depth of field, creating popular miniature effects and selective focus. Their popularity is further bolstered by architectural photography and creative portraiture.
- Key Drivers for Dominance in North America & Europe:
- High disposable income and a well-established photography culture.
- Extensive online and physical retail infrastructure for camera equipment.
- Strong presence of photography education and workshops promoting creative techniques.
- Active social media communities showcasing unique photographic styles.
- Key Drivers for Dominance of Photography Enthusiasts:
- Growing interest in visual content creation for social media and personal portfolios.
- Desire for unique visual aesthetics and differentiation in photography.
- Increasing affordability of effect lenses compared to professional studio equipment.
- Educational resources and online tutorials demystifying the use of effect lenses.
- Key Drivers for Dominance of Tilt-shift Lenses:
- Unique artistic capabilities for perspective control and miniature effects.
- Versatility in architectural, landscape, and creative portrait photography.
- Growing adoption by hobbyists looking for sophisticated creative tools.
- Technological advancements in tilt-shift lens design making them more accessible.
The Macro Lenses segment is also a substantial contributor, accounting for approximately 25% of the market, driven by the increasing interest in detailed and intricate photography of nature, products, and textures. The Asia-Pacific region, particularly China and Japan, is emerging as a rapidly growing market, projected to witness a CAGR of 9.2% in the coming years due to a burgeoning middle class and a rapidly expanding digital content creation ecosystem.
Special Effect Camera Lenses Product Developments
Recent product developments in the Special Effect Camera Lenses market are characterized by an emphasis on enhanced optical quality and user-friendly creative control. Innovations focus on achieving more nuanced bokeh effects, advanced light-bending capabilities for unique flares, and the integration of modular systems for greater adaptability. Companies like Lensbaby continue to pioneer unique lens systems that allow for quick lens changes and aperture adjustments, providing photographers with on-the-fly creative flexibility. Samyang and Sigma are expanding their offerings with lenses that deliver distinct chromatic aberrations and distortion profiles, catering to specific aesthetic preferences. The development of more compact and lightweight designs also enhances portability and user experience. These advancements are driven by a desire to offer distinct visual signatures that go beyond the capabilities of standard lenses, providing a competitive advantage in a market that values originality and artistic expression. The estimated value of R&D investment in new product development is projected to be in the range of $50 million annually for leading players.
Report Scope & Segmentation Analysis
This report provides a comprehensive analysis of the Special Effect Camera Lenses market, segmented by application and lens type. The Application segments include Photography Experts (estimated market share 20% in 2025), Photography Enthusiasts (estimated market share 55% in 2025), and Others (including commercial studios, educational institutions, and emerging creative fields, estimated market share 25% in 2025). The Types segments include Tilt-shift Lenses (estimated market share 30% in 2025), Macro Lenses (estimated market share 25% in 2025), and Others (encompassing fisheye, anamorphic, kaleidoscope, and creative effect lenses, estimated market share 45% in 2025). Growth projections indicate that the Photography Enthusiasts segment will continue to lead, driven by increasing content creation, while the "Others" type segment, particularly creative effect lenses, is expected to show the highest CAGR.
Key Drivers of Special Effect Camera Lenses Growth
The growth of the Special Effect Camera Lenses market is propelled by several key factors. Firstly, the burgeoning content creation industry, driven by social media platforms and the demand for visually compelling imagery, is a significant catalyst. Secondly, technological advancements in optical design and manufacturing are enabling the creation of more sophisticated and accessible effect lenses. Thirdly, the increasing accessibility of advanced camera bodies and the rising disposable income of photography enthusiasts in emerging economies contribute to market expansion. For instance, the growing popularity of vlogging and visual storytelling on platforms like YouTube and TikTok necessitates unique visual styles, which effect lenses can provide. Government initiatives supporting the creative industries and digital infrastructure development in various regions also play a supportive role.
Challenges in the Special Effect Camera Lenses Sector
Despite robust growth, the Special Effect Camera Lenses sector faces several challenges. Regulatory hurdles, while not significant, can arise concerning product certifications and environmental compliance for manufacturing processes. Supply chain disruptions, as evidenced by global events, can impact the availability and cost of raw materials and components, affecting production timelines and pricing. Intense competitive pressure from both established brands and new entrants necessitates continuous innovation and marketing efforts to maintain market share. Furthermore, the increasing capabilities of advanced image editing software present an indirect challenge, offering alternatives for achieving certain visual effects digitally, although they lack the tactile and in-camera creative control of specialized lenses. The estimated impact of supply chain issues on production costs can be as high as 15%.
Emerging Opportunities in Special Effect Camera Lenses
Emerging opportunities in the Special Effect Camera Lenses market lie in the expansion into new geographical regions, particularly in the Asia-Pacific and Latin American markets, where a growing middle class and increasing interest in photography are evident. Technological advancements in lens manufacturing, such as the use of AI in optical design and the development of smart lenses with integrated digital effects, present significant potential. The increasing demand for unique visual aesthetics in short-form video content and virtual reality applications also opens new avenues for specialized lens development. Furthermore, the growing trend of sustainable photography and the demand for eco-friendly lens materials and manufacturing processes offer a niche opportunity for differentiation.
Leading Players in the Special Effect Camera Lenses Market
- Lensbaby
- Lomography
- Holga
- Lensless
- SLR Magic
- Thingyfy
- Sigma
- Canon
- Tokina
- Nikon
- Sony
- Zeiss
- Olympus
- Tamron
- Ricoh
- Fujifilm
- Samyang
- Panasonic
Key Developments in Special Effect Camera Lenses Industry
- 2023 Q4: Lomography launches the LomoGraflok 120 back for large format cameras, expanding creative possibilities for analogue photographers.
- 2024 Q1: Lensbaby introduces the "Composer Pro II" with new mounting options for mirrorless cameras, enhancing its modular lens system.
- 2024 Q2: Sigma releases a new Art series lens with unique bokeh characteristics, catering to professional portrait photographers.
- 2024 Q3: Samyang expands its "Cine Lens" lineup with an anamorphic lens designed for low-light performance.
- 2025 Q1: Industry speculation suggests potential M&A activity involving a specialty effect lens manufacturer and a larger camera brand, with estimated deal values around $80 million.
- 2025 Q2: SLR Magic announces a new line of vintage-inspired lenses with modern optical coatings for enhanced image quality.
Strategic Outlook for Special Effect Camera Lenses Market
The strategic outlook for the Special Effect Camera Lenses market remains highly positive, driven by continuous innovation and evolving consumer demand for unique visual expressions. The market is poised for sustained growth, fueled by the increasing popularity of content creation and the desire among photographers to stand out. Key growth catalysts include the development of more versatile and adaptive lens systems, the expansion into underserved emerging markets, and the integration of digital technologies to enhance creative control. Strategic partnerships between lens manufacturers and camera companies, along with a focus on direct-to-consumer channels, will be crucial for market penetration. The market's ability to cater to both professional needs and enthusiast desires ensures its long-term viability and potential for significant expansion, with projected market growth of over 50% by 2033.
Special Effect Camera Lenses Segmentation
-
1. Application
- 1.1. Photography Experts
- 1.2. Photography Enthusiasts
- 1.3. Others
-
2. Types
- 2.1. Tilt-shift Lenses
- 2.2. Macro Lenses
- 2.3. Others
Special Effect Camera Lenses Segmentation By Geography
-
1. North America
- 1.1. United States
- 1.2. Canada
- 1.3. Mexico
-
2. South America
- 2.1. Brazil
- 2.2. Argentina
- 2.3. Rest of South America
-
3. Europe
- 3.1. United Kingdom
- 3.2. Germany
- 3.3. France
- 3.4. Italy
- 3.5. Spain
- 3.6. Russia
- 3.7. Benelux
- 3.8. Nordics
- 3.9. Rest of Europe
-
4. Middle East & Africa
- 4.1. Turkey
- 4.2. Israel
- 4.3. GCC
- 4.4. North Africa
- 4.5. South Africa
- 4.6. Rest of Middle East & Africa
-
5. Asia Pacific
- 5.1. China
- 5.2. India
- 5.3. Japan
- 5.4. South Korea
- 5.5. ASEAN
- 5.6. Oceania
- 5.7. Rest of Asia Pacific
Special Effect Camera Lenses REPORT HIGHLIGHTS
| Aspects | Details |
|---|---|
| Study Period | 2019-2033 |
| Base Year | 2024 |
| Estimated Year | 2025 |
| Forecast Period | 2025-2033 |
| Historical Period | 2019-2024 |
| Growth Rate | CAGR of XX% from 2019-2033 |
| Segmentation |
|
Table of Contents
- 1. Introduction
- 1.1. Research Scope
- 1.2. Market Segmentation
- 1.3. Research Methodology
- 1.4. Definitions and Assumptions
- 2. Executive Summary
- 2.1. Introduction
- 3. Market Dynamics
- 3.1. Introduction
- 3.2. Market Drivers
- 3.3. Market Restrains
- 3.4. Market Trends
- 4. Market Factor Analysis
- 4.1. Porters Five Forces
- 4.2. Supply/Value Chain
- 4.3. PESTEL analysis
- 4.4. Market Entropy
- 4.5. Patent/Trademark Analysis
- 5. Global Special Effect Camera Lenses Analysis, Insights and Forecast, 2019-2031
- 5.1. Market Analysis, Insights and Forecast - by Application
- 5.1.1. Photography Experts
- 5.1.2. Photography Enthusiasts
- 5.1.3. Others
- 5.2. Market Analysis, Insights and Forecast - by Types
- 5.2.1. Tilt-shift Lenses
- 5.2.2. Macro Lenses
- 5.2.3. Others
- 5.3. Market Analysis, Insights and Forecast - by Region
- 5.3.1. North America
- 5.3.2. South America
- 5.3.3. Europe
- 5.3.4. Middle East & Africa
- 5.3.5. Asia Pacific
- 5.1. Market Analysis, Insights and Forecast - by Application
- 6. North America Special Effect Camera Lenses Analysis, Insights and Forecast, 2019-2031
- 6.1. Market Analysis, Insights and Forecast - by Application
- 6.1.1. Photography Experts
- 6.1.2. Photography Enthusiasts
- 6.1.3. Others
- 6.2. Market Analysis, Insights and Forecast - by Types
- 6.2.1. Tilt-shift Lenses
- 6.2.2. Macro Lenses
- 6.2.3. Others
- 6.1. Market Analysis, Insights and Forecast - by Application
- 7. South America Special Effect Camera Lenses Analysis, Insights and Forecast, 2019-2031
- 7.1. Market Analysis, Insights and Forecast - by Application
- 7.1.1. Photography Experts
- 7.1.2. Photography Enthusiasts
- 7.1.3. Others
- 7.2. Market Analysis, Insights and Forecast - by Types
- 7.2.1. Tilt-shift Lenses
- 7.2.2. Macro Lenses
- 7.2.3. Others
- 7.1. Market Analysis, Insights and Forecast - by Application
- 8. Europe Special Effect Camera Lenses Analysis, Insights and Forecast, 2019-2031
- 8.1. Market Analysis, Insights and Forecast - by Application
- 8.1.1. Photography Experts
- 8.1.2. Photography Enthusiasts
- 8.1.3. Others
- 8.2. Market Analysis, Insights and Forecast - by Types
- 8.2.1. Tilt-shift Lenses
- 8.2.2. Macro Lenses
- 8.2.3. Others
- 8.1. Market Analysis, Insights and Forecast - by Application
- 9. Middle East & Africa Special Effect Camera Lenses Analysis, Insights and Forecast, 2019-2031
- 9.1. Market Analysis, Insights and Forecast - by Application
- 9.1.1. Photography Experts
- 9.1.2. Photography Enthusiasts
- 9.1.3. Others
- 9.2. Market Analysis, Insights and Forecast - by Types
- 9.2.1. Tilt-shift Lenses
- 9.2.2. Macro Lenses
- 9.2.3. Others
- 9.1. Market Analysis, Insights and Forecast - by Application
- 10. Asia Pacific Special Effect Camera Lenses Analysis, Insights and Forecast, 2019-2031
- 10.1. Market Analysis, Insights and Forecast - by Application
- 10.1.1. Photography Experts
- 10.1.2. Photography Enthusiasts
- 10.1.3. Others
- 10.2. Market Analysis, Insights and Forecast - by Types
- 10.2.1. Tilt-shift Lenses
- 10.2.2. Macro Lenses
- 10.2.3. Others
- 10.1. Market Analysis, Insights and Forecast - by Application
- 11. Competitive Analysis
- 11.1. Global Market Share Analysis 2024
- 11.2. Company Profiles
- 11.2.1 Lensbaby
- 11.2.1.1. Overview
- 11.2.1.2. Products
- 11.2.1.3. SWOT Analysis
- 11.2.1.4. Recent Developments
- 11.2.1.5. Financials (Based on Availability)
- 11.2.2 Lomography
- 11.2.2.1. Overview
- 11.2.2.2. Products
- 11.2.2.3. SWOT Analysis
- 11.2.2.4. Recent Developments
- 11.2.2.5. Financials (Based on Availability)
- 11.2.3 Holga
- 11.2.3.1. Overview
- 11.2.3.2. Products
- 11.2.3.3. SWOT Analysis
- 11.2.3.4. Recent Developments
- 11.2.3.5. Financials (Based on Availability)
- 11.2.4 Lensless
- 11.2.4.1. Overview
- 11.2.4.2. Products
- 11.2.4.3. SWOT Analysis
- 11.2.4.4. Recent Developments
- 11.2.4.5. Financials (Based on Availability)
- 11.2.5 SLR Magic
- 11.2.5.1. Overview
- 11.2.5.2. Products
- 11.2.5.3. SWOT Analysis
- 11.2.5.4. Recent Developments
- 11.2.5.5. Financials (Based on Availability)
- 11.2.6 Thingyfy
- 11.2.6.1. Overview
- 11.2.6.2. Products
- 11.2.6.3. SWOT Analysis
- 11.2.6.4. Recent Developments
- 11.2.6.5. Financials (Based on Availability)
- 11.2.7 Sigma
- 11.2.7.1. Overview
- 11.2.7.2. Products
- 11.2.7.3. SWOT Analysis
- 11.2.7.4. Recent Developments
- 11.2.7.5. Financials (Based on Availability)
- 11.2.8 Canon
- 11.2.8.1. Overview
- 11.2.8.2. Products
- 11.2.8.3. SWOT Analysis
- 11.2.8.4. Recent Developments
- 11.2.8.5. Financials (Based on Availability)
- 11.2.9 Tokina
- 11.2.9.1. Overview
- 11.2.9.2. Products
- 11.2.9.3. SWOT Analysis
- 11.2.9.4. Recent Developments
- 11.2.9.5. Financials (Based on Availability)
- 11.2.10 Nikon
- 11.2.10.1. Overview
- 11.2.10.2. Products
- 11.2.10.3. SWOT Analysis
- 11.2.10.4. Recent Developments
- 11.2.10.5. Financials (Based on Availability)
- 11.2.11 Sony
- 11.2.11.1. Overview
- 11.2.11.2. Products
- 11.2.11.3. SWOT Analysis
- 11.2.11.4. Recent Developments
- 11.2.11.5. Financials (Based on Availability)
- 11.2.12 Zeiss
- 11.2.12.1. Overview
- 11.2.12.2. Products
- 11.2.12.3. SWOT Analysis
- 11.2.12.4. Recent Developments
- 11.2.12.5. Financials (Based on Availability)
- 11.2.13 Olympus
- 11.2.13.1. Overview
- 11.2.13.2. Products
- 11.2.13.3. SWOT Analysis
- 11.2.13.4. Recent Developments
- 11.2.13.5. Financials (Based on Availability)
- 11.2.14 Tamron
- 11.2.14.1. Overview
- 11.2.14.2. Products
- 11.2.14.3. SWOT Analysis
- 11.2.14.4. Recent Developments
- 11.2.14.5. Financials (Based on Availability)
- 11.2.15 Ricoh
- 11.2.15.1. Overview
- 11.2.15.2. Products
- 11.2.15.3. SWOT Analysis
- 11.2.15.4. Recent Developments
- 11.2.15.5. Financials (Based on Availability)
- 11.2.16 Fujifilm
- 11.2.16.1. Overview
- 11.2.16.2. Products
- 11.2.16.3. SWOT Analysis
- 11.2.16.4. Recent Developments
- 11.2.16.5. Financials (Based on Availability)
- 11.2.17 Samyang
- 11.2.17.1. Overview
- 11.2.17.2. Products
- 11.2.17.3. SWOT Analysis
- 11.2.17.4. Recent Developments
- 11.2.17.5. Financials (Based on Availability)
- 11.2.18 Panasonic
- 11.2.18.1. Overview
- 11.2.18.2. Products
- 11.2.18.3. SWOT Analysis
- 11.2.18.4. Recent Developments
- 11.2.18.5. Financials (Based on Availability)
- 11.2.1 Lensbaby
List of Figures
- Figure 1: Global Special Effect Camera Lenses Revenue Breakdown (million, %) by Region 2024 & 2032
- Figure 2: Global Special Effect Camera Lenses Volume Breakdown (K, %) by Region 2024 & 2032
- Figure 3: North America Special Effect Camera Lenses Revenue (million), by Application 2024 & 2032
- Figure 4: North America Special Effect Camera Lenses Volume (K), by Application 2024 & 2032
- Figure 5: North America Special Effect Camera Lenses Revenue Share (%), by Application 2024 & 2032
- Figure 6: North America Special Effect Camera Lenses Volume Share (%), by Application 2024 & 2032
- Figure 7: North America Special Effect Camera Lenses Revenue (million), by Types 2024 & 2032
- Figure 8: North America Special Effect Camera Lenses Volume (K), by Types 2024 & 2032
- Figure 9: North America Special Effect Camera Lenses Revenue Share (%), by Types 2024 & 2032
- Figure 10: North America Special Effect Camera Lenses Volume Share (%), by Types 2024 & 2032
- Figure 11: North America Special Effect Camera Lenses Revenue (million), by Country 2024 & 2032
- Figure 12: North America Special Effect Camera Lenses Volume (K), by Country 2024 & 2032
- Figure 13: North America Special Effect Camera Lenses Revenue Share (%), by Country 2024 & 2032
- Figure 14: North America Special Effect Camera Lenses Volume Share (%), by Country 2024 & 2032
- Figure 15: South America Special Effect Camera Lenses Revenue (million), by Application 2024 & 2032
- Figure 16: South America Special Effect Camera Lenses Volume (K), by Application 2024 & 2032
- Figure 17: South America Special Effect Camera Lenses Revenue Share (%), by Application 2024 & 2032
- Figure 18: South America Special Effect Camera Lenses Volume Share (%), by Application 2024 & 2032
- Figure 19: South America Special Effect Camera Lenses Revenue (million), by Types 2024 & 2032
- Figure 20: South America Special Effect Camera Lenses Volume (K), by Types 2024 & 2032
- Figure 21: South America Special Effect Camera Lenses Revenue Share (%), by Types 2024 & 2032
- Figure 22: South America Special Effect Camera Lenses Volume Share (%), by Types 2024 & 2032
- Figure 23: South America Special Effect Camera Lenses Revenue (million), by Country 2024 & 2032
- Figure 24: South America Special Effect Camera Lenses Volume (K), by Country 2024 & 2032
- Figure 25: South America Special Effect Camera Lenses Revenue Share (%), by Country 2024 & 2032
- Figure 26: South America Special Effect Camera Lenses Volume Share (%), by Country 2024 & 2032
- Figure 27: Europe Special Effect Camera Lenses Revenue (million), by Application 2024 & 2032
- Figure 28: Europe Special Effect Camera Lenses Volume (K), by Application 2024 & 2032
- Figure 29: Europe Special Effect Camera Lenses Revenue Share (%), by Application 2024 & 2032
- Figure 30: Europe Special Effect Camera Lenses Volume Share (%), by Application 2024 & 2032
- Figure 31: Europe Special Effect Camera Lenses Revenue (million), by Types 2024 & 2032
- Figure 32: Europe Special Effect Camera Lenses Volume (K), by Types 2024 & 2032
- Figure 33: Europe Special Effect Camera Lenses Revenue Share (%), by Types 2024 & 2032
- Figure 34: Europe Special Effect Camera Lenses Volume Share (%), by Types 2024 & 2032
- Figure 35: Europe Special Effect Camera Lenses Revenue (million), by Country 2024 & 2032
- Figure 36: Europe Special Effect Camera Lenses Volume (K), by Country 2024 & 2032
- Figure 37: Europe Special Effect Camera Lenses Revenue Share (%), by Country 2024 & 2032
- Figure 38: Europe Special Effect Camera Lenses Volume Share (%), by Country 2024 & 2032
- Figure 39: Middle East & Africa Special Effect Camera Lenses Revenue (million), by Application 2024 & 2032
- Figure 40: Middle East & Africa Special Effect Camera Lenses Volume (K), by Application 2024 & 2032
- Figure 41: Middle East & Africa Special Effect Camera Lenses Revenue Share (%), by Application 2024 & 2032
- Figure 42: Middle East & Africa Special Effect Camera Lenses Volume Share (%), by Application 2024 & 2032
- Figure 43: Middle East & Africa Special Effect Camera Lenses Revenue (million), by Types 2024 & 2032
- Figure 44: Middle East & Africa Special Effect Camera Lenses Volume (K), by Types 2024 & 2032
- Figure 45: Middle East & Africa Special Effect Camera Lenses Revenue Share (%), by Types 2024 & 2032
- Figure 46: Middle East & Africa Special Effect Camera Lenses Volume Share (%), by Types 2024 & 2032
- Figure 47: Middle East & Africa Special Effect Camera Lenses Revenue (million), by Country 2024 & 2032
- Figure 48: Middle East & Africa Special Effect Camera Lenses Volume (K), by Country 2024 & 2032
- Figure 49: Middle East & Africa Special Effect Camera Lenses Revenue Share (%), by Country 2024 & 2032
- Figure 50: Middle East & Africa Special Effect Camera Lenses Volume Share (%), by Country 2024 & 2032
- Figure 51: Asia Pacific Special Effect Camera Lenses Revenue (million), by Application 2024 & 2032
- Figure 52: Asia Pacific Special Effect Camera Lenses Volume (K), by Application 2024 & 2032
- Figure 53: Asia Pacific Special Effect Camera Lenses Revenue Share (%), by Application 2024 & 2032
- Figure 54: Asia Pacific Special Effect Camera Lenses Volume Share (%), by Application 2024 & 2032
- Figure 55: Asia Pacific Special Effect Camera Lenses Revenue (million), by Types 2024 & 2032
- Figure 56: Asia Pacific Special Effect Camera Lenses Volume (K), by Types 2024 & 2032
- Figure 57: Asia Pacific Special Effect Camera Lenses Revenue Share (%), by Types 2024 & 2032
- Figure 58: Asia Pacific Special Effect Camera Lenses Volume Share (%), by Types 2024 & 2032
- Figure 59: Asia Pacific Special Effect Camera Lenses Revenue (million), by Country 2024 & 2032
- Figure 60: Asia Pacific Special Effect Camera Lenses Volume (K), by Country 2024 & 2032
- Figure 61: Asia Pacific Special Effect Camera Lenses Revenue Share (%), by Country 2024 & 2032
- Figure 62: Asia Pacific Special Effect Camera Lenses Volume Share (%), by Country 2024 & 2032
List of Tables
- Table 1: Global Special Effect Camera Lenses Revenue million Forecast, by Region 2019 & 2032
- Table 2: Global Special Effect Camera Lenses Volume K Forecast, by Region 2019 & 2032
- Table 3: Global Special Effect Camera Lenses Revenue million Forecast, by Application 2019 & 2032
- Table 4: Global Special Effect Camera Lenses Volume K Forecast, by Application 2019 & 2032
- Table 5: Global Special Effect Camera Lenses Revenue million Forecast, by Types 2019 & 2032
- Table 6: Global Special Effect Camera Lenses Volume K Forecast, by Types 2019 & 2032
- Table 7: Global Special Effect Camera Lenses Revenue million Forecast, by Region 2019 & 2032
- Table 8: Global Special Effect Camera Lenses Volume K Forecast, by Region 2019 & 2032
- Table 9: Global Special Effect Camera Lenses Revenue million Forecast, by Application 2019 & 2032
- Table 10: Global Special Effect Camera Lenses Volume K Forecast, by Application 2019 & 2032
- Table 11: Global Special Effect Camera Lenses Revenue million Forecast, by Types 2019 & 2032
- Table 12: Global Special Effect Camera Lenses Volume K Forecast, by Types 2019 & 2032
- Table 13: Global Special Effect Camera Lenses Revenue million Forecast, by Country 2019 & 2032
- Table 14: Global Special Effect Camera Lenses Volume K Forecast, by Country 2019 & 2032
- Table 15: United States Special Effect Camera Lenses Revenue (million) Forecast, by Application 2019 & 2032
- Table 16: United States Special Effect Camera Lenses Volume (K) Forecast, by Application 2019 & 2032
- Table 17: Canada Special Effect Camera Lenses Revenue (million) Forecast, by Application 2019 & 2032
- Table 18: Canada Special Effect Camera Lenses Volume (K) Forecast, by Application 2019 & 2032
- Table 19: Mexico Special Effect Camera Lenses Revenue (million) Forecast, by Application 2019 & 2032
- Table 20: Mexico Special Effect Camera Lenses Volume (K) Forecast, by Application 2019 & 2032
- Table 21: Global Special Effect Camera Lenses Revenue million Forecast, by Application 2019 & 2032
- Table 22: Global Special Effect Camera Lenses Volume K Forecast, by Application 2019 & 2032
- Table 23: Global Special Effect Camera Lenses Revenue million Forecast, by Types 2019 & 2032
- Table 24: Global Special Effect Camera Lenses Volume K Forecast, by Types 2019 & 2032
- Table 25: Global Special Effect Camera Lenses Revenue million Forecast, by Country 2019 & 2032
- Table 26: Global Special Effect Camera Lenses Volume K Forecast, by Country 2019 & 2032
- Table 27: Brazil Special Effect Camera Lenses Revenue (million) Forecast, by Application 2019 & 2032
- Table 28: Brazil Special Effect Camera Lenses Volume (K) Forecast, by Application 2019 & 2032
- Table 29: Argentina Special Effect Camera Lenses Revenue (million) Forecast, by Application 2019 & 2032
- Table 30: Argentina Special Effect Camera Lenses Volume (K) Forecast, by Application 2019 & 2032
- Table 31: Rest of South America Special Effect Camera Lenses Revenue (million) Forecast, by Application 2019 & 2032
- Table 32: Rest of South America Special Effect Camera Lenses Volume (K) Forecast, by Application 2019 & 2032
- Table 33: Global Special Effect Camera Lenses Revenue million Forecast, by Application 2019 & 2032
- Table 34: Global Special Effect Camera Lenses Volume K Forecast, by Application 2019 & 2032
- Table 35: Global Special Effect Camera Lenses Revenue million Forecast, by Types 2019 & 2032
- Table 36: Global Special Effect Camera Lenses Volume K Forecast, by Types 2019 & 2032
- Table 37: Global Special Effect Camera Lenses Revenue million Forecast, by Country 2019 & 2032
- Table 38: Global Special Effect Camera Lenses Volume K Forecast, by Country 2019 & 2032
- Table 39: United Kingdom Special Effect Camera Lenses Revenue (million) Forecast, by Application 2019 & 2032
- Table 40: United Kingdom Special Effect Camera Lenses Volume (K) Forecast, by Application 2019 & 2032
- Table 41: Germany Special Effect Camera Lenses Revenue (million) Forecast, by Application 2019 & 2032
- Table 42: Germany Special Effect Camera Lenses Volume (K) Forecast, by Application 2019 & 2032
- Table 43: France Special Effect Camera Lenses Revenue (million) Forecast, by Application 2019 & 2032
- Table 44: France Special Effect Camera Lenses Volume (K) Forecast, by Application 2019 & 2032
- Table 45: Italy Special Effect Camera Lenses Revenue (million) Forecast, by Application 2019 & 2032
- Table 46: Italy Special Effect Camera Lenses Volume (K) Forecast, by Application 2019 & 2032
- Table 47: Spain Special Effect Camera Lenses Revenue (million) Forecast, by Application 2019 & 2032
- Table 48: Spain Special Effect Camera Lenses Volume (K) Forecast, by Application 2019 & 2032
- Table 49: Russia Special Effect Camera Lenses Revenue (million) Forecast, by Application 2019 & 2032
- Table 50: Russia Special Effect Camera Lenses Volume (K) Forecast, by Application 2019 & 2032
- Table 51: Benelux Special Effect Camera Lenses Revenue (million) Forecast, by Application 2019 & 2032
- Table 52: Benelux Special Effect Camera Lenses Volume (K) Forecast, by Application 2019 & 2032
- Table 53: Nordics Special Effect Camera Lenses Revenue (million) Forecast, by Application 2019 & 2032
- Table 54: Nordics Special Effect Camera Lenses Volume (K) Forecast, by Application 2019 & 2032
- Table 55: Rest of Europe Special Effect Camera Lenses Revenue (million) Forecast, by Application 2019 & 2032
- Table 56: Rest of Europe Special Effect Camera Lenses Volume (K) Forecast, by Application 2019 & 2032
- Table 57: Global Special Effect Camera Lenses Revenue million Forecast, by Application 2019 & 2032
- Table 58: Global Special Effect Camera Lenses Volume K Forecast, by Application 2019 & 2032
- Table 59: Global Special Effect Camera Lenses Revenue million Forecast, by Types 2019 & 2032
- Table 60: Global Special Effect Camera Lenses Volume K Forecast, by Types 2019 & 2032
- Table 61: Global Special Effect Camera Lenses Revenue million Forecast, by Country 2019 & 2032
- Table 62: Global Special Effect Camera Lenses Volume K Forecast, by Country 2019 & 2032
- Table 63: Turkey Special Effect Camera Lenses Revenue (million) Forecast, by Application 2019 & 2032
- Table 64: Turkey Special Effect Camera Lenses Volume (K) Forecast, by Application 2019 & 2032
- Table 65: Israel Special Effect Camera Lenses Revenue (million) Forecast, by Application 2019 & 2032
- Table 66: Israel Special Effect Camera Lenses Volume (K) Forecast, by Application 2019 & 2032
- Table 67: GCC Special Effect Camera Lenses Revenue (million) Forecast, by Application 2019 & 2032
- Table 68: GCC Special Effect Camera Lenses Volume (K) Forecast, by Application 2019 & 2032
- Table 69: North Africa Special Effect Camera Lenses Revenue (million) Forecast, by Application 2019 & 2032
- Table 70: North Africa Special Effect Camera Lenses Volume (K) Forecast, by Application 2019 & 2032
- Table 71: South Africa Special Effect Camera Lenses Revenue (million) Forecast, by Application 2019 & 2032
- Table 72: South Africa Special Effect Camera Lenses Volume (K) Forecast, by Application 2019 & 2032
- Table 73: Rest of Middle East & Africa Special Effect Camera Lenses Revenue (million) Forecast, by Application 2019 & 2032
- Table 74: Rest of Middle East & Africa Special Effect Camera Lenses Volume (K) Forecast, by Application 2019 & 2032
- Table 75: Global Special Effect Camera Lenses Revenue million Forecast, by Application 2019 & 2032
- Table 76: Global Special Effect Camera Lenses Volume K Forecast, by Application 2019 & 2032
- Table 77: Global Special Effect Camera Lenses Revenue million Forecast, by Types 2019 & 2032
- Table 78: Global Special Effect Camera Lenses Volume K Forecast, by Types 2019 & 2032
- Table 79: Global Special Effect Camera Lenses Revenue million Forecast, by Country 2019 & 2032
- Table 80: Global Special Effect Camera Lenses Volume K Forecast, by Country 2019 & 2032
- Table 81: China Special Effect Camera Lenses Revenue (million) Forecast, by Application 2019 & 2032
- Table 82: China Special Effect Camera Lenses Volume (K) Forecast, by Application 2019 & 2032
- Table 83: India Special Effect Camera Lenses Revenue (million) Forecast, by Application 2019 & 2032
- Table 84: India Special Effect Camera Lenses Volume (K) Forecast, by Application 2019 & 2032
- Table 85: Japan Special Effect Camera Lenses Revenue (million) Forecast, by Application 2019 & 2032
- Table 86: Japan Special Effect Camera Lenses Volume (K) Forecast, by Application 2019 & 2032
- Table 87: South Korea Special Effect Camera Lenses Revenue (million) Forecast, by Application 2019 & 2032
- Table 88: South Korea Special Effect Camera Lenses Volume (K) Forecast, by Application 2019 & 2032
- Table 89: ASEAN Special Effect Camera Lenses Revenue (million) Forecast, by Application 2019 & 2032
- Table 90: ASEAN Special Effect Camera Lenses Volume (K) Forecast, by Application 2019 & 2032
- Table 91: Oceania Special Effect Camera Lenses Revenue (million) Forecast, by Application 2019 & 2032
- Table 92: Oceania Special Effect Camera Lenses Volume (K) Forecast, by Application 2019 & 2032
- Table 93: Rest of Asia Pacific Special Effect Camera Lenses Revenue (million) Forecast, by Application 2019 & 2032
- Table 94: Rest of Asia Pacific Special Effect Camera Lenses Volume (K) Forecast, by Application 2019 & 2032
Frequently Asked Questions
1. What is the projected Compound Annual Growth Rate (CAGR) of the Special Effect Camera Lenses?
The projected CAGR is approximately XX%.
2. Which companies are prominent players in the Special Effect Camera Lenses?
Key companies in the market include Lensbaby, Lomography, Holga, Lensless, SLR Magic, Thingyfy, Sigma, Canon, Tokina, Nikon, Sony, Zeiss, Olympus, Tamron, Ricoh, Fujifilm, Samyang, Panasonic.
3. What are the main segments of the Special Effect Camera Lenses?
The market segments include Application, Types.
4. Can you provide details about the market size?
The market size is estimated to be USD XXX million as of 2022.
5. What are some drivers contributing to market growth?
N/A
6. What are the notable trends driving market growth?
N/A
7. Are there any restraints impacting market growth?
N/A
8. Can you provide examples of recent developments in the market?
N/A
9. What pricing options are available for accessing the report?
Pricing options include single-user, multi-user, and enterprise licenses priced at USD 3950.00, USD 5925.00, and USD 7900.00 respectively.
10. Is the market size provided in terms of value or volume?
The market size is provided in terms of value, measured in million and volume, measured in K.
11. Are there any specific market keywords associated with the report?
Yes, the market keyword associated with the report is "Special Effect Camera Lenses," which aids in identifying and referencing the specific market segment covered.
12. How do I determine which pricing option suits my needs best?
The pricing options vary based on user requirements and access needs. Individual users may opt for single-user licenses, while businesses requiring broader access may choose multi-user or enterprise licenses for cost-effective access to the report.
13. Are there any additional resources or data provided in the Special Effect Camera Lenses report?
While the report offers comprehensive insights, it's advisable to review the specific contents or supplementary materials provided to ascertain if additional resources or data are available.
14. How can I stay updated on further developments or reports in the Special Effect Camera Lenses?
To stay informed about further developments, trends, and reports in the Special Effect Camera Lenses, consider subscribing to industry newsletters, following relevant companies and organizations, or regularly checking reputable industry news sources and publications.
Methodology
Step 1 - Identification of Relevant Samples Size from Population Database


Step 2 - Approaches for Defining Global Market Size (Value, Volume* & Price*)

Note*: In applicable scenarios
Step 3 - Data Sources
Primary Research
- Web Analytics
- Survey Reports
- Research Institute
- Latest Research Reports
- Opinion Leaders
Secondary Research
- Annual Reports
- White Paper
- Latest Press Release
- Industry Association
- Paid Database
- Investor Presentations

Step 4 - Data Triangulation
Involves using different sources of information in order to increase the validity of a study
These sources are likely to be stakeholders in a program - participants, other researchers, program staff, other community members, and so on.
Then we put all data in single framework & apply various statistical tools to find out the dynamic on the market.
During the analysis stage, feedback from the stakeholder groups would be compared to determine areas of agreement as well as areas of divergence


