

Key Insights
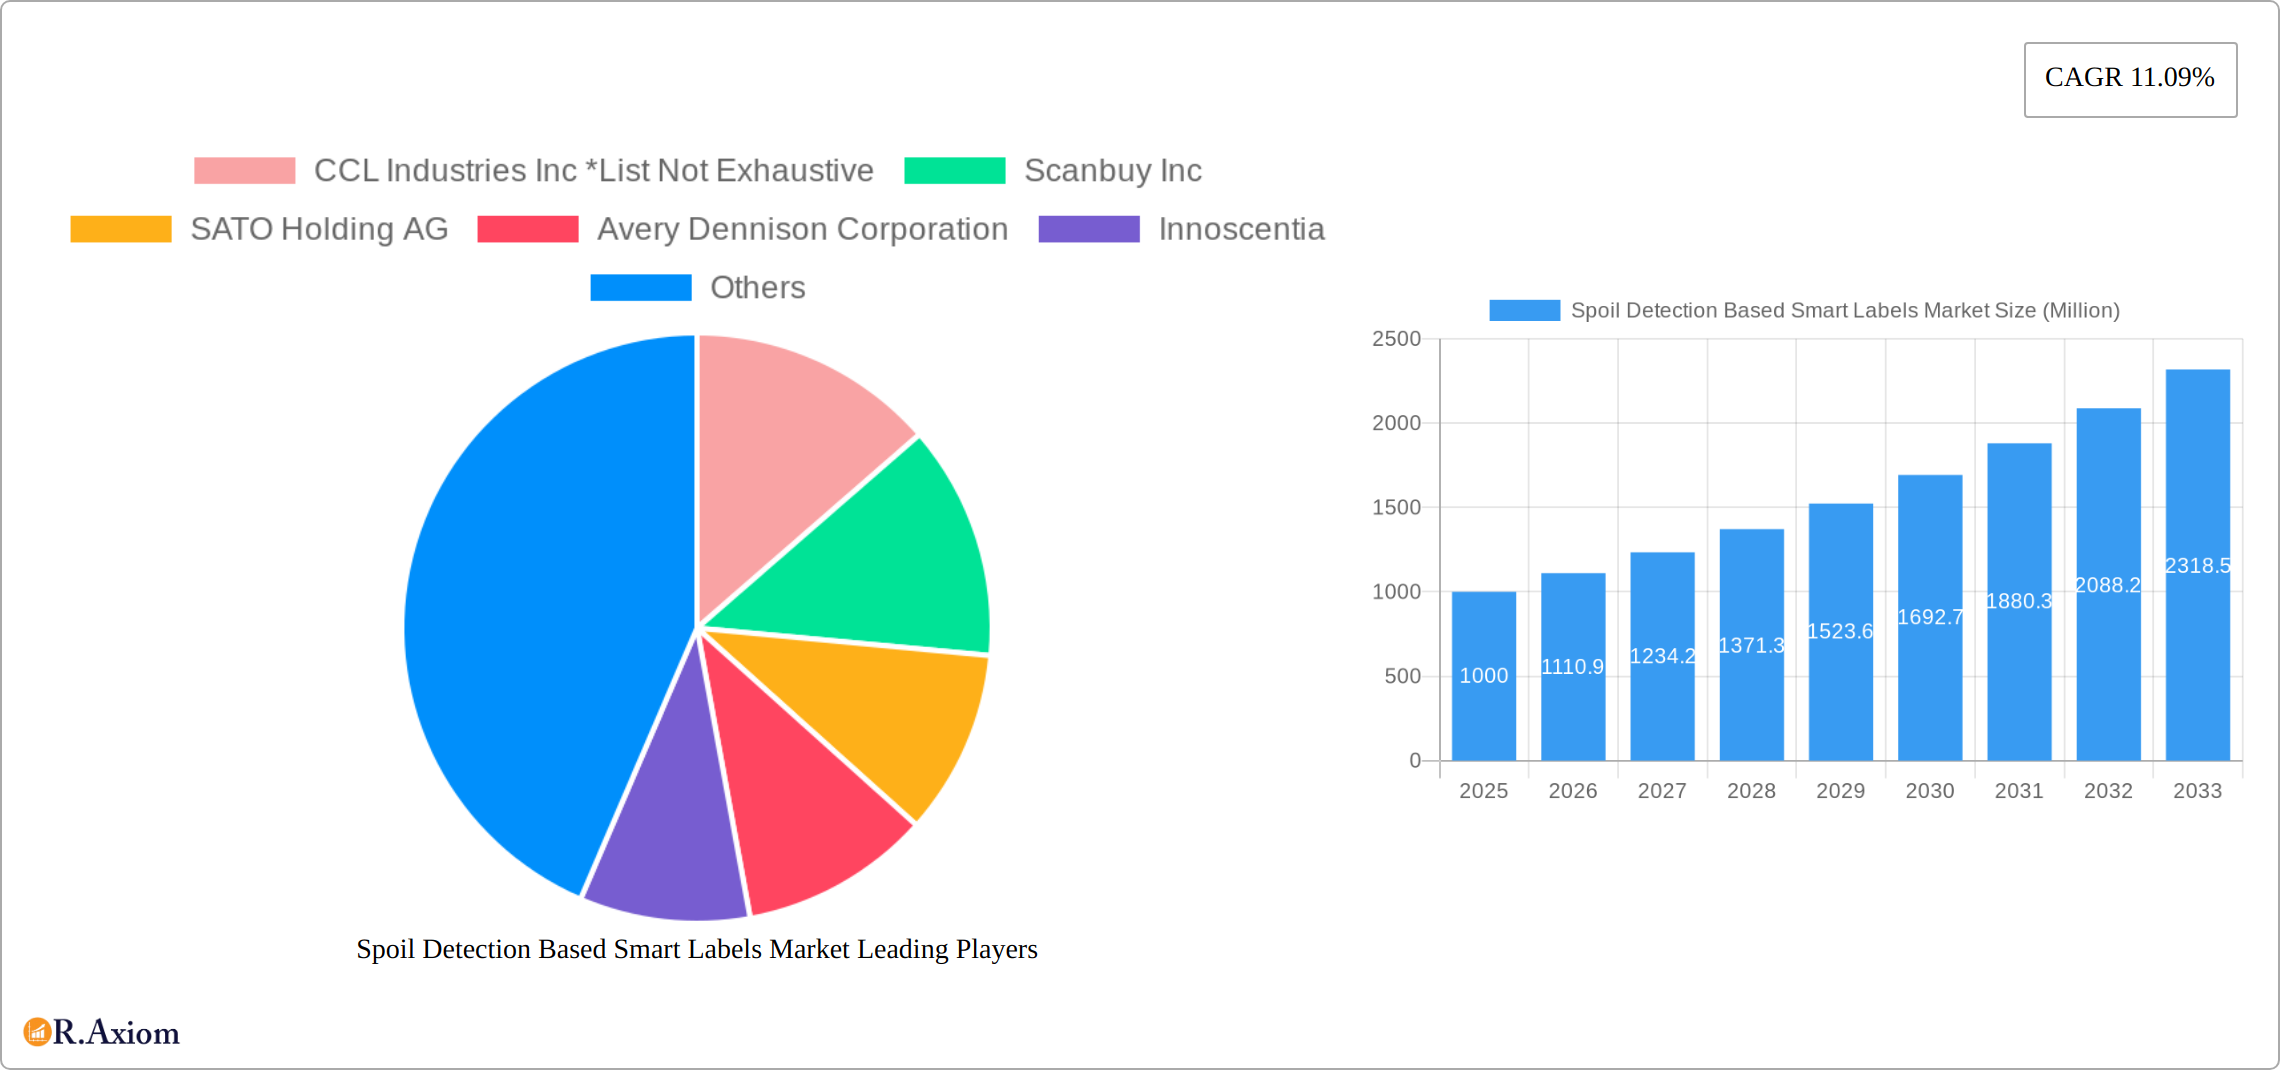
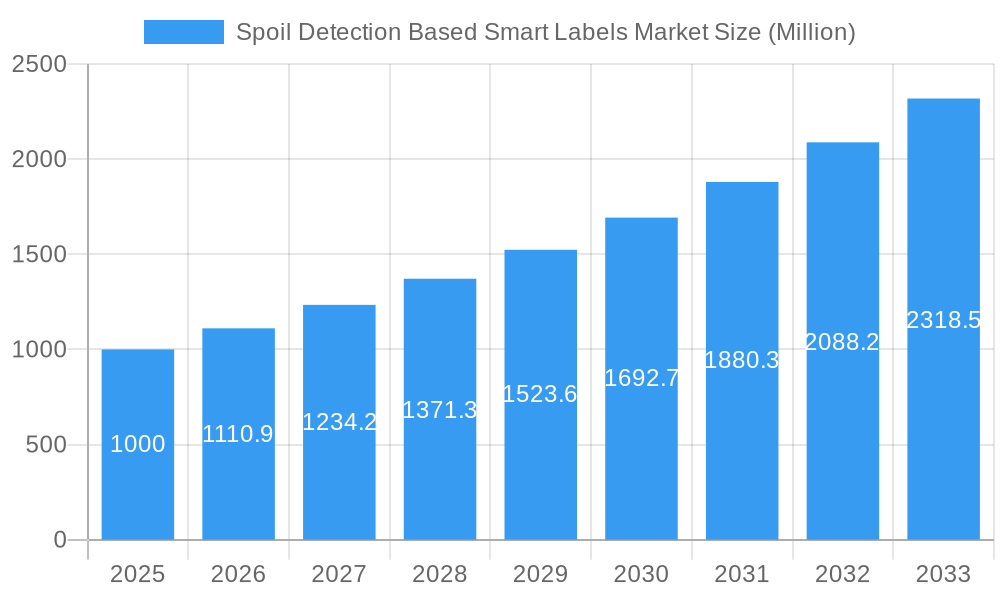
The Spoil Detection Based Smart Labels market is experiencing robust growth, projected to reach a market size of $1 billion in 2025 and exhibiting a Compound Annual Growth Rate (CAGR) of 11.09% from 2025 to 2033. This expansion is driven by several key factors. The increasing demand for efficient supply chain management across various sectors, particularly in pharmaceuticals, food and beverages, and logistics, necessitates improved product traceability and reduced waste due to spoilage. Consumer awareness regarding food safety and quality is also a significant driver, fueling the adoption of smart labels that provide real-time information on product freshness and potential spoilage. Technological advancements in RFID, NFC, and sensing label technologies are further enhancing the capabilities of these labels, making them more accurate, reliable, and cost-effective. The market is segmented by technology (RFID, sensing labels, NFC) and end-user industry (pharmaceuticals, food and beverage, logistics, cosmetics, and others). While specific market share data for each segment is not available, the pharmaceutical and food and beverage sectors are expected to dominate due to stringent regulatory requirements and the high cost of spoilage in these industries. The competitive landscape is dynamic, with key players such as CCL Industries Inc., Avery Dennison Corporation, and Zebra Technologies Corporation constantly innovating and expanding their product portfolios. The North American market currently holds a significant share, driven by high technological adoption and robust regulatory frameworks. However, the Asia-Pacific region is expected to witness substantial growth in the coming years, fueled by increasing disposable incomes and rising demand for better food safety standards.
Spoil Detection Based Smart Labels Market Market Size (In Billion)
The restraints on market growth primarily involve the relatively higher initial investment costs associated with implementing smart label technologies. However, the long-term benefits in terms of reduced waste, improved efficiency, and enhanced brand reputation are expected to outweigh these initial costs. Furthermore, challenges in integrating these technologies into existing supply chain infrastructure might present some short-term hurdles. Nevertheless, ongoing advancements in technology, coupled with increasing government support and industry collaboration, are paving the way for widespread adoption of spoil detection smart labels across various sectors. The forecast period (2025-2033) promises substantial growth potential, making it an attractive market for both established players and new entrants.
Spoil Detection Based Smart Labels Market Company Market Share
Spoil Detection Based Smart Labels Market: A Comprehensive Report (2019-2033)
This detailed report provides a comprehensive analysis of the Spoil Detection Based Smart Labels Market, offering actionable insights for industry stakeholders. With a study period spanning 2019-2033, a base year of 2025, and a forecast period of 2025-2033, this report delivers a thorough understanding of current market dynamics and future growth trajectories. The market is valued at xx Million in 2025 and is projected to reach xx Million by 2033, exhibiting a CAGR of xx%.
Spoil Detection Based Smart Labels Market Concentration & Innovation
The Spoil Detection Based Smart Labels Market is characterized by a moderately concentrated landscape, with key players like CCL Industries Inc, Scanbuy Inc, SATO Holding AG, Avery Dennison Corporation, Innoscentia, SpotSee, Insignia Technologies, Zebra Technologies Corporation, Evigence Sensors, and Ensurge Micropower ASA holding significant market share. However, the market also exhibits considerable innovation, driven by advancements in sensing technologies, miniaturization, and data analytics capabilities.
Market Concentration: The top 5 players account for approximately xx% of the market share in 2025, indicating a moderately concentrated market. This concentration is expected to shift slightly by 2033, with a predicted xx% market share for the top 5 players.
Innovation Drivers: The need for enhanced supply chain visibility, stringent regulatory requirements for perishable goods, and rising consumer demand for quality and safety are key drivers of innovation. This is reflected in the development of sophisticated sensing technologies, improved data communication protocols, and user-friendly interfaces.
Regulatory Frameworks: Stringent regulations concerning food safety and pharmaceutical product integrity are driving adoption of spoil detection smart labels. These regulations are expected to influence market growth positively in the coming years.
Product Substitutes: Traditional methods of spoil detection, such as visual inspection and temperature logging, are being gradually replaced by smart label solutions due to their enhanced accuracy and efficiency. However, cost remains a barrier for some segments.
End-User Trends: Growing awareness of food safety and quality, coupled with the increasing demand for traceability and transparency in supply chains, is pushing end-users towards adopting spoil detection smart labels.
M&A Activities: The market has witnessed a moderate level of M&A activity in recent years, with deal values averaging xx Million. Strategic acquisitions are likely to continue as larger players aim to expand their product portfolios and market reach.
Spoil Detection Based Smart Labels Market Industry Trends & Insights
The Spoil Detection Based Smart Labels Market is experiencing robust growth, driven by a confluence of factors. Significant advancements in sensing technologies, encompassing RFID, NFC, and advanced sensing labels, are enabling the development of more precise, dependable, and cost-effective spoilage detection solutions. This is further amplified by the escalating demand for real-time cold chain visibility, particularly within the pharmaceutical and food & beverage sectors, where maintaining product integrity is paramount. Consumer preferences are also shifting towards greater transparency and traceability, accelerating the adoption of these smart labels. The competitive landscape remains dynamic, with both established industry players and innovative newcomers vying for market dominance through strategic partnerships, mergers and acquisitions, and continuous product innovation. A notable trend is the market's movement towards more holistic and integrated solutions, combining sophisticated sensing capabilities, seamless data communication, and powerful data analytics to provide comprehensive insights.
The global market is projected to exhibit a robust Compound Annual Growth Rate (CAGR) of xx% throughout the forecast period, with substantial market penetration anticipated in developed regions. This market expansion is segmented based on the underlying technology utilized and the specific end-user industries served.
Dominant Markets & Segments in Spoil Detection Based Smart Labels Market
Leading Region: North America currently holds the largest market share due to strong regulatory frameworks, high consumer awareness, and the early adoption of advanced technologies. Europe follows closely, while Asia-Pacific is witnessing significant growth potential.
Dominant End-User Industry: The pharmaceutical industry is a key driver of market growth owing to the stringent quality control and cold chain requirements for temperature-sensitive drugs and vaccines. The Food & Beverage sector is another significant segment, followed by Logistics and Cosmetics.
Leading Technology: RFID technology holds a dominant market share due to its ability to provide detailed product tracking and identification information. However, other technologies, such as sensing labels and NFC, are gaining traction due to cost-effectiveness and ease of implementation.
Key Drivers for Dominance:
- North America: Stringent food safety regulations, well-established supply chains, and high technological adoption rates.
- Pharmaceutical Industry: Stringent regulatory requirements for maintaining cold chain integrity and ensuring product quality.
- RFID Technology: Superior tracking capabilities and established infrastructure for data management.
Spoil Detection Based Smart Labels Market Product Developments
Recent product innovations focus on enhancing accuracy, reducing cost, and improving user-friendliness. Miniaturization of sensors, integration of advanced data analytics, and the development of user-friendly interfaces are key trends. These developments are improving the market fit of spoil detection smart labels by addressing specific needs across various end-user industries. Competition is driving innovation, with companies striving to offer superior performance, cost-effectiveness, and ease of integration.
Report Scope & Segmentation Analysis
Technology: This report segments the market by technology, including RFID, Sensing Labels, and NFC. Each technology segment has its growth projections, market size, and competitive dynamics analyzed separately. For example, the RFID segment is expected to show strong growth due to its superior tracking capabilities.
End-User Industry: The market is also segmented by end-user industry, comprising Pharmaceuticals, Food and Beverage, Logistics, Cosmetics, and Other End-user Industries. Each segment presents unique opportunities and challenges, with growth projections tailored to industry-specific trends. For instance, the Pharmaceutical segment is projected to exhibit the highest growth due to strict regulatory compliance requirements.
Key Drivers of Spoil Detection Based Smart Labels Market Growth
- Technological Advancements: Miniaturization of sensors, leading to smaller and more adaptable labels; improved communication protocols for reliable data transmission; and the integration of advanced data analytics capabilities for actionable insights are key growth catalysts.
- Stringent Regulations and Compliance: The increasingly stringent regulations surrounding food safety and pharmaceutical product quality are compelling businesses to adopt smart label technologies to ensure compliance and mitigate risks.
- Supply Chain Optimization and Efficiency: The imperative for enhanced supply chain visibility and traceability is significantly driving the demand for real-time monitoring solutions offered by these smart labels, minimizing losses and improving operational efficiency.
- Evolving Consumer Demand for Transparency and Safety: Rising consumer awareness regarding food safety and product quality is directly translating into increased market demand for products incorporating these transparent and traceable smart labels.
Challenges in the Spoil Detection Based Smart Labels Market Sector
- High Initial Investment: The cost of implementing smart label solutions can be a barrier for some smaller businesses.
- Integration Complexity: Integrating smart labels into existing supply chains can be challenging and require significant investment in technology and infrastructure.
- Data Security Concerns: Concerns regarding data security and privacy related to the collection and transmission of product information can hinder adoption.
Emerging Opportunities in Spoil Detection Based Smart Labels Market
- Expansion into High-Growth Emerging Markets: Significant untapped potential exists in developing economies, where increasing consumer awareness and infrastructure improvements are creating fertile ground for market expansion.
- Seamless Integration with IoT Platforms: The integration of smart labels with Internet of Things (IoT) platforms unlocks enhanced data analytics capabilities and enables more sophisticated supply chain optimization strategies.
- Continuous Development of Novel Sensing Technologies: Ongoing advancements in sensing technologies promise to further enhance the accuracy, reliability, and cost-effectiveness of smart label solutions, making them even more attractive to a broader range of applications.
Leading Players in the Spoil Detection Based Smart Labels Market Market
- CCL Industries Inc
- Scanbuy Inc
- SATO Holding AG
- Avery Dennison Corporation
- Innoscentia
- SpotSee
- Insignia Technologies
- Zebra Technologies Corporation
- Evigence Sensors
- Ensurge Micropower ASA
Key Developments in Spoil Detection Based Smart Labels Market Industry
- September 2021: Timestrip UK Limited launched a new vaccine temperature indicator, the VFM -7C, highlighting advancements in vaccine cold chain management.
- December 2021: SpotSee introduced its Vaccine Vial Indicator for enhanced cold chain monitoring of vaccines, addressing a critical need for temperature tracking.
- April 2022: SpotSee launched FreezeSafe, a cost-effective temperature indicator, broadening access to reliable temperature monitoring solutions.
- April 2022: Avery Dennison commenced operations at its new manufacturing facility in Greater Noida, India, demonstrating investment in global manufacturing capacity.
Strategic Outlook for Spoil Detection Based Smart Labels Market Market
The Spoil Detection Based Smart Labels Market is poised for substantial and sustained growth, propelled by a combination of technological innovations, escalating regulatory pressures, and the ever-increasing consumer demand for product transparency and traceability. Market consolidation is expected to continue through mergers and acquisitions, alongside the emergence of innovative solutions tailored to meet the unique needs of diverse end-user industries. The expansion into high-growth emerging markets and strategic integration with IoT platforms present significant opportunities for market penetration and future growth in the years to come.
Spoil Detection Based Smart Labels Market Segmentation
-
1. Technology (Qualitative Trend Analysis)
- 1.1. RFID
- 1.2. Sensing Label
- 1.3. NFC
-
2. End-user Industry
- 2.1. Pharmaceutical
- 2.2. Food and Beverage
- 2.3. Logistics
- 2.4. Cosmetics
- 2.5. Other End-user Industries
Spoil Detection Based Smart Labels Market Segmentation By Geography
-
1. North America
- 1.1. United States
- 1.2. Canada
-
2. Europe
- 2.1. Germany
- 2.2. United Kingdom
- 2.3. France
- 2.4. Rest of Europe
-
3. Asia Pacific
- 3.1. China
- 3.2. Japan
- 3.3. India
- 3.4. Rest of Asia Pacific
- 4. Latin America
- 5. Middle East and Africa
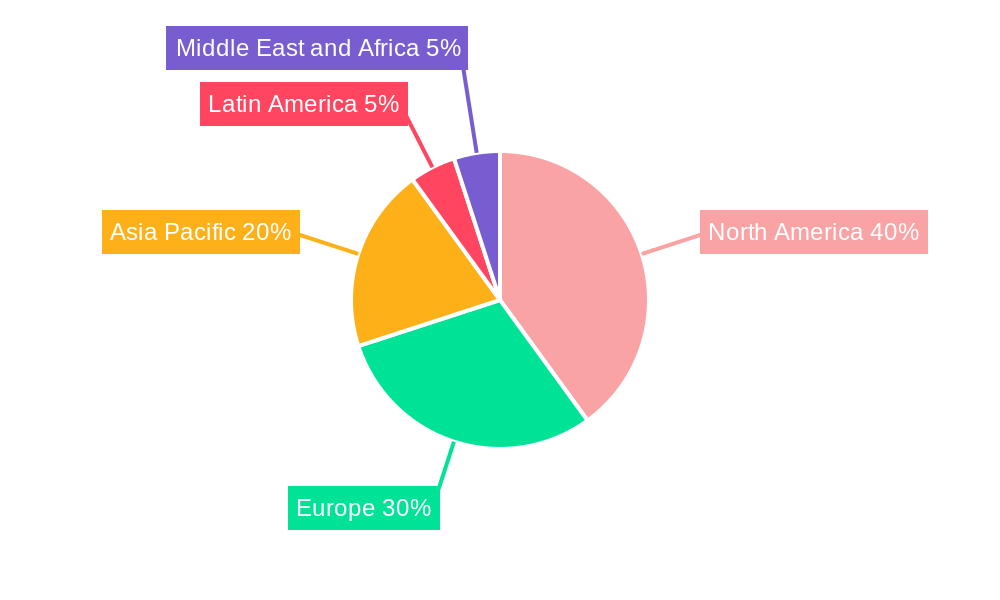
Spoil Detection Based Smart Labels Market Regional Market Share
Geographic Coverage of Spoil Detection Based Smart Labels Market
Spoil Detection Based Smart Labels Market REPORT HIGHLIGHTS
| Aspects | Details |
|---|---|
| Study Period | 2020-2034 |
| Base Year | 2025 |
| Estimated Year | 2026 |
| Forecast Period | 2026-2034 |
| Historical Period | 2020-2025 |
| Growth Rate | CAGR of 11.09% from 2020-2034 |
| Segmentation |
|
Table of Contents
- 1. Introduction
- 1.1. Research Scope
- 1.2. Market Segmentation
- 1.3. Research Objective
- 1.4. Definitions and Assumptions
- 2. Executive Summary
- 2.1. Market Snapshot
- 3. Market Dynamics
- 3.1. Market Drivers
- 3.2. Market Restrains
- 3.3. Market Trends
- 3.4. Market Opportunities
- 4. Market Factor Analysis
- 4.1. Porters Five Forces
- 4.1.1. Bargaining Power of Suppliers
- 4.1.2. Bargaining Power of Buyers
- 4.1.3. Threat of New Entrants
- 4.1.4. Threat of Substitutes
- 4.1.5. Competitive Rivalry
- 4.2. PESTEL analysis
- 4.3. BCG Analysis
- 4.3.1. Stars (High Growth, High Market Share)
- 4.3.2. Cash Cows (Low Growth, High Market Share)
- 4.3.3. Question Mark (High Growth, Low Market Share)
- 4.3.4. Dogs (Low Growth, Low Market Share)
- 4.4. Ansoff Matrix Analysis
- 4.5. Supply Chain Analysis
- 4.6. Regulatory Landscape
- 4.7. Current Market Potential and Opportunity Assessment (TAM–SAM–SOM Framework)
- 4.8. RAX Analyst Note
- 4.1. Porters Five Forces
- 5. Market Analysis, Insights and Forecast 2021-2033
- 5.1. Market Analysis, Insights and Forecast - by Technology (Qualitative Trend Analysis)
- 5.1.1. RFID
- 5.1.2. Sensing Label
- 5.1.3. NFC
- 5.2. Market Analysis, Insights and Forecast - by End-user Industry
- 5.2.1. Pharmaceutical
- 5.2.2. Food and Beverage
- 5.2.3. Logistics
- 5.2.4. Cosmetics
- 5.2.5. Other End-user Industries
- 5.3. Market Analysis, Insights and Forecast - by Region
- 5.3.1. North America
- 5.3.2. Europe
- 5.3.3. Asia Pacific
- 5.3.4. Latin America
- 5.3.5. Middle East and Africa
- 5.1. Market Analysis, Insights and Forecast - by Technology (Qualitative Trend Analysis)
- 6. Global Spoil Detection Based Smart Labels Market Analysis, Insights and Forecast, 2021-2033
- 6.1. Market Analysis, Insights and Forecast - by Technology (Qualitative Trend Analysis)
- 6.1.1. RFID
- 6.1.2. Sensing Label
- 6.1.3. NFC
- 6.2. Market Analysis, Insights and Forecast - by End-user Industry
- 6.2.1. Pharmaceutical
- 6.2.2. Food and Beverage
- 6.2.3. Logistics
- 6.2.4. Cosmetics
- 6.2.5. Other End-user Industries
- 6.1. Market Analysis, Insights and Forecast - by Technology (Qualitative Trend Analysis)
- 7. North America Spoil Detection Based Smart Labels Market Analysis, Insights and Forecast, 2020-2032
- 7.1. Market Analysis, Insights and Forecast - by Technology (Qualitative Trend Analysis)
- 7.1.1. RFID
- 7.1.2. Sensing Label
- 7.1.3. NFC
- 7.2. Market Analysis, Insights and Forecast - by End-user Industry
- 7.2.1. Pharmaceutical
- 7.2.2. Food and Beverage
- 7.2.3. Logistics
- 7.2.4. Cosmetics
- 7.2.5. Other End-user Industries
- 7.1. Market Analysis, Insights and Forecast - by Technology (Qualitative Trend Analysis)
- 8. Europe Spoil Detection Based Smart Labels Market Analysis, Insights and Forecast, 2020-2032
- 8.1. Market Analysis, Insights and Forecast - by Technology (Qualitative Trend Analysis)
- 8.1.1. RFID
- 8.1.2. Sensing Label
- 8.1.3. NFC
- 8.2. Market Analysis, Insights and Forecast - by End-user Industry
- 8.2.1. Pharmaceutical
- 8.2.2. Food and Beverage
- 8.2.3. Logistics
- 8.2.4. Cosmetics
- 8.2.5. Other End-user Industries
- 8.1. Market Analysis, Insights and Forecast - by Technology (Qualitative Trend Analysis)
- 9. Asia Pacific Spoil Detection Based Smart Labels Market Analysis, Insights and Forecast, 2020-2032
- 9.1. Market Analysis, Insights and Forecast - by Technology (Qualitative Trend Analysis)
- 9.1.1. RFID
- 9.1.2. Sensing Label
- 9.1.3. NFC
- 9.2. Market Analysis, Insights and Forecast - by End-user Industry
- 9.2.1. Pharmaceutical
- 9.2.2. Food and Beverage
- 9.2.3. Logistics
- 9.2.4. Cosmetics
- 9.2.5. Other End-user Industries
- 9.1. Market Analysis, Insights and Forecast - by Technology (Qualitative Trend Analysis)
- 10. Latin America Spoil Detection Based Smart Labels Market Analysis, Insights and Forecast, 2020-2032
- 10.1. Market Analysis, Insights and Forecast - by Technology (Qualitative Trend Analysis)
- 10.1.1. RFID
- 10.1.2. Sensing Label
- 10.1.3. NFC
- 10.2. Market Analysis, Insights and Forecast - by End-user Industry
- 10.2.1. Pharmaceutical
- 10.2.2. Food and Beverage
- 10.2.3. Logistics
- 10.2.4. Cosmetics
- 10.2.5. Other End-user Industries
- 10.1. Market Analysis, Insights and Forecast - by Technology (Qualitative Trend Analysis)
- 11. Middle East and Africa Spoil Detection Based Smart Labels Market Analysis, Insights and Forecast, 2020-2032
- 11.1. Market Analysis, Insights and Forecast - by Technology (Qualitative Trend Analysis)
- 11.1.1. RFID
- 11.1.2. Sensing Label
- 11.1.3. NFC
- 11.2. Market Analysis, Insights and Forecast - by End-user Industry
- 11.2.1. Pharmaceutical
- 11.2.2. Food and Beverage
- 11.2.3. Logistics
- 11.2.4. Cosmetics
- 11.2.5. Other End-user Industries
- 11.1. Market Analysis, Insights and Forecast - by Technology (Qualitative Trend Analysis)
- 12. Competitive Analysis
- 12.1. Company Profiles
- 12.1.1 CCL Industries Inc *List Not Exhaustive
- 12.1.1.1. Company Overview
- 12.1.1.2. Products
- 12.1.1.3. Company Financials
- 12.1.1.4. SWOT Analysis
- 12.1.2 Scanbuy Inc
- 12.1.2.1. Company Overview
- 12.1.2.2. Products
- 12.1.2.3. Company Financials
- 12.1.2.4. SWOT Analysis
- 12.1.3 SATO Holding AG
- 12.1.3.1. Company Overview
- 12.1.3.2. Products
- 12.1.3.3. Company Financials
- 12.1.3.4. SWOT Analysis
- 12.1.4 Avery Dennison Corporation
- 12.1.4.1. Company Overview
- 12.1.4.2. Products
- 12.1.4.3. Company Financials
- 12.1.4.4. SWOT Analysis
- 12.1.5 Innoscentia
- 12.1.5.1. Company Overview
- 12.1.5.2. Products
- 12.1.5.3. Company Financials
- 12.1.5.4. SWOT Analysis
- 12.1.6 SpotSee
- 12.1.6.1. Company Overview
- 12.1.6.2. Products
- 12.1.6.3. Company Financials
- 12.1.6.4. SWOT Analysis
- 12.1.7 Insignia Technologies
- 12.1.7.1. Company Overview
- 12.1.7.2. Products
- 12.1.7.3. Company Financials
- 12.1.7.4. SWOT Analysis
- 12.1.8 Zebra Technologies Corporation
- 12.1.8.1. Company Overview
- 12.1.8.2. Products
- 12.1.8.3. Company Financials
- 12.1.8.4. SWOT Analysis
- 12.1.9 Evigence Sensors
- 12.1.9.1. Company Overview
- 12.1.9.2. Products
- 12.1.9.3. Company Financials
- 12.1.9.4. SWOT Analysis
- 12.1.10 Ensurge Micropower ASA
- 12.1.10.1. Company Overview
- 12.1.10.2. Products
- 12.1.10.3. Company Financials
- 12.1.10.4. SWOT Analysis
- 12.1.1 CCL Industries Inc *List Not Exhaustive
- 12.2. Market Entropy
- 12.2.1 Company's Key Areas Served
- 12.2.2 Recent Developments
- 12.3. Company Market Share Analysis 2025
- 12.3.1 Top 5 Companies Market Share Analysis
- 12.3.2 Top 3 Companies Market Share Analysis
- 12.4. List of Potential Customers
- 13. Research Methodology
List of Figures
- Figure 1: Global Spoil Detection Based Smart Labels Market Revenue Breakdown (Million, %) by Region 2025 & 2033
- Figure 2: North America Spoil Detection Based Smart Labels Market Revenue (Million), by Technology (Qualitative Trend Analysis) 2025 & 2033
- Figure 3: North America Spoil Detection Based Smart Labels Market Revenue Share (%), by Technology (Qualitative Trend Analysis) 2025 & 2033
- Figure 4: North America Spoil Detection Based Smart Labels Market Revenue (Million), by End-user Industry 2025 & 2033
- Figure 5: North America Spoil Detection Based Smart Labels Market Revenue Share (%), by End-user Industry 2025 & 2033
- Figure 6: North America Spoil Detection Based Smart Labels Market Revenue (Million), by Country 2025 & 2033
- Figure 7: North America Spoil Detection Based Smart Labels Market Revenue Share (%), by Country 2025 & 2033
- Figure 8: Europe Spoil Detection Based Smart Labels Market Revenue (Million), by Technology (Qualitative Trend Analysis) 2025 & 2033
- Figure 9: Europe Spoil Detection Based Smart Labels Market Revenue Share (%), by Technology (Qualitative Trend Analysis) 2025 & 2033
- Figure 10: Europe Spoil Detection Based Smart Labels Market Revenue (Million), by End-user Industry 2025 & 2033
- Figure 11: Europe Spoil Detection Based Smart Labels Market Revenue Share (%), by End-user Industry 2025 & 2033
- Figure 12: Europe Spoil Detection Based Smart Labels Market Revenue (Million), by Country 2025 & 2033
- Figure 13: Europe Spoil Detection Based Smart Labels Market Revenue Share (%), by Country 2025 & 2033
- Figure 14: Asia Pacific Spoil Detection Based Smart Labels Market Revenue (Million), by Technology (Qualitative Trend Analysis) 2025 & 2033
- Figure 15: Asia Pacific Spoil Detection Based Smart Labels Market Revenue Share (%), by Technology (Qualitative Trend Analysis) 2025 & 2033
- Figure 16: Asia Pacific Spoil Detection Based Smart Labels Market Revenue (Million), by End-user Industry 2025 & 2033
- Figure 17: Asia Pacific Spoil Detection Based Smart Labels Market Revenue Share (%), by End-user Industry 2025 & 2033
- Figure 18: Asia Pacific Spoil Detection Based Smart Labels Market Revenue (Million), by Country 2025 & 2033
- Figure 19: Asia Pacific Spoil Detection Based Smart Labels Market Revenue Share (%), by Country 2025 & 2033
- Figure 20: Latin America Spoil Detection Based Smart Labels Market Revenue (Million), by Technology (Qualitative Trend Analysis) 2025 & 2033
- Figure 21: Latin America Spoil Detection Based Smart Labels Market Revenue Share (%), by Technology (Qualitative Trend Analysis) 2025 & 2033
- Figure 22: Latin America Spoil Detection Based Smart Labels Market Revenue (Million), by End-user Industry 2025 & 2033
- Figure 23: Latin America Spoil Detection Based Smart Labels Market Revenue Share (%), by End-user Industry 2025 & 2033
- Figure 24: Latin America Spoil Detection Based Smart Labels Market Revenue (Million), by Country 2025 & 2033
- Figure 25: Latin America Spoil Detection Based Smart Labels Market Revenue Share (%), by Country 2025 & 2033
- Figure 26: Middle East and Africa Spoil Detection Based Smart Labels Market Revenue (Million), by Technology (Qualitative Trend Analysis) 2025 & 2033
- Figure 27: Middle East and Africa Spoil Detection Based Smart Labels Market Revenue Share (%), by Technology (Qualitative Trend Analysis) 2025 & 2033
- Figure 28: Middle East and Africa Spoil Detection Based Smart Labels Market Revenue (Million), by End-user Industry 2025 & 2033
- Figure 29: Middle East and Africa Spoil Detection Based Smart Labels Market Revenue Share (%), by End-user Industry 2025 & 2033
- Figure 30: Middle East and Africa Spoil Detection Based Smart Labels Market Revenue (Million), by Country 2025 & 2033
- Figure 31: Middle East and Africa Spoil Detection Based Smart Labels Market Revenue Share (%), by Country 2025 & 2033
List of Tables
- Table 1: Global Spoil Detection Based Smart Labels Market Revenue Million Forecast, by Technology (Qualitative Trend Analysis) 2020 & 2033
- Table 2: Global Spoil Detection Based Smart Labels Market Revenue Million Forecast, by End-user Industry 2020 & 2033
- Table 3: Global Spoil Detection Based Smart Labels Market Revenue Million Forecast, by Region 2020 & 2033
- Table 4: Global Spoil Detection Based Smart Labels Market Revenue Million Forecast, by Technology (Qualitative Trend Analysis) 2020 & 2033
- Table 5: Global Spoil Detection Based Smart Labels Market Revenue Million Forecast, by End-user Industry 2020 & 2033
- Table 6: Global Spoil Detection Based Smart Labels Market Revenue Million Forecast, by Country 2020 & 2033
- Table 7: United States Spoil Detection Based Smart Labels Market Revenue (Million) Forecast, by Application 2020 & 2033
- Table 8: Canada Spoil Detection Based Smart Labels Market Revenue (Million) Forecast, by Application 2020 & 2033
- Table 9: Global Spoil Detection Based Smart Labels Market Revenue Million Forecast, by Technology (Qualitative Trend Analysis) 2020 & 2033
- Table 10: Global Spoil Detection Based Smart Labels Market Revenue Million Forecast, by End-user Industry 2020 & 2033
- Table 11: Global Spoil Detection Based Smart Labels Market Revenue Million Forecast, by Country 2020 & 2033
- Table 12: Germany Spoil Detection Based Smart Labels Market Revenue (Million) Forecast, by Application 2020 & 2033
- Table 13: United Kingdom Spoil Detection Based Smart Labels Market Revenue (Million) Forecast, by Application 2020 & 2033
- Table 14: France Spoil Detection Based Smart Labels Market Revenue (Million) Forecast, by Application 2020 & 2033
- Table 15: Rest of Europe Spoil Detection Based Smart Labels Market Revenue (Million) Forecast, by Application 2020 & 2033
- Table 16: Global Spoil Detection Based Smart Labels Market Revenue Million Forecast, by Technology (Qualitative Trend Analysis) 2020 & 2033
- Table 17: Global Spoil Detection Based Smart Labels Market Revenue Million Forecast, by End-user Industry 2020 & 2033
- Table 18: Global Spoil Detection Based Smart Labels Market Revenue Million Forecast, by Country 2020 & 2033
- Table 19: China Spoil Detection Based Smart Labels Market Revenue (Million) Forecast, by Application 2020 & 2033
- Table 20: Japan Spoil Detection Based Smart Labels Market Revenue (Million) Forecast, by Application 2020 & 2033
- Table 21: India Spoil Detection Based Smart Labels Market Revenue (Million) Forecast, by Application 2020 & 2033
- Table 22: Rest of Asia Pacific Spoil Detection Based Smart Labels Market Revenue (Million) Forecast, by Application 2020 & 2033
- Table 23: Global Spoil Detection Based Smart Labels Market Revenue Million Forecast, by Technology (Qualitative Trend Analysis) 2020 & 2033
- Table 24: Global Spoil Detection Based Smart Labels Market Revenue Million Forecast, by End-user Industry 2020 & 2033
- Table 25: Global Spoil Detection Based Smart Labels Market Revenue Million Forecast, by Country 2020 & 2033
- Table 26: Global Spoil Detection Based Smart Labels Market Revenue Million Forecast, by Technology (Qualitative Trend Analysis) 2020 & 2033
- Table 27: Global Spoil Detection Based Smart Labels Market Revenue Million Forecast, by End-user Industry 2020 & 2033
- Table 28: Global Spoil Detection Based Smart Labels Market Revenue Million Forecast, by Country 2020 & 2033
Frequently Asked Questions
1. What is the projected Compound Annual Growth Rate (CAGR) of the Spoil Detection Based Smart Labels Market?
The projected CAGR is approximately 11.09%.
2. Which companies are prominent players in the Spoil Detection Based Smart Labels Market?
Key companies in the market include CCL Industries Inc *List Not Exhaustive, Scanbuy Inc, SATO Holding AG, Avery Dennison Corporation, Innoscentia, SpotSee, Insignia Technologies, Zebra Technologies Corporation, Evigence Sensors, Ensurge Micropower ASA.
3. What are the main segments of the Spoil Detection Based Smart Labels Market?
The market segments include Technology (Qualitative Trend Analysis), End-user Industry.
4. Can you provide details about the market size?
The market size is estimated to be USD 1.00 Million as of 2022.
5. What are some drivers contributing to market growth?
Rising Need to Determine the Freshness of Products; Rising Consumer Preference for Hygienic Food Materials; Increasing Demand for Security and Tracking Solutions.
6. What are the notable trends driving market growth?
The RFID Segment is Expected to Hold a Major Market Share.
7. Are there any restraints impacting market growth?
Competition from Substitutes. such as Glass and Plastic Packaging.
8. Can you provide examples of recent developments in the market?
April 2022 - Avery Dennison, one of the leaders in global materials science and manufacturing, to commence operations in its new state-of-the-art manufacturing facility in Greater Noida. Through this new facility, the company will consolidate its manufacturing operations to serve customer demands better while optimizing the latest technology and leveraging improved efficiencies.
9. What pricing options are available for accessing the report?
Pricing options include single-user, multi-user, and enterprise licenses priced at USD 4750, USD 5250, and USD 8750 respectively.
10. Is the market size provided in terms of value or volume?
The market size is provided in terms of value, measured in Million.
11. Are there any specific market keywords associated with the report?
Yes, the market keyword associated with the report is "Spoil Detection Based Smart Labels Market," which aids in identifying and referencing the specific market segment covered.
12. How do I determine which pricing option suits my needs best?
The pricing options vary based on user requirements and access needs. Individual users may opt for single-user licenses, while businesses requiring broader access may choose multi-user or enterprise licenses for cost-effective access to the report.
13. Are there any additional resources or data provided in the Spoil Detection Based Smart Labels Market report?
While the report offers comprehensive insights, it's advisable to review the specific contents or supplementary materials provided to ascertain if additional resources or data are available.
14. How can I stay updated on further developments or reports in the Spoil Detection Based Smart Labels Market?
To stay informed about further developments, trends, and reports in the Spoil Detection Based Smart Labels Market, consider subscribing to industry newsletters, following relevant companies and organizations, or regularly checking reputable industry news sources and publications.
Methodology
Step 1 - Identification of Relevant Samples Size from Population Database


Step 2 - Approaches for Defining Global Market Size (Value, Volume* & Price*)

Note*: In applicable scenarios
Step 3 - Data Sources
Primary Research
- Web Analytics
- Survey Reports
- Research Institute
- Latest Research Reports
- Opinion Leaders
Secondary Research
- Annual Reports
- White Paper
- Latest Press Release
- Industry Association
- Paid Database
- Investor Presentations

Step 4 - Data Triangulation
Involves using different sources of information in order to increase the validity of a study
These sources are likely to be stakeholders in a program - participants, other researchers, program staff, other community members, and so on.
Then we put all data in single framework & apply various statistical tools to find out the dynamic on the market.
During the analysis stage, feedback from the stakeholder groups would be compared to determine areas of agreement as well as areas of divergence