

Key Insights
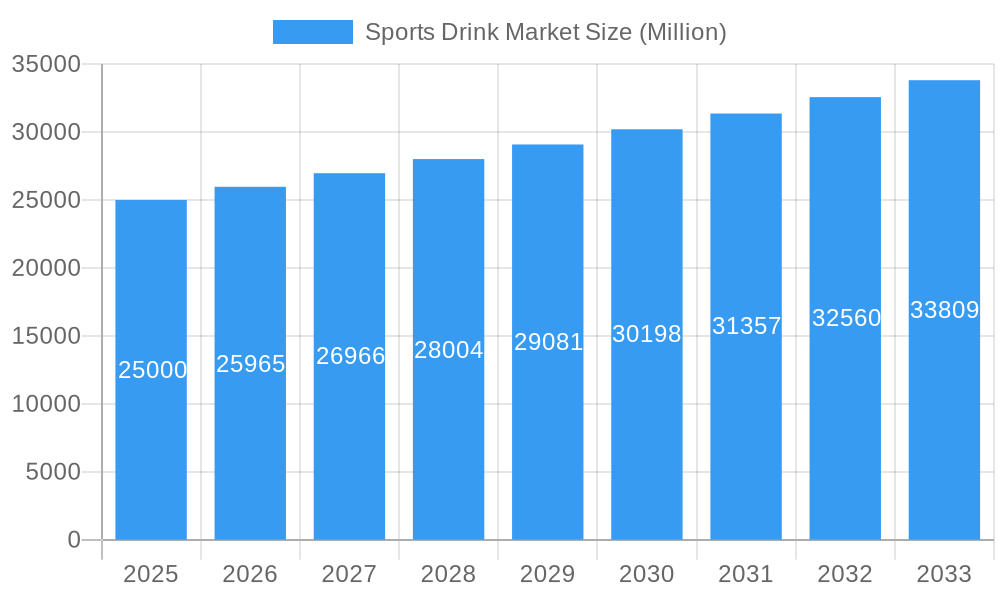
The global sports drink market, valued at $37.17 billion in 2025, is projected for significant expansion with a Compound Annual Growth Rate (CAGR) of 6.54% from 2025 to 2033. Key growth drivers include increasing global health and fitness consciousness, particularly among athletes and active individuals, alongside the rising popularity of endurance sports. Product innovation focusing on healthier formulations, such as reduced sugar and enhanced electrolyte content, is broadening consumer appeal. A robust distribution network across supermarkets, convenience stores, online retail, and specialty outlets ensures widespread market accessibility. However, challenges persist, including consumer concerns over sugar content and competition from alternative hydration options like coconut water and enhanced water, necessitating ongoing innovation and strategic marketing.
Sports Drink Market Market Size (In Billion)
Regional growth is anticipated to be strongest in Asia-Pacific and North America, supported by rising disposable incomes and heightened health awareness. Market segmentation reveals a growing preference for aseptic packaging for its extended shelf life and product quality preservation. Online retail channels are experiencing rapid expansion, reflecting the broader shift to e-commerce. Isotonic and electrolyte-enhanced drinks remain the most sought-after categories, underscoring the critical role of hydration and electrolyte replenishment. Leading companies such as Coca-Cola, PepsiCo, and Monster Beverage leverage their extensive distribution and marketing capabilities. The emergence of niche brands focused on organic and plant-based products presents both opportunities and competitive pressures. The market landscape is characterized by intense competition, strategic alliances, and a focus on product innovation and distribution partnerships. Future expansion hinges on adapting to evolving consumer preferences, sustained innovation, and navigating regulatory changes regarding sugar content and labeling.
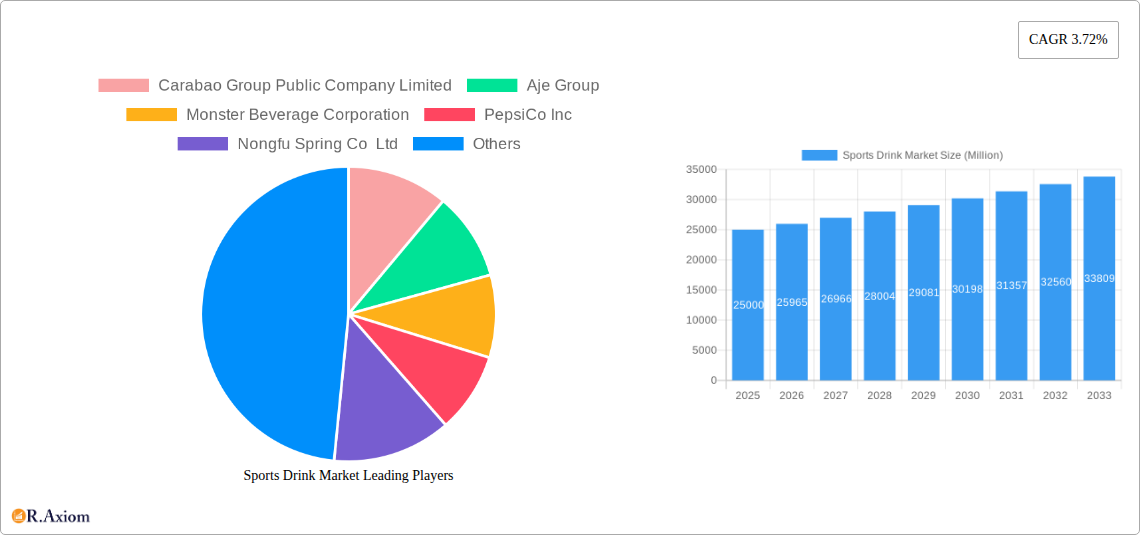
Sports Drink Market Company Market Share
This comprehensive report analyzes the global sports drink market from 2019 to 2033, offering in-depth insights into market dynamics, growth factors, challenges, and emerging opportunities. It provides actionable intelligence for strategic decision-making through detailed market sizing, segmentation, competitive landscape analysis, and key developments, presenting a holistic view of this dynamic industry.
Sports Drink Market Concentration & Innovation
This section analyzes the competitive landscape of the sports drink market, evaluating market concentration, innovation drivers, regulatory influences, and market dynamics. We examine mergers and acquisitions (M&A) activity and its impact on market share distribution. The analysis encompasses the period from 2019 to 2024, providing a historical perspective and laying the groundwork for forecasting future trends.
Market Concentration: The global sports drink market exhibits a moderately concentrated structure, with a few major players holding significant market share. The top five players – Coca-Cola, PepsiCo, Monster Beverage, Abbott Laboratories, and Suntory Holdings – collectively account for approximately xx% of the global market in 2024. However, regional variations exist, with higher concentration observed in developed markets.
Innovation Drivers: Product innovation is a crucial driver, with companies focusing on functional enhancements (e.g., added electrolytes, vitamins, and protein), natural ingredients, and unique flavor profiles. Sustainability initiatives, such as eco-friendly packaging, are also gaining traction.
Regulatory Frameworks: Government regulations concerning sugar content, labeling, and health claims significantly impact product formulation and marketing strategies. These regulations vary across geographies, creating complex compliance requirements for global players.
Product Substitutes: The sports drink market faces competition from alternative hydration options, including plain water, enhanced water, and fruit juices. The increasing consumer awareness of healthy lifestyles fuels this competition.
End-User Trends: Health-conscious consumers are increasingly seeking low-sugar, natural, and functional sports drinks. This trend drives innovation towards healthier product formulations and clearer labeling.
M&A Activities: The sports drink market has witnessed significant M&A activity in recent years, with larger players acquiring smaller brands to expand their product portfolio and geographical reach. The total value of M&A deals in the sports drink sector during the historical period (2019-2024) amounted to approximately xx Million.
Sports Drink Market Industry Trends & Insights
This section dives into the key trends shaping the sports drink market, focusing on growth drivers, technological advancements, consumer preferences, and competitive dynamics. We analyze historical data and projections to forecast future growth.
The global sports drink market is experiencing robust growth, fueled by factors such as rising health consciousness, increased participation in sports and fitness activities, and the expanding middle class in developing economies. The market registered a Compound Annual Growth Rate (CAGR) of xx% during the historical period (2019-2024). This growth is anticipated to continue throughout the forecast period (2025-2033), albeit at a slightly moderated pace, reaching a projected value of xx Million by 2033.
Technological advancements, particularly in packaging and distribution, are revolutionizing the industry. The rise of e-commerce platforms and online retail channels is facilitating wider market penetration. Consumer preferences are shifting toward healthier and more functional sports drinks, triggering a surge in the demand for low-sugar, electrolyte-enhanced, and protein-based beverages. The intense competition among established players and emerging brands fuels product innovation and marketing strategies. Market penetration in emerging economies remains a key focus, with untapped opportunities driving growth.
Dominant Markets & Segments in Sports Drink Market
This section identifies the leading regions, countries, and segments within the sports drink market. It analyzes the factors contributing to their dominance, including economic policies, infrastructure, and consumer behavior.
Leading Regions/Countries: North America and Europe currently dominate the sports drink market, driven by high per capita consumption and established distribution networks. However, Asia-Pacific is expected to experience significant growth in the coming years, owing to rising disposable incomes and increased awareness of health and fitness.
- Key Drivers (Asia-Pacific):
- Growing middle class
- Rising disposable incomes
- Increased participation in sports and fitness activities
- Favorable demographic trends
Dominant Segments:
Packaging Type: PET bottles currently hold the largest market share, due to their cost-effectiveness and convenience. However, aseptic packages are witnessing significant growth, driven by their extended shelf life and ability to preserve product freshness.
Distribution Channel: Supermarket/hypermarkets and convenience stores are the primary distribution channels, accounting for a majority of sales. However, online retail is experiencing rapid expansion, offering convenient access to sports drinks for consumers.
Soft Drink Type: Isotonic drinks dominate the market, catering to the needs of athletes and fitness enthusiasts. However, electrolyte-enhanced water and protein-based sports drinks are also gaining popularity, reflecting the increasing consumer preference for healthier and functional beverages.
Sports Drink Market Product Developments
Recent product innovations in the sports drink market focus on enhancing functionality, improving taste, and promoting health and wellness. Manufacturers are incorporating natural ingredients, reducing sugar content, and adding beneficial nutrients such as vitamins, minerals, and protein. Technological advancements in packaging, such as lightweight and sustainable materials, are also gaining traction. These developments aim to cater to the evolving consumer preferences and enhance the competitive advantage of the brands in this dynamic market.
Report Scope & Segmentation Analysis
This report provides a comprehensive segmentation analysis of the global sports drink market, covering the following categories:
Packaging Type: Aseptic packages, Metal Can, PET Bottles. The market size and growth projections vary across packaging types, with PET bottles currently dominating the market, followed by aseptic packages and metal cans. Competitive dynamics also differ across segments.
Sub Distribution Channel: Convenience Stores, Online Retail, Specialty Stores, Supermarket/Hypermarket, Others. Growth is being driven by expansion into online retail channels, complementing the established distribution networks through supermarket/hypermarkets and convenience stores.
Soft Drink Type: Electrolyte-Enhanced Water, Hypertonic, Hypotonic, Isotonic, Protein-based Sport Drinks. Isotonic drinks represent the largest segment, followed by electrolyte-enhanced water and protein-based drinks, reflecting consumer demand for healthier and functional hydration.
Key Drivers of Sports Drink Market Growth
The growth of the sports drink market is driven by a convergence of factors:
- Rising Health Consciousness: Consumers are increasingly prioritizing health and wellness, leading to increased demand for functional beverages.
- Growing Fitness Culture: Participation in sports and fitness activities is rising globally, fueling the consumption of sports drinks.
- Product Innovation: Continuous innovations in flavor, functionality, and packaging enhance the appeal of sports drinks.
- Expanding Distribution Networks: Wider availability through diverse channels enhances market penetration.
Challenges in the Sports Drink Market Sector
The sports drink market faces several challenges:
- Intense Competition: The market is characterized by fierce competition from established players and emerging brands.
- Health Concerns: Concerns about high sugar content and artificial ingredients impact consumer perception.
- Economic Fluctuations: Economic downturns can affect consumer spending on discretionary items like sports drinks.
- Supply Chain Disruptions: Global supply chain challenges can impact production and distribution.
Emerging Opportunities in Sports Drink Market
Emerging opportunities in the sports drink market include:
- Expansion in Emerging Markets: Untapped potential exists in developing economies with rapidly growing middle classes.
- Premiumization: Demand for premium, high-quality sports drinks with added functionalities is rising.
- Functionalization: The incorporation of added health benefits, like vitamins or antioxidants, enhances product appeal.
- Sustainability Initiatives: Eco-friendly packaging and production practices align with consumer demand for ethical products.
Leading Players in the Sports Drink Market Market
- Carabao Group Public Company Limited
- Aje Group
- Monster Beverage Corporation
- PepsiCo Inc
- Nongfu Spring Co Ltd
- The Coca-Cola Company
- Abbott Laboratories
- Suntory Holdings Limited
- Seven & i Holdings Co Ltd
- Keurig Dr Pepper Inc
- Thai Beverages PCL
- Otsuka Holdings Co Ltd
- Congo Brands
Key Developments in Sports Drink Market Industry
- September 2023: Limca Sportz launches its new variant Limca Sportz ION4 in India.
- December 2023: Spar partners with Congo Brands to stock Prime drinks.
- February 2024: Pepsi Gatorade partners with top-tier Saudi Arabian soccer.
Strategic Outlook for Sports Drink Market Market
The future of the sports drink market appears promising, driven by consistent growth across various segments. The continued focus on product innovation, expansion into new markets, and addressing consumer demand for healthy and functional beverages will shape future market dynamics. The strategic adaptation to evolving consumer preferences and technological advancements will be crucial for success in this competitive market. The market's projected growth trajectory indicates substantial opportunities for established players and new entrants alike.
Sports Drink Market Segmentation
-
1. Soft Drink Type
- 1.1. Electrolyte-Enhanced Water
- 1.2. Hypertonic
- 1.3. Hypotonic
- 1.4. Isotonic
- 1.5. Protein-based Sport Drinks
-
2. Packaging Type
- 2.1. Aseptic packages
- 2.2. Metal Can
- 2.3. PET Bottles
-
3. Sub Distribution Channel
- 3.1. Convenience Stores
- 3.2. Online Retail
- 3.3. Specialty Stores
- 3.4. Supermarket/Hypermarket
- 3.5. Others
Sports Drink Market Segmentation By Geography
-
1. North America
- 1.1. United States
- 1.2. Canada
- 1.3. Mexico
-
2. South America
- 2.1. Brazil
- 2.2. Argentina
- 2.3. Rest of South America
-
3. Europe
- 3.1. United Kingdom
- 3.2. Germany
- 3.3. France
- 3.4. Italy
- 3.5. Spain
- 3.6. Russia
- 3.7. Benelux
- 3.8. Nordics
- 3.9. Rest of Europe
-
4. Middle East & Africa
- 4.1. Turkey
- 4.2. Israel
- 4.3. GCC
- 4.4. North Africa
- 4.5. South Africa
- 4.6. Rest of Middle East & Africa
-
5. Asia Pacific
- 5.1. China
- 5.2. India
- 5.3. Japan
- 5.4. South Korea
- 5.5. ASEAN
- 5.6. Oceania
- 5.7. Rest of Asia Pacific
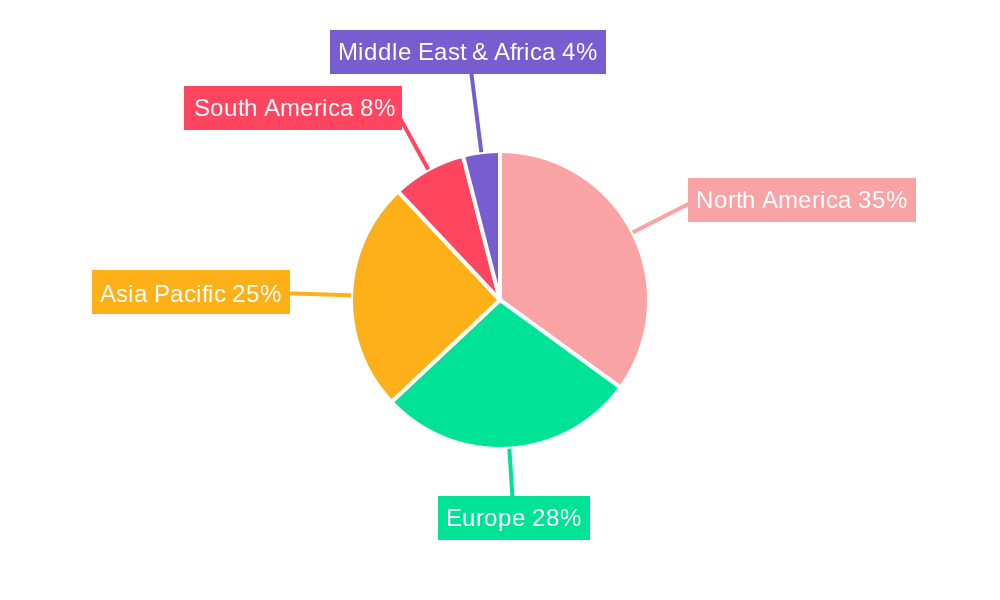
Sports Drink Market Regional Market Share
Geographic Coverage of Sports Drink Market
Sports Drink Market REPORT HIGHLIGHTS
| Aspects | Details |
|---|---|
| Study Period | 2020-2034 |
| Base Year | 2025 |
| Estimated Year | 2026 |
| Forecast Period | 2026-2034 |
| Historical Period | 2020-2025 |
| Growth Rate | CAGR of 6.54% from 2020-2034 |
| Segmentation |
|
Table of Contents
- 1. Introduction
- 1.1. Research Scope
- 1.2. Market Segmentation
- 1.3. Research Objective
- 1.4. Definitions and Assumptions
- 2. Executive Summary
- 2.1. Market Snapshot
- 3. Market Dynamics
- 3.1. Market Drivers
- 3.2. Market Restrains
- 3.3. Market Trends
- 3.4. Market Opportunities
- 4. Market Factor Analysis
- 4.1. Porters Five Forces
- 4.1.1. Bargaining Power of Suppliers
- 4.1.2. Bargaining Power of Buyers
- 4.1.3. Threat of New Entrants
- 4.1.4. Threat of Substitutes
- 4.1.5. Competitive Rivalry
- 4.2. PESTEL analysis
- 4.3. BCG Analysis
- 4.3.1. Stars (High Growth, High Market Share)
- 4.3.2. Cash Cows (Low Growth, High Market Share)
- 4.3.3. Question Mark (High Growth, Low Market Share)
- 4.3.4. Dogs (Low Growth, Low Market Share)
- 4.4. Ansoff Matrix Analysis
- 4.5. Supply Chain Analysis
- 4.6. Regulatory Landscape
- 4.7. Current Market Potential and Opportunity Assessment (TAM–SAM–SOM Framework)
- 4.8. RAX Analyst Note
- 4.1. Porters Five Forces
- 5. Market Analysis, Insights and Forecast 2021-2033
- 5.1. Market Analysis, Insights and Forecast - by Soft Drink Type
- 5.1.1. Electrolyte-Enhanced Water
- 5.1.2. Hypertonic
- 5.1.3. Hypotonic
- 5.1.4. Isotonic
- 5.1.5. Protein-based Sport Drinks
- 5.2. Market Analysis, Insights and Forecast - by Packaging Type
- 5.2.1. Aseptic packages
- 5.2.2. Metal Can
- 5.2.3. PET Bottles
- 5.3. Market Analysis, Insights and Forecast - by Sub Distribution Channel
- 5.3.1. Convenience Stores
- 5.3.2. Online Retail
- 5.3.3. Specialty Stores
- 5.3.4. Supermarket/Hypermarket
- 5.3.5. Others
- 5.4. Market Analysis, Insights and Forecast - by Region
- 5.4.1. North America
- 5.4.2. South America
- 5.4.3. Europe
- 5.4.4. Middle East & Africa
- 5.4.5. Asia Pacific
- 5.1. Market Analysis, Insights and Forecast - by Soft Drink Type
- 6. Global Sports Drink Market Analysis, Insights and Forecast, 2021-2033
- 6.1. Market Analysis, Insights and Forecast - by Soft Drink Type
- 6.1.1. Electrolyte-Enhanced Water
- 6.1.2. Hypertonic
- 6.1.3. Hypotonic
- 6.1.4. Isotonic
- 6.1.5. Protein-based Sport Drinks
- 6.2. Market Analysis, Insights and Forecast - by Packaging Type
- 6.2.1. Aseptic packages
- 6.2.2. Metal Can
- 6.2.3. PET Bottles
- 6.3. Market Analysis, Insights and Forecast - by Sub Distribution Channel
- 6.3.1. Convenience Stores
- 6.3.2. Online Retail
- 6.3.3. Specialty Stores
- 6.3.4. Supermarket/Hypermarket
- 6.3.5. Others
- 6.1. Market Analysis, Insights and Forecast - by Soft Drink Type
- 7. North America Sports Drink Market Analysis, Insights and Forecast, 2020-2032
- 7.1. Market Analysis, Insights and Forecast - by Soft Drink Type
- 7.1.1. Electrolyte-Enhanced Water
- 7.1.2. Hypertonic
- 7.1.3. Hypotonic
- 7.1.4. Isotonic
- 7.1.5. Protein-based Sport Drinks
- 7.2. Market Analysis, Insights and Forecast - by Packaging Type
- 7.2.1. Aseptic packages
- 7.2.2. Metal Can
- 7.2.3. PET Bottles
- 7.3. Market Analysis, Insights and Forecast - by Sub Distribution Channel
- 7.3.1. Convenience Stores
- 7.3.2. Online Retail
- 7.3.3. Specialty Stores
- 7.3.4. Supermarket/Hypermarket
- 7.3.5. Others
- 7.1. Market Analysis, Insights and Forecast - by Soft Drink Type
- 8. South America Sports Drink Market Analysis, Insights and Forecast, 2020-2032
- 8.1. Market Analysis, Insights and Forecast - by Soft Drink Type
- 8.1.1. Electrolyte-Enhanced Water
- 8.1.2. Hypertonic
- 8.1.3. Hypotonic
- 8.1.4. Isotonic
- 8.1.5. Protein-based Sport Drinks
- 8.2. Market Analysis, Insights and Forecast - by Packaging Type
- 8.2.1. Aseptic packages
- 8.2.2. Metal Can
- 8.2.3. PET Bottles
- 8.3. Market Analysis, Insights and Forecast - by Sub Distribution Channel
- 8.3.1. Convenience Stores
- 8.3.2. Online Retail
- 8.3.3. Specialty Stores
- 8.3.4. Supermarket/Hypermarket
- 8.3.5. Others
- 8.1. Market Analysis, Insights and Forecast - by Soft Drink Type
- 9. Europe Sports Drink Market Analysis, Insights and Forecast, 2020-2032
- 9.1. Market Analysis, Insights and Forecast - by Soft Drink Type
- 9.1.1. Electrolyte-Enhanced Water
- 9.1.2. Hypertonic
- 9.1.3. Hypotonic
- 9.1.4. Isotonic
- 9.1.5. Protein-based Sport Drinks
- 9.2. Market Analysis, Insights and Forecast - by Packaging Type
- 9.2.1. Aseptic packages
- 9.2.2. Metal Can
- 9.2.3. PET Bottles
- 9.3. Market Analysis, Insights and Forecast - by Sub Distribution Channel
- 9.3.1. Convenience Stores
- 9.3.2. Online Retail
- 9.3.3. Specialty Stores
- 9.3.4. Supermarket/Hypermarket
- 9.3.5. Others
- 9.1. Market Analysis, Insights and Forecast - by Soft Drink Type
- 10. Middle East & Africa Sports Drink Market Analysis, Insights and Forecast, 2020-2032
- 10.1. Market Analysis, Insights and Forecast - by Soft Drink Type
- 10.1.1. Electrolyte-Enhanced Water
- 10.1.2. Hypertonic
- 10.1.3. Hypotonic
- 10.1.4. Isotonic
- 10.1.5. Protein-based Sport Drinks
- 10.2. Market Analysis, Insights and Forecast - by Packaging Type
- 10.2.1. Aseptic packages
- 10.2.2. Metal Can
- 10.2.3. PET Bottles
- 10.3. Market Analysis, Insights and Forecast - by Sub Distribution Channel
- 10.3.1. Convenience Stores
- 10.3.2. Online Retail
- 10.3.3. Specialty Stores
- 10.3.4. Supermarket/Hypermarket
- 10.3.5. Others
- 10.1. Market Analysis, Insights and Forecast - by Soft Drink Type
- 11. Asia Pacific Sports Drink Market Analysis, Insights and Forecast, 2020-2032
- 11.1. Market Analysis, Insights and Forecast - by Soft Drink Type
- 11.1.1. Electrolyte-Enhanced Water
- 11.1.2. Hypertonic
- 11.1.3. Hypotonic
- 11.1.4. Isotonic
- 11.1.5. Protein-based Sport Drinks
- 11.2. Market Analysis, Insights and Forecast - by Packaging Type
- 11.2.1. Aseptic packages
- 11.2.2. Metal Can
- 11.2.3. PET Bottles
- 11.3. Market Analysis, Insights and Forecast - by Sub Distribution Channel
- 11.3.1. Convenience Stores
- 11.3.2. Online Retail
- 11.3.3. Specialty Stores
- 11.3.4. Supermarket/Hypermarket
- 11.3.5. Others
- 11.1. Market Analysis, Insights and Forecast - by Soft Drink Type
- 12. Competitive Analysis
- 12.1. Company Profiles
- 12.1.1 Carabao Group Public Company Limited
- 12.1.1.1. Company Overview
- 12.1.1.2. Products
- 12.1.1.3. Company Financials
- 12.1.1.4. SWOT Analysis
- 12.1.2 Aje Group
- 12.1.2.1. Company Overview
- 12.1.2.2. Products
- 12.1.2.3. Company Financials
- 12.1.2.4. SWOT Analysis
- 12.1.3 Monster Beverage Corporation
- 12.1.3.1. Company Overview
- 12.1.3.2. Products
- 12.1.3.3. Company Financials
- 12.1.3.4. SWOT Analysis
- 12.1.4 PepsiCo Inc
- 12.1.4.1. Company Overview
- 12.1.4.2. Products
- 12.1.4.3. Company Financials
- 12.1.4.4. SWOT Analysis
- 12.1.5 Nongfu Spring Co Ltd
- 12.1.5.1. Company Overview
- 12.1.5.2. Products
- 12.1.5.3. Company Financials
- 12.1.5.4. SWOT Analysis
- 12.1.6 The Coca-Cola Compan
- 12.1.6.1. Company Overview
- 12.1.6.2. Products
- 12.1.6.3. Company Financials
- 12.1.6.4. SWOT Analysis
- 12.1.7 Abbott Laboratories
- 12.1.7.1. Company Overview
- 12.1.7.2. Products
- 12.1.7.3. Company Financials
- 12.1.7.4. SWOT Analysis
- 12.1.8 Suntory Holdings Limited
- 12.1.8.1. Company Overview
- 12.1.8.2. Products
- 12.1.8.3. Company Financials
- 12.1.8.4. SWOT Analysis
- 12.1.9 Seven & i Holdings Co Ltd
- 12.1.9.1. Company Overview
- 12.1.9.2. Products
- 12.1.9.3. Company Financials
- 12.1.9.4. SWOT Analysis
- 12.1.10 Keurig Dr Pepper Inc
- 12.1.10.1. Company Overview
- 12.1.10.2. Products
- 12.1.10.3. Company Financials
- 12.1.10.4. SWOT Analysis
- 12.1.11 Thai Beverages PCL
- 12.1.11.1. Company Overview
- 12.1.11.2. Products
- 12.1.11.3. Company Financials
- 12.1.11.4. SWOT Analysis
- 12.1.12 Otsuka Holdings Co Ltd
- 12.1.12.1. Company Overview
- 12.1.12.2. Products
- 12.1.12.3. Company Financials
- 12.1.12.4. SWOT Analysis
- 12.1.13 Congo Brands
- 12.1.13.1. Company Overview
- 12.1.13.2. Products
- 12.1.13.3. Company Financials
- 12.1.13.4. SWOT Analysis
- 12.1.1 Carabao Group Public Company Limited
- 12.2. Market Entropy
- 12.2.1 Company's Key Areas Served
- 12.2.2 Recent Developments
- 12.3. Company Market Share Analysis 2025
- 12.3.1 Top 5 Companies Market Share Analysis
- 12.3.2 Top 3 Companies Market Share Analysis
- 12.4. List of Potential Customers
- 13. Research Methodology
List of Figures
- Figure 1: Global Sports Drink Market Revenue Breakdown (billion, %) by Region 2025 & 2033
- Figure 2: North America Sports Drink Market Revenue (billion), by Soft Drink Type 2025 & 2033
- Figure 3: North America Sports Drink Market Revenue Share (%), by Soft Drink Type 2025 & 2033
- Figure 4: North America Sports Drink Market Revenue (billion), by Packaging Type 2025 & 2033
- Figure 5: North America Sports Drink Market Revenue Share (%), by Packaging Type 2025 & 2033
- Figure 6: North America Sports Drink Market Revenue (billion), by Sub Distribution Channel 2025 & 2033
- Figure 7: North America Sports Drink Market Revenue Share (%), by Sub Distribution Channel 2025 & 2033
- Figure 8: North America Sports Drink Market Revenue (billion), by Country 2025 & 2033
- Figure 9: North America Sports Drink Market Revenue Share (%), by Country 2025 & 2033
- Figure 10: South America Sports Drink Market Revenue (billion), by Soft Drink Type 2025 & 2033
- Figure 11: South America Sports Drink Market Revenue Share (%), by Soft Drink Type 2025 & 2033
- Figure 12: South America Sports Drink Market Revenue (billion), by Packaging Type 2025 & 2033
- Figure 13: South America Sports Drink Market Revenue Share (%), by Packaging Type 2025 & 2033
- Figure 14: South America Sports Drink Market Revenue (billion), by Sub Distribution Channel 2025 & 2033
- Figure 15: South America Sports Drink Market Revenue Share (%), by Sub Distribution Channel 2025 & 2033
- Figure 16: South America Sports Drink Market Revenue (billion), by Country 2025 & 2033
- Figure 17: South America Sports Drink Market Revenue Share (%), by Country 2025 & 2033
- Figure 18: Europe Sports Drink Market Revenue (billion), by Soft Drink Type 2025 & 2033
- Figure 19: Europe Sports Drink Market Revenue Share (%), by Soft Drink Type 2025 & 2033
- Figure 20: Europe Sports Drink Market Revenue (billion), by Packaging Type 2025 & 2033
- Figure 21: Europe Sports Drink Market Revenue Share (%), by Packaging Type 2025 & 2033
- Figure 22: Europe Sports Drink Market Revenue (billion), by Sub Distribution Channel 2025 & 2033
- Figure 23: Europe Sports Drink Market Revenue Share (%), by Sub Distribution Channel 2025 & 2033
- Figure 24: Europe Sports Drink Market Revenue (billion), by Country 2025 & 2033
- Figure 25: Europe Sports Drink Market Revenue Share (%), by Country 2025 & 2033
- Figure 26: Middle East & Africa Sports Drink Market Revenue (billion), by Soft Drink Type 2025 & 2033
- Figure 27: Middle East & Africa Sports Drink Market Revenue Share (%), by Soft Drink Type 2025 & 2033
- Figure 28: Middle East & Africa Sports Drink Market Revenue (billion), by Packaging Type 2025 & 2033
- Figure 29: Middle East & Africa Sports Drink Market Revenue Share (%), by Packaging Type 2025 & 2033
- Figure 30: Middle East & Africa Sports Drink Market Revenue (billion), by Sub Distribution Channel 2025 & 2033
- Figure 31: Middle East & Africa Sports Drink Market Revenue Share (%), by Sub Distribution Channel 2025 & 2033
- Figure 32: Middle East & Africa Sports Drink Market Revenue (billion), by Country 2025 & 2033
- Figure 33: Middle East & Africa Sports Drink Market Revenue Share (%), by Country 2025 & 2033
- Figure 34: Asia Pacific Sports Drink Market Revenue (billion), by Soft Drink Type 2025 & 2033
- Figure 35: Asia Pacific Sports Drink Market Revenue Share (%), by Soft Drink Type 2025 & 2033
- Figure 36: Asia Pacific Sports Drink Market Revenue (billion), by Packaging Type 2025 & 2033
- Figure 37: Asia Pacific Sports Drink Market Revenue Share (%), by Packaging Type 2025 & 2033
- Figure 38: Asia Pacific Sports Drink Market Revenue (billion), by Sub Distribution Channel 2025 & 2033
- Figure 39: Asia Pacific Sports Drink Market Revenue Share (%), by Sub Distribution Channel 2025 & 2033
- Figure 40: Asia Pacific Sports Drink Market Revenue (billion), by Country 2025 & 2033
- Figure 41: Asia Pacific Sports Drink Market Revenue Share (%), by Country 2025 & 2033
List of Tables
- Table 1: Global Sports Drink Market Revenue billion Forecast, by Soft Drink Type 2020 & 2033
- Table 2: Global Sports Drink Market Revenue billion Forecast, by Packaging Type 2020 & 2033
- Table 3: Global Sports Drink Market Revenue billion Forecast, by Sub Distribution Channel 2020 & 2033
- Table 4: Global Sports Drink Market Revenue billion Forecast, by Region 2020 & 2033
- Table 5: Global Sports Drink Market Revenue billion Forecast, by Soft Drink Type 2020 & 2033
- Table 6: Global Sports Drink Market Revenue billion Forecast, by Packaging Type 2020 & 2033
- Table 7: Global Sports Drink Market Revenue billion Forecast, by Sub Distribution Channel 2020 & 2033
- Table 8: Global Sports Drink Market Revenue billion Forecast, by Country 2020 & 2033
- Table 9: United States Sports Drink Market Revenue (billion) Forecast, by Application 2020 & 2033
- Table 10: Canada Sports Drink Market Revenue (billion) Forecast, by Application 2020 & 2033
- Table 11: Mexico Sports Drink Market Revenue (billion) Forecast, by Application 2020 & 2033
- Table 12: Global Sports Drink Market Revenue billion Forecast, by Soft Drink Type 2020 & 2033
- Table 13: Global Sports Drink Market Revenue billion Forecast, by Packaging Type 2020 & 2033
- Table 14: Global Sports Drink Market Revenue billion Forecast, by Sub Distribution Channel 2020 & 2033
- Table 15: Global Sports Drink Market Revenue billion Forecast, by Country 2020 & 2033
- Table 16: Brazil Sports Drink Market Revenue (billion) Forecast, by Application 2020 & 2033
- Table 17: Argentina Sports Drink Market Revenue (billion) Forecast, by Application 2020 & 2033
- Table 18: Rest of South America Sports Drink Market Revenue (billion) Forecast, by Application 2020 & 2033
- Table 19: Global Sports Drink Market Revenue billion Forecast, by Soft Drink Type 2020 & 2033
- Table 20: Global Sports Drink Market Revenue billion Forecast, by Packaging Type 2020 & 2033
- Table 21: Global Sports Drink Market Revenue billion Forecast, by Sub Distribution Channel 2020 & 2033
- Table 22: Global Sports Drink Market Revenue billion Forecast, by Country 2020 & 2033
- Table 23: United Kingdom Sports Drink Market Revenue (billion) Forecast, by Application 2020 & 2033
- Table 24: Germany Sports Drink Market Revenue (billion) Forecast, by Application 2020 & 2033
- Table 25: France Sports Drink Market Revenue (billion) Forecast, by Application 2020 & 2033
- Table 26: Italy Sports Drink Market Revenue (billion) Forecast, by Application 2020 & 2033
- Table 27: Spain Sports Drink Market Revenue (billion) Forecast, by Application 2020 & 2033
- Table 28: Russia Sports Drink Market Revenue (billion) Forecast, by Application 2020 & 2033
- Table 29: Benelux Sports Drink Market Revenue (billion) Forecast, by Application 2020 & 2033
- Table 30: Nordics Sports Drink Market Revenue (billion) Forecast, by Application 2020 & 2033
- Table 31: Rest of Europe Sports Drink Market Revenue (billion) Forecast, by Application 2020 & 2033
- Table 32: Global Sports Drink Market Revenue billion Forecast, by Soft Drink Type 2020 & 2033
- Table 33: Global Sports Drink Market Revenue billion Forecast, by Packaging Type 2020 & 2033
- Table 34: Global Sports Drink Market Revenue billion Forecast, by Sub Distribution Channel 2020 & 2033
- Table 35: Global Sports Drink Market Revenue billion Forecast, by Country 2020 & 2033
- Table 36: Turkey Sports Drink Market Revenue (billion) Forecast, by Application 2020 & 2033
- Table 37: Israel Sports Drink Market Revenue (billion) Forecast, by Application 2020 & 2033
- Table 38: GCC Sports Drink Market Revenue (billion) Forecast, by Application 2020 & 2033
- Table 39: North Africa Sports Drink Market Revenue (billion) Forecast, by Application 2020 & 2033
- Table 40: South Africa Sports Drink Market Revenue (billion) Forecast, by Application 2020 & 2033
- Table 41: Rest of Middle East & Africa Sports Drink Market Revenue (billion) Forecast, by Application 2020 & 2033
- Table 42: Global Sports Drink Market Revenue billion Forecast, by Soft Drink Type 2020 & 2033
- Table 43: Global Sports Drink Market Revenue billion Forecast, by Packaging Type 2020 & 2033
- Table 44: Global Sports Drink Market Revenue billion Forecast, by Sub Distribution Channel 2020 & 2033
- Table 45: Global Sports Drink Market Revenue billion Forecast, by Country 2020 & 2033
- Table 46: China Sports Drink Market Revenue (billion) Forecast, by Application 2020 & 2033
- Table 47: India Sports Drink Market Revenue (billion) Forecast, by Application 2020 & 2033
- Table 48: Japan Sports Drink Market Revenue (billion) Forecast, by Application 2020 & 2033
- Table 49: South Korea Sports Drink Market Revenue (billion) Forecast, by Application 2020 & 2033
- Table 50: ASEAN Sports Drink Market Revenue (billion) Forecast, by Application 2020 & 2033
- Table 51: Oceania Sports Drink Market Revenue (billion) Forecast, by Application 2020 & 2033
- Table 52: Rest of Asia Pacific Sports Drink Market Revenue (billion) Forecast, by Application 2020 & 2033
Frequently Asked Questions
1. What is the projected Compound Annual Growth Rate (CAGR) of the Sports Drink Market?
The projected CAGR is approximately 6.54%.
2. Which companies are prominent players in the Sports Drink Market?
Key companies in the market include Carabao Group Public Company Limited, Aje Group, Monster Beverage Corporation, PepsiCo Inc, Nongfu Spring Co Ltd, The Coca-Cola Compan, Abbott Laboratories, Suntory Holdings Limited, Seven & i Holdings Co Ltd, Keurig Dr Pepper Inc, Thai Beverages PCL, Otsuka Holdings Co Ltd, Congo Brands.
3. What are the main segments of the Sports Drink Market?
The market segments include Soft Drink Type, Packaging Type, Sub Distribution Channel.
4. Can you provide details about the market size?
The market size is estimated to be USD 37.17 billion as of 2022.
5. What are some drivers contributing to market growth?
Rising Consumer Awareness about Health and Fitness; Increasing the Use of Casein and Caseinate in Food and Beverage Industry.
6. What are the notable trends driving market growth?
OTHER KEY INDUSTRY TRENDS COVERED IN THE REPORT.
7. Are there any restraints impacting market growth?
High Competition From Alternative Protein Sources.
8. Can you provide examples of recent developments in the market?
February 2024: Pepsi Gatorade has entered into a partnership with the top tier of Saudi Arabian soccer, becoming its official sports drink partner. The collaboration is focused on enhancing the matchday experience for fans through a series of activations and events.December 2023: Spar works with US distributor Congo Brands to bring Prime drinks to stores. The move makes Spar the first symbol group in the convenience channel to stock PrimeSeptember 2023: Limca Sportz, the sports drink from Coca-Cola India's home-grown brand Limca, is thrilled to announce the launch of its new variant Limca Sportz ION4 in India.
9. What pricing options are available for accessing the report?
Pricing options include single-user, multi-user, and enterprise licenses priced at USD 3800, USD 4500, and USD 5800 respectively.
10. Is the market size provided in terms of value or volume?
The market size is provided in terms of value, measured in billion.
11. Are there any specific market keywords associated with the report?
Yes, the market keyword associated with the report is "Sports Drink Market," which aids in identifying and referencing the specific market segment covered.
12. How do I determine which pricing option suits my needs best?
The pricing options vary based on user requirements and access needs. Individual users may opt for single-user licenses, while businesses requiring broader access may choose multi-user or enterprise licenses for cost-effective access to the report.
13. Are there any additional resources or data provided in the Sports Drink Market report?
While the report offers comprehensive insights, it's advisable to review the specific contents or supplementary materials provided to ascertain if additional resources or data are available.
14. How can I stay updated on further developments or reports in the Sports Drink Market?
To stay informed about further developments, trends, and reports in the Sports Drink Market, consider subscribing to industry newsletters, following relevant companies and organizations, or regularly checking reputable industry news sources and publications.
Methodology
Step 1 - Identification of Relevant Samples Size from Population Database


Step 2 - Approaches for Defining Global Market Size (Value, Volume* & Price*)

Note*: In applicable scenarios
Step 3 - Data Sources
Primary Research
- Web Analytics
- Survey Reports
- Research Institute
- Latest Research Reports
- Opinion Leaders
Secondary Research
- Annual Reports
- White Paper
- Latest Press Release
- Industry Association
- Paid Database
- Investor Presentations

Step 4 - Data Triangulation
Involves using different sources of information in order to increase the validity of a study
These sources are likely to be stakeholders in a program - participants, other researchers, program staff, other community members, and so on.
Then we put all data in single framework & apply various statistical tools to find out the dynamic on the market.
During the analysis stage, feedback from the stakeholder groups would be compared to determine areas of agreement as well as areas of divergence