

Key Insights
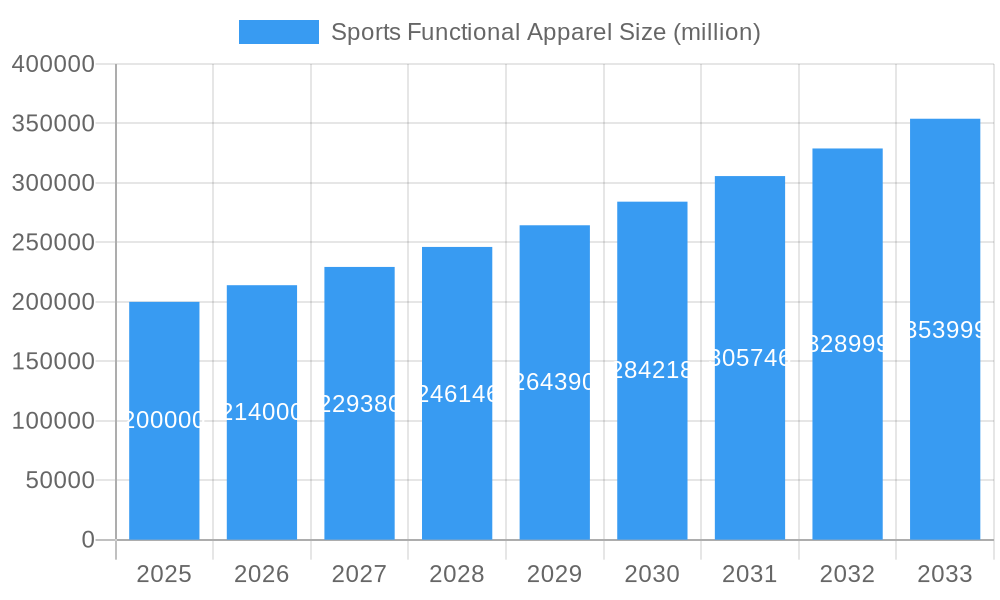
The global sports functional apparel market is experiencing robust growth, driven by increasing health consciousness, rising participation in fitness activities, and the growing popularity of athleisure. The market, estimated at $200 billion in 2025, is projected to exhibit a Compound Annual Growth Rate (CAGR) of 7% from 2025 to 2033, reaching approximately $350 billion by 2033. Key drivers include technological advancements in fabric technology (e.g., moisture-wicking, breathable materials), the increasing demand for sustainable and eco-friendly apparel, and the rise of personalized fitness tracking and data analysis integrated with apparel. Major trends include the integration of smart technology into apparel, the expansion of e-commerce channels, and the growing influence of social media marketing on consumer preferences. While challenges exist, such as fluctuating raw material prices and potential supply chain disruptions, the overall market outlook remains positive. The market segmentation shows significant potential within specific demographics and product categories, with opportunities for growth in niche markets like performance sportswear for specific sports (running, yoga, cycling) and specialized apparel for extreme sports. Leading brands like Nike, Adidas, and Under Armour are leveraging their strong brand equity and extensive distribution networks to maintain market leadership, while smaller, more agile brands are focusing on innovation and niche market penetration.
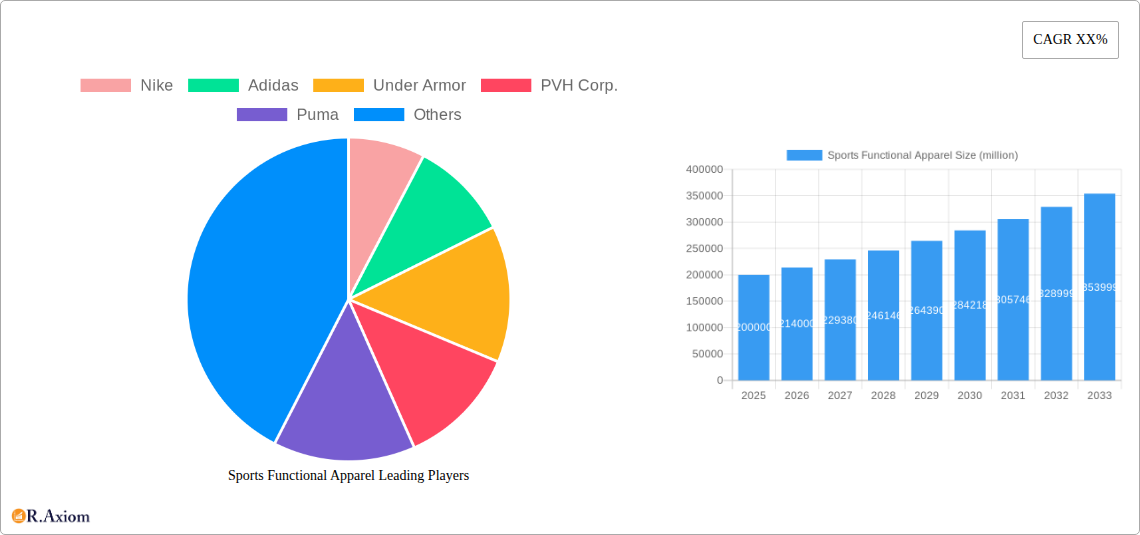
Sports Functional Apparel Market Size (In Billion)
The competitive landscape is highly dynamic, with established players facing pressure from both emerging brands and private label offerings. Geographic expansion into developing markets, particularly in Asia-Pacific, is a significant growth opportunity. Regional variations in consumer preferences and purchasing power will shape regional market dynamics, with North America and Europe remaining major markets, while Asia-Pacific is poised for substantial growth due to increasing disposable incomes and a rising middle class. Continued innovation in functional apparel technology, along with effective marketing strategies focusing on the health and performance benefits of the products, will be crucial for success in this expanding market. Sustainability and ethical sourcing are becoming increasingly important factors influencing consumer choices and will significantly influence future market developments.
Sports Functional Apparel Company Market Share
This comprehensive report provides an in-depth analysis of the global sports functional apparel market, covering the period from 2019 to 2033. Valued at $XX million in 2025, the market is poised for significant growth, driven by technological advancements, evolving consumer preferences, and expanding global athletic participation. This report offers actionable insights for industry stakeholders, including manufacturers, retailers, investors, and researchers.
Sports Functional Apparel Market Concentration & Innovation
The global sports functional apparel market is characterized by a moderately concentrated structure, with key players such as Nike, Adidas, and Under Armour holding significant market share. However, the emergence of smaller, niche brands and private label offerings is intensifying competition. Nike and Adidas, collectively, hold an estimated xx% of the global market share in 2025, showcasing their dominance. Innovation is a critical driver, with companies investing millions in research and development to create high-performance fabrics, enhance comfort, and incorporate cutting-edge technologies like smart textiles and personalized fit solutions. The market is subject to various regulatory frameworks concerning product safety and environmental sustainability, impacting manufacturing processes and material sourcing. The rise of athleisure and the growing preference for versatile apparel blur the lines between traditional sportswear and everyday wear. M&A activity remains significant, with deal values exceeding $XX million in the past five years, as larger companies consolidate market share and acquire innovative technologies. The growing trend of sustainable and ethically sourced materials is also affecting market dynamics.
- Market Share (2025): Nike (xx%), Adidas (xx%), Under Armour (xx%), Others (xx%)
- M&A Deal Value (2019-2024): $XX million
- Key Innovation Areas: Smart fabrics, personalized fit, sustainable materials
Sports Functional Apparel Industry Trends & Insights
The global sports functional apparel market is experiencing robust growth, with a projected Compound Annual Growth Rate (CAGR) of xx% during the forecast period (2025-2033). This expansion is fueled by several key factors. The rising global adoption of fitness and wellness lifestyles is a primary driver, leading to increased demand for performance-enhancing apparel. Technological advancements in fabric technology, offering improved breathability, moisture-wicking, and temperature regulation, are further boosting market growth. E-commerce is changing distribution channels, providing a broader reach to consumers globally. Consumer preferences are shifting toward sustainable and ethically produced products; however, the premium price point associated with these materials is a challenge for market penetration. The competitive landscape is dynamic, with established brands focusing on innovation and brand building while emerging players leverage e-commerce and direct-to-consumer strategies to gain market share. Market penetration is increasing in developing economies, driven by rising disposable incomes and increased awareness of fitness.
Dominant Markets & Segments in Sports Functional Apparel
North America remains the dominant market for sports functional apparel, accounting for approximately xx% of the global market in 2025, followed by Europe and Asia-Pacific. The dominance of North America is attributed to high disposable incomes, strong consumer preference for athletic wear, and the presence of major brands.
- Key Drivers in North America: Strong consumer base, established brands, high disposable income.
- Key Drivers in Europe: Growing fitness culture, increasing health consciousness, supportive government policies.
- Key Drivers in Asia-Pacific: Rising disposable incomes, expanding middle class, increasing participation in sports and fitness activities.
The running apparel segment holds the largest market share within the overall sports functional apparel market, driven by the increasing popularity of running as a fitness activity and the wide range of products catering to this segment.
Sports Functional Apparel Product Developments
Recent innovations include the development of fabrics with enhanced breathability and moisture-wicking capabilities, incorporating recycled and sustainable materials, and the integration of smart technology for performance monitoring and personalized feedback. These advancements are enhancing the performance, comfort, and overall appeal of sports functional apparel, driving market growth and creating a competitive edge for brands. The focus on personalized fit, using data-driven design and manufacturing, is another significant trend enhancing consumer satisfaction.
Report Scope & Segmentation Analysis
This report segments the sports functional apparel market based on product type (running apparel, training apparel, team sportswear, etc.), end-user (men, women, children), distribution channel (online, offline), and geography (North America, Europe, Asia-Pacific, etc.). Each segment's growth projections, market size, and competitive landscape are analyzed in detail, providing a comprehensive understanding of the market dynamics. For instance, the men's segment is projected to witness substantial growth, driven by increased participation in fitness activities among men.
Key Drivers of Sports Functional Apparel Growth
Several factors are driving the growth of the sports functional apparel market. Technological advancements in fabric technology, leading to improved performance and comfort, are a key driver. The growing global emphasis on fitness and wellness is contributing significantly to increased demand. Favorable economic conditions in several regions are boosting consumer spending on athletic apparel. Moreover, the increasing popularity of various sports and fitness activities fuels market expansion, and positive government policies promoting health and fitness are creating a supportive regulatory environment.
Challenges in the Sports Functional Apparel Sector
The sports functional apparel sector faces several challenges. Fluctuating raw material prices can significantly impact production costs. Supply chain disruptions, particularly felt post-pandemic, can lead to production delays and increased costs. Intense competition from established and emerging players exerts pressure on pricing and profit margins. Stringent environmental regulations related to manufacturing processes and material sourcing also impose constraints.
Emerging Opportunities in Sports Functional Apparel
The market presents several exciting opportunities. The growing demand for sustainable and ethically sourced materials presents a chance for brands to differentiate themselves. The integration of smart technology into apparel, enabling performance monitoring and data analysis, is a promising area. Expansion into emerging markets with growing fitness cultures, particularly in Asia and Africa, offers significant potential. The trend of personalization, offering customized apparel based on individual needs and preferences, is also creating a new growth opportunity.
Leading Players in the Sports Functional Apparel Market
- Nike
- Adidas
- Under Armour
- PVH Corp.
- Puma
- Anta
- VF Corporation
- Gap
- Columbia Sportswear
- Perry Ellis International
- Lululemon Athletica
- LiNing
- Sketchers
- Asics Corporation
- HanesBrands
- Amer Sports
- PEAK
- Ralph Lauren
- 361sport
- MIZUNO Corporation
Key Developments in Sports Functional Apparel Industry
- 2022 Q4: Nike launched a new line of sustainable running apparel.
- 2023 Q1: Adidas partnered with a textile innovation company to develop a new high-performance fabric.
- 2023 Q3: Under Armour acquired a smaller competitor specializing in smart apparel technology. (Further details on acquisitions are unavailable for this report)
Strategic Outlook for Sports Functional Apparel Market
The sports functional apparel market is poised for continued growth, driven by sustained consumer demand and technological advancements. Opportunities exist for brands to differentiate themselves through sustainable practices, personalized offerings, and innovative product development. The market's long-term potential is strong, especially with the growing global emphasis on health and wellness and the penetration of the market into previously untapped areas.
Sports Functional Apparel Segmentation
-
1. Application
- 1.1. Professional Athletic
- 1.2. Amateur Sport
-
2. Types
- 2.1. Hats
- 2.2. Upper Garment
- 2.3. Under Clothing
- 2.4. Skirts
- 2.5. Others
Sports Functional Apparel Segmentation By Geography
-
1. North America
- 1.1. United States
- 1.2. Canada
- 1.3. Mexico
-
2. South America
- 2.1. Brazil
- 2.2. Argentina
- 2.3. Rest of South America
-
3. Europe
- 3.1. United Kingdom
- 3.2. Germany
- 3.3. France
- 3.4. Italy
- 3.5. Spain
- 3.6. Russia
- 3.7. Benelux
- 3.8. Nordics
- 3.9. Rest of Europe
-
4. Middle East & Africa
- 4.1. Turkey
- 4.2. Israel
- 4.3. GCC
- 4.4. North Africa
- 4.5. South Africa
- 4.6. Rest of Middle East & Africa
-
5. Asia Pacific
- 5.1. China
- 5.2. India
- 5.3. Japan
- 5.4. South Korea
- 5.5. ASEAN
- 5.6. Oceania
- 5.7. Rest of Asia Pacific

Sports Functional Apparel Regional Market Share
Geographic Coverage of Sports Functional Apparel
Sports Functional Apparel REPORT HIGHLIGHTS
| Aspects | Details |
|---|---|
| Study Period | 2020-2034 |
| Base Year | 2025 |
| Estimated Year | 2026 |
| Forecast Period | 2026-2034 |
| Historical Period | 2020-2025 |
| Growth Rate | CAGR of XX% from 2020-2034 |
| Segmentation |
|
Table of Contents
- 1. Introduction
- 1.1. Research Scope
- 1.2. Market Segmentation
- 1.3. Research Objective
- 1.4. Definitions and Assumptions
- 2. Executive Summary
- 2.1. Market Snapshot
- 3. Market Dynamics
- 3.1. Market Drivers
- 3.2. Market Restrains
- 3.3. Market Trends
- 3.4. Market Opportunities
- 4. Market Factor Analysis
- 4.1. Porters Five Forces
- 4.1.1. Bargaining Power of Suppliers
- 4.1.2. Bargaining Power of Buyers
- 4.1.3. Threat of New Entrants
- 4.1.4. Threat of Substitutes
- 4.1.5. Competitive Rivalry
- 4.2. PESTEL analysis
- 4.3. BCG Analysis
- 4.3.1. Stars (High Growth, High Market Share)
- 4.3.2. Cash Cows (Low Growth, High Market Share)
- 4.3.3. Question Mark (High Growth, Low Market Share)
- 4.3.4. Dogs (Low Growth, Low Market Share)
- 4.4. Ansoff Matrix Analysis
- 4.5. Supply Chain Analysis
- 4.6. Regulatory Landscape
- 4.7. Current Market Potential and Opportunity Assessment (TAM–SAM–SOM Framework)
- 4.8. RAX Analyst Note
- 4.1. Porters Five Forces
- 5. Market Analysis, Insights and Forecast 2021-2033
- 5.1. Market Analysis, Insights and Forecast - by Application
- 5.1.1. Professional Athletic
- 5.1.2. Amateur Sport
- 5.2. Market Analysis, Insights and Forecast - by Types
- 5.2.1. Hats
- 5.2.2. Upper Garment
- 5.2.3. Under Clothing
- 5.2.4. Skirts
- 5.2.5. Others
- 5.3. Market Analysis, Insights and Forecast - by Region
- 5.3.1. North America
- 5.3.2. South America
- 5.3.3. Europe
- 5.3.4. Middle East & Africa
- 5.3.5. Asia Pacific
- 5.1. Market Analysis, Insights and Forecast - by Application
- 6. Global Sports Functional Apparel Analysis, Insights and Forecast, 2021-2033
- 6.1. Market Analysis, Insights and Forecast - by Application
- 6.1.1. Professional Athletic
- 6.1.2. Amateur Sport
- 6.2. Market Analysis, Insights and Forecast - by Types
- 6.2.1. Hats
- 6.2.2. Upper Garment
- 6.2.3. Under Clothing
- 6.2.4. Skirts
- 6.2.5. Others
- 6.1. Market Analysis, Insights and Forecast - by Application
- 7. North America Sports Functional Apparel Analysis, Insights and Forecast, 2020-2032
- 7.1. Market Analysis, Insights and Forecast - by Application
- 7.1.1. Professional Athletic
- 7.1.2. Amateur Sport
- 7.2. Market Analysis, Insights and Forecast - by Types
- 7.2.1. Hats
- 7.2.2. Upper Garment
- 7.2.3. Under Clothing
- 7.2.4. Skirts
- 7.2.5. Others
- 7.1. Market Analysis, Insights and Forecast - by Application
- 8. South America Sports Functional Apparel Analysis, Insights and Forecast, 2020-2032
- 8.1. Market Analysis, Insights and Forecast - by Application
- 8.1.1. Professional Athletic
- 8.1.2. Amateur Sport
- 8.2. Market Analysis, Insights and Forecast - by Types
- 8.2.1. Hats
- 8.2.2. Upper Garment
- 8.2.3. Under Clothing
- 8.2.4. Skirts
- 8.2.5. Others
- 8.1. Market Analysis, Insights and Forecast - by Application
- 9. Europe Sports Functional Apparel Analysis, Insights and Forecast, 2020-2032
- 9.1. Market Analysis, Insights and Forecast - by Application
- 9.1.1. Professional Athletic
- 9.1.2. Amateur Sport
- 9.2. Market Analysis, Insights and Forecast - by Types
- 9.2.1. Hats
- 9.2.2. Upper Garment
- 9.2.3. Under Clothing
- 9.2.4. Skirts
- 9.2.5. Others
- 9.1. Market Analysis, Insights and Forecast - by Application
- 10. Middle East & Africa Sports Functional Apparel Analysis, Insights and Forecast, 2020-2032
- 10.1. Market Analysis, Insights and Forecast - by Application
- 10.1.1. Professional Athletic
- 10.1.2. Amateur Sport
- 10.2. Market Analysis, Insights and Forecast - by Types
- 10.2.1. Hats
- 10.2.2. Upper Garment
- 10.2.3. Under Clothing
- 10.2.4. Skirts
- 10.2.5. Others
- 10.1. Market Analysis, Insights and Forecast - by Application
- 11. Asia Pacific Sports Functional Apparel Analysis, Insights and Forecast, 2020-2032
- 11.1. Market Analysis, Insights and Forecast - by Application
- 11.1.1. Professional Athletic
- 11.1.2. Amateur Sport
- 11.2. Market Analysis, Insights and Forecast - by Types
- 11.2.1. Hats
- 11.2.2. Upper Garment
- 11.2.3. Under Clothing
- 11.2.4. Skirts
- 11.2.5. Others
- 11.1. Market Analysis, Insights and Forecast - by Application
- 12. Competitive Analysis
- 12.1. Company Profiles
- 12.1.1 Nike
- 12.1.1.1. Company Overview
- 12.1.1.2. Products
- 12.1.1.3. Company Financials
- 12.1.1.4. SWOT Analysis
- 12.1.2 Adidas
- 12.1.2.1. Company Overview
- 12.1.2.2. Products
- 12.1.2.3. Company Financials
- 12.1.2.4. SWOT Analysis
- 12.1.3 Under Armor
- 12.1.3.1. Company Overview
- 12.1.3.2. Products
- 12.1.3.3. Company Financials
- 12.1.3.4. SWOT Analysis
- 12.1.4 PVH Corp.
- 12.1.4.1. Company Overview
- 12.1.4.2. Products
- 12.1.4.3. Company Financials
- 12.1.4.4. SWOT Analysis
- 12.1.5 Puma
- 12.1.5.1. Company Overview
- 12.1.5.2. Products
- 12.1.5.3. Company Financials
- 12.1.5.4. SWOT Analysis
- 12.1.6 Anta
- 12.1.6.1. Company Overview
- 12.1.6.2. Products
- 12.1.6.3. Company Financials
- 12.1.6.4. SWOT Analysis
- 12.1.7 VF Corporation
- 12.1.7.1. Company Overview
- 12.1.7.2. Products
- 12.1.7.3. Company Financials
- 12.1.7.4. SWOT Analysis
- 12.1.8 Gap
- 12.1.8.1. Company Overview
- 12.1.8.2. Products
- 12.1.8.3. Company Financials
- 12.1.8.4. SWOT Analysis
- 12.1.9 Columbia Sportswear
- 12.1.9.1. Company Overview
- 12.1.9.2. Products
- 12.1.9.3. Company Financials
- 12.1.9.4. SWOT Analysis
- 12.1.10 Perry Ellis International
- 12.1.10.1. Company Overview
- 12.1.10.2. Products
- 12.1.10.3. Company Financials
- 12.1.10.4. SWOT Analysis
- 12.1.11 Lululemon Athletica
- 12.1.11.1. Company Overview
- 12.1.11.2. Products
- 12.1.11.3. Company Financials
- 12.1.11.4. SWOT Analysis
- 12.1.12 LiNing
- 12.1.12.1. Company Overview
- 12.1.12.2. Products
- 12.1.12.3. Company Financials
- 12.1.12.4. SWOT Analysis
- 12.1.13 Sketchers
- 12.1.13.1. Company Overview
- 12.1.13.2. Products
- 12.1.13.3. Company Financials
- 12.1.13.4. SWOT Analysis
- 12.1.14 Asics Corporation
- 12.1.14.1. Company Overview
- 12.1.14.2. Products
- 12.1.14.3. Company Financials
- 12.1.14.4. SWOT Analysis
- 12.1.15 HanesBrands
- 12.1.15.1. Company Overview
- 12.1.15.2. Products
- 12.1.15.3. Company Financials
- 12.1.15.4. SWOT Analysis
- 12.1.16 Amer Sports
- 12.1.16.1. Company Overview
- 12.1.16.2. Products
- 12.1.16.3. Company Financials
- 12.1.16.4. SWOT Analysis
- 12.1.17 PEAK
- 12.1.17.1. Company Overview
- 12.1.17.2. Products
- 12.1.17.3. Company Financials
- 12.1.17.4. SWOT Analysis
- 12.1.18 Ralph Lauren
- 12.1.18.1. Company Overview
- 12.1.18.2. Products
- 12.1.18.3. Company Financials
- 12.1.18.4. SWOT Analysis
- 12.1.19 361sport
- 12.1.19.1. Company Overview
- 12.1.19.2. Products
- 12.1.19.3. Company Financials
- 12.1.19.4. SWOT Analysis
- 12.1.20 MIZUNO Corporation
- 12.1.20.1. Company Overview
- 12.1.20.2. Products
- 12.1.20.3. Company Financials
- 12.1.20.4. SWOT Analysis
- 12.1.1 Nike
- 12.2. Market Entropy
- 12.2.1 Company's Key Areas Served
- 12.2.2 Recent Developments
- 12.3. Company Market Share Analysis 2025
- 12.3.1 Top 5 Companies Market Share Analysis
- 12.3.2 Top 3 Companies Market Share Analysis
- 12.4. List of Potential Customers
- 13. Research Methodology
List of Figures
- Figure 1: Global Sports Functional Apparel Revenue Breakdown (million, %) by Region 2025 & 2033
- Figure 2: Global Sports Functional Apparel Volume Breakdown (K, %) by Region 2025 & 2033
- Figure 3: North America Sports Functional Apparel Revenue (million), by Application 2025 & 2033
- Figure 4: North America Sports Functional Apparel Volume (K), by Application 2025 & 2033
- Figure 5: North America Sports Functional Apparel Revenue Share (%), by Application 2025 & 2033
- Figure 6: North America Sports Functional Apparel Volume Share (%), by Application 2025 & 2033
- Figure 7: North America Sports Functional Apparel Revenue (million), by Types 2025 & 2033
- Figure 8: North America Sports Functional Apparel Volume (K), by Types 2025 & 2033
- Figure 9: North America Sports Functional Apparel Revenue Share (%), by Types 2025 & 2033
- Figure 10: North America Sports Functional Apparel Volume Share (%), by Types 2025 & 2033
- Figure 11: North America Sports Functional Apparel Revenue (million), by Country 2025 & 2033
- Figure 12: North America Sports Functional Apparel Volume (K), by Country 2025 & 2033
- Figure 13: North America Sports Functional Apparel Revenue Share (%), by Country 2025 & 2033
- Figure 14: North America Sports Functional Apparel Volume Share (%), by Country 2025 & 2033
- Figure 15: South America Sports Functional Apparel Revenue (million), by Application 2025 & 2033
- Figure 16: South America Sports Functional Apparel Volume (K), by Application 2025 & 2033
- Figure 17: South America Sports Functional Apparel Revenue Share (%), by Application 2025 & 2033
- Figure 18: South America Sports Functional Apparel Volume Share (%), by Application 2025 & 2033
- Figure 19: South America Sports Functional Apparel Revenue (million), by Types 2025 & 2033
- Figure 20: South America Sports Functional Apparel Volume (K), by Types 2025 & 2033
- Figure 21: South America Sports Functional Apparel Revenue Share (%), by Types 2025 & 2033
- Figure 22: South America Sports Functional Apparel Volume Share (%), by Types 2025 & 2033
- Figure 23: South America Sports Functional Apparel Revenue (million), by Country 2025 & 2033
- Figure 24: South America Sports Functional Apparel Volume (K), by Country 2025 & 2033
- Figure 25: South America Sports Functional Apparel Revenue Share (%), by Country 2025 & 2033
- Figure 26: South America Sports Functional Apparel Volume Share (%), by Country 2025 & 2033
- Figure 27: Europe Sports Functional Apparel Revenue (million), by Application 2025 & 2033
- Figure 28: Europe Sports Functional Apparel Volume (K), by Application 2025 & 2033
- Figure 29: Europe Sports Functional Apparel Revenue Share (%), by Application 2025 & 2033
- Figure 30: Europe Sports Functional Apparel Volume Share (%), by Application 2025 & 2033
- Figure 31: Europe Sports Functional Apparel Revenue (million), by Types 2025 & 2033
- Figure 32: Europe Sports Functional Apparel Volume (K), by Types 2025 & 2033
- Figure 33: Europe Sports Functional Apparel Revenue Share (%), by Types 2025 & 2033
- Figure 34: Europe Sports Functional Apparel Volume Share (%), by Types 2025 & 2033
- Figure 35: Europe Sports Functional Apparel Revenue (million), by Country 2025 & 2033
- Figure 36: Europe Sports Functional Apparel Volume (K), by Country 2025 & 2033
- Figure 37: Europe Sports Functional Apparel Revenue Share (%), by Country 2025 & 2033
- Figure 38: Europe Sports Functional Apparel Volume Share (%), by Country 2025 & 2033
- Figure 39: Middle East & Africa Sports Functional Apparel Revenue (million), by Application 2025 & 2033
- Figure 40: Middle East & Africa Sports Functional Apparel Volume (K), by Application 2025 & 2033
- Figure 41: Middle East & Africa Sports Functional Apparel Revenue Share (%), by Application 2025 & 2033
- Figure 42: Middle East & Africa Sports Functional Apparel Volume Share (%), by Application 2025 & 2033
- Figure 43: Middle East & Africa Sports Functional Apparel Revenue (million), by Types 2025 & 2033
- Figure 44: Middle East & Africa Sports Functional Apparel Volume (K), by Types 2025 & 2033
- Figure 45: Middle East & Africa Sports Functional Apparel Revenue Share (%), by Types 2025 & 2033
- Figure 46: Middle East & Africa Sports Functional Apparel Volume Share (%), by Types 2025 & 2033
- Figure 47: Middle East & Africa Sports Functional Apparel Revenue (million), by Country 2025 & 2033
- Figure 48: Middle East & Africa Sports Functional Apparel Volume (K), by Country 2025 & 2033
- Figure 49: Middle East & Africa Sports Functional Apparel Revenue Share (%), by Country 2025 & 2033
- Figure 50: Middle East & Africa Sports Functional Apparel Volume Share (%), by Country 2025 & 2033
- Figure 51: Asia Pacific Sports Functional Apparel Revenue (million), by Application 2025 & 2033
- Figure 52: Asia Pacific Sports Functional Apparel Volume (K), by Application 2025 & 2033
- Figure 53: Asia Pacific Sports Functional Apparel Revenue Share (%), by Application 2025 & 2033
- Figure 54: Asia Pacific Sports Functional Apparel Volume Share (%), by Application 2025 & 2033
- Figure 55: Asia Pacific Sports Functional Apparel Revenue (million), by Types 2025 & 2033
- Figure 56: Asia Pacific Sports Functional Apparel Volume (K), by Types 2025 & 2033
- Figure 57: Asia Pacific Sports Functional Apparel Revenue Share (%), by Types 2025 & 2033
- Figure 58: Asia Pacific Sports Functional Apparel Volume Share (%), by Types 2025 & 2033
- Figure 59: Asia Pacific Sports Functional Apparel Revenue (million), by Country 2025 & 2033
- Figure 60: Asia Pacific Sports Functional Apparel Volume (K), by Country 2025 & 2033
- Figure 61: Asia Pacific Sports Functional Apparel Revenue Share (%), by Country 2025 & 2033
- Figure 62: Asia Pacific Sports Functional Apparel Volume Share (%), by Country 2025 & 2033
List of Tables
- Table 1: Global Sports Functional Apparel Revenue million Forecast, by Application 2020 & 2033
- Table 2: Global Sports Functional Apparel Volume K Forecast, by Application 2020 & 2033
- Table 3: Global Sports Functional Apparel Revenue million Forecast, by Types 2020 & 2033
- Table 4: Global Sports Functional Apparel Volume K Forecast, by Types 2020 & 2033
- Table 5: Global Sports Functional Apparel Revenue million Forecast, by Region 2020 & 2033
- Table 6: Global Sports Functional Apparel Volume K Forecast, by Region 2020 & 2033
- Table 7: Global Sports Functional Apparel Revenue million Forecast, by Application 2020 & 2033
- Table 8: Global Sports Functional Apparel Volume K Forecast, by Application 2020 & 2033
- Table 9: Global Sports Functional Apparel Revenue million Forecast, by Types 2020 & 2033
- Table 10: Global Sports Functional Apparel Volume K Forecast, by Types 2020 & 2033
- Table 11: Global Sports Functional Apparel Revenue million Forecast, by Country 2020 & 2033
- Table 12: Global Sports Functional Apparel Volume K Forecast, by Country 2020 & 2033
- Table 13: United States Sports Functional Apparel Revenue (million) Forecast, by Application 2020 & 2033
- Table 14: United States Sports Functional Apparel Volume (K) Forecast, by Application 2020 & 2033
- Table 15: Canada Sports Functional Apparel Revenue (million) Forecast, by Application 2020 & 2033
- Table 16: Canada Sports Functional Apparel Volume (K) Forecast, by Application 2020 & 2033
- Table 17: Mexico Sports Functional Apparel Revenue (million) Forecast, by Application 2020 & 2033
- Table 18: Mexico Sports Functional Apparel Volume (K) Forecast, by Application 2020 & 2033
- Table 19: Global Sports Functional Apparel Revenue million Forecast, by Application 2020 & 2033
- Table 20: Global Sports Functional Apparel Volume K Forecast, by Application 2020 & 2033
- Table 21: Global Sports Functional Apparel Revenue million Forecast, by Types 2020 & 2033
- Table 22: Global Sports Functional Apparel Volume K Forecast, by Types 2020 & 2033
- Table 23: Global Sports Functional Apparel Revenue million Forecast, by Country 2020 & 2033
- Table 24: Global Sports Functional Apparel Volume K Forecast, by Country 2020 & 2033
- Table 25: Brazil Sports Functional Apparel Revenue (million) Forecast, by Application 2020 & 2033
- Table 26: Brazil Sports Functional Apparel Volume (K) Forecast, by Application 2020 & 2033
- Table 27: Argentina Sports Functional Apparel Revenue (million) Forecast, by Application 2020 & 2033
- Table 28: Argentina Sports Functional Apparel Volume (K) Forecast, by Application 2020 & 2033
- Table 29: Rest of South America Sports Functional Apparel Revenue (million) Forecast, by Application 2020 & 2033
- Table 30: Rest of South America Sports Functional Apparel Volume (K) Forecast, by Application 2020 & 2033
- Table 31: Global Sports Functional Apparel Revenue million Forecast, by Application 2020 & 2033
- Table 32: Global Sports Functional Apparel Volume K Forecast, by Application 2020 & 2033
- Table 33: Global Sports Functional Apparel Revenue million Forecast, by Types 2020 & 2033
- Table 34: Global Sports Functional Apparel Volume K Forecast, by Types 2020 & 2033
- Table 35: Global Sports Functional Apparel Revenue million Forecast, by Country 2020 & 2033
- Table 36: Global Sports Functional Apparel Volume K Forecast, by Country 2020 & 2033
- Table 37: United Kingdom Sports Functional Apparel Revenue (million) Forecast, by Application 2020 & 2033
- Table 38: United Kingdom Sports Functional Apparel Volume (K) Forecast, by Application 2020 & 2033
- Table 39: Germany Sports Functional Apparel Revenue (million) Forecast, by Application 2020 & 2033
- Table 40: Germany Sports Functional Apparel Volume (K) Forecast, by Application 2020 & 2033
- Table 41: France Sports Functional Apparel Revenue (million) Forecast, by Application 2020 & 2033
- Table 42: France Sports Functional Apparel Volume (K) Forecast, by Application 2020 & 2033
- Table 43: Italy Sports Functional Apparel Revenue (million) Forecast, by Application 2020 & 2033
- Table 44: Italy Sports Functional Apparel Volume (K) Forecast, by Application 2020 & 2033
- Table 45: Spain Sports Functional Apparel Revenue (million) Forecast, by Application 2020 & 2033
- Table 46: Spain Sports Functional Apparel Volume (K) Forecast, by Application 2020 & 2033
- Table 47: Russia Sports Functional Apparel Revenue (million) Forecast, by Application 2020 & 2033
- Table 48: Russia Sports Functional Apparel Volume (K) Forecast, by Application 2020 & 2033
- Table 49: Benelux Sports Functional Apparel Revenue (million) Forecast, by Application 2020 & 2033
- Table 50: Benelux Sports Functional Apparel Volume (K) Forecast, by Application 2020 & 2033
- Table 51: Nordics Sports Functional Apparel Revenue (million) Forecast, by Application 2020 & 2033
- Table 52: Nordics Sports Functional Apparel Volume (K) Forecast, by Application 2020 & 2033
- Table 53: Rest of Europe Sports Functional Apparel Revenue (million) Forecast, by Application 2020 & 2033
- Table 54: Rest of Europe Sports Functional Apparel Volume (K) Forecast, by Application 2020 & 2033
- Table 55: Global Sports Functional Apparel Revenue million Forecast, by Application 2020 & 2033
- Table 56: Global Sports Functional Apparel Volume K Forecast, by Application 2020 & 2033
- Table 57: Global Sports Functional Apparel Revenue million Forecast, by Types 2020 & 2033
- Table 58: Global Sports Functional Apparel Volume K Forecast, by Types 2020 & 2033
- Table 59: Global Sports Functional Apparel Revenue million Forecast, by Country 2020 & 2033
- Table 60: Global Sports Functional Apparel Volume K Forecast, by Country 2020 & 2033
- Table 61: Turkey Sports Functional Apparel Revenue (million) Forecast, by Application 2020 & 2033
- Table 62: Turkey Sports Functional Apparel Volume (K) Forecast, by Application 2020 & 2033
- Table 63: Israel Sports Functional Apparel Revenue (million) Forecast, by Application 2020 & 2033
- Table 64: Israel Sports Functional Apparel Volume (K) Forecast, by Application 2020 & 2033
- Table 65: GCC Sports Functional Apparel Revenue (million) Forecast, by Application 2020 & 2033
- Table 66: GCC Sports Functional Apparel Volume (K) Forecast, by Application 2020 & 2033
- Table 67: North Africa Sports Functional Apparel Revenue (million) Forecast, by Application 2020 & 2033
- Table 68: North Africa Sports Functional Apparel Volume (K) Forecast, by Application 2020 & 2033
- Table 69: South Africa Sports Functional Apparel Revenue (million) Forecast, by Application 2020 & 2033
- Table 70: South Africa Sports Functional Apparel Volume (K) Forecast, by Application 2020 & 2033
- Table 71: Rest of Middle East & Africa Sports Functional Apparel Revenue (million) Forecast, by Application 2020 & 2033
- Table 72: Rest of Middle East & Africa Sports Functional Apparel Volume (K) Forecast, by Application 2020 & 2033
- Table 73: Global Sports Functional Apparel Revenue million Forecast, by Application 2020 & 2033
- Table 74: Global Sports Functional Apparel Volume K Forecast, by Application 2020 & 2033
- Table 75: Global Sports Functional Apparel Revenue million Forecast, by Types 2020 & 2033
- Table 76: Global Sports Functional Apparel Volume K Forecast, by Types 2020 & 2033
- Table 77: Global Sports Functional Apparel Revenue million Forecast, by Country 2020 & 2033
- Table 78: Global Sports Functional Apparel Volume K Forecast, by Country 2020 & 2033
- Table 79: China Sports Functional Apparel Revenue (million) Forecast, by Application 2020 & 2033
- Table 80: China Sports Functional Apparel Volume (K) Forecast, by Application 2020 & 2033
- Table 81: India Sports Functional Apparel Revenue (million) Forecast, by Application 2020 & 2033
- Table 82: India Sports Functional Apparel Volume (K) Forecast, by Application 2020 & 2033
- Table 83: Japan Sports Functional Apparel Revenue (million) Forecast, by Application 2020 & 2033
- Table 84: Japan Sports Functional Apparel Volume (K) Forecast, by Application 2020 & 2033
- Table 85: South Korea Sports Functional Apparel Revenue (million) Forecast, by Application 2020 & 2033
- Table 86: South Korea Sports Functional Apparel Volume (K) Forecast, by Application 2020 & 2033
- Table 87: ASEAN Sports Functional Apparel Revenue (million) Forecast, by Application 2020 & 2033
- Table 88: ASEAN Sports Functional Apparel Volume (K) Forecast, by Application 2020 & 2033
- Table 89: Oceania Sports Functional Apparel Revenue (million) Forecast, by Application 2020 & 2033
- Table 90: Oceania Sports Functional Apparel Volume (K) Forecast, by Application 2020 & 2033
- Table 91: Rest of Asia Pacific Sports Functional Apparel Revenue (million) Forecast, by Application 2020 & 2033
- Table 92: Rest of Asia Pacific Sports Functional Apparel Volume (K) Forecast, by Application 2020 & 2033
Frequently Asked Questions
1. What is the projected Compound Annual Growth Rate (CAGR) of the Sports Functional Apparel?
The projected CAGR is approximately XX%.
2. Which companies are prominent players in the Sports Functional Apparel?
Key companies in the market include Nike, Adidas, Under Armor, PVH Corp., Puma, Anta, VF Corporation, Gap, Columbia Sportswear, Perry Ellis International, Lululemon Athletica, LiNing, Sketchers, Asics Corporation, HanesBrands, Amer Sports, PEAK, Ralph Lauren, 361sport, MIZUNO Corporation.
3. What are the main segments of the Sports Functional Apparel?
The market segments include Application, Types.
4. Can you provide details about the market size?
The market size is estimated to be USD XXX million as of 2022.
5. What are some drivers contributing to market growth?
N/A
6. What are the notable trends driving market growth?
N/A
7. Are there any restraints impacting market growth?
N/A
8. Can you provide examples of recent developments in the market?
N/A
9. What pricing options are available for accessing the report?
Pricing options include single-user, multi-user, and enterprise licenses priced at USD 3350.00, USD 5025.00, and USD 6700.00 respectively.
10. Is the market size provided in terms of value or volume?
The market size is provided in terms of value, measured in million and volume, measured in K.
11. Are there any specific market keywords associated with the report?
Yes, the market keyword associated with the report is "Sports Functional Apparel," which aids in identifying and referencing the specific market segment covered.
12. How do I determine which pricing option suits my needs best?
The pricing options vary based on user requirements and access needs. Individual users may opt for single-user licenses, while businesses requiring broader access may choose multi-user or enterprise licenses for cost-effective access to the report.
13. Are there any additional resources or data provided in the Sports Functional Apparel report?
While the report offers comprehensive insights, it's advisable to review the specific contents or supplementary materials provided to ascertain if additional resources or data are available.
14. How can I stay updated on further developments or reports in the Sports Functional Apparel?
To stay informed about further developments, trends, and reports in the Sports Functional Apparel, consider subscribing to industry newsletters, following relevant companies and organizations, or regularly checking reputable industry news sources and publications.
Methodology
Step 1 - Identification of Relevant Samples Size from Population Database


Step 2 - Approaches for Defining Global Market Size (Value, Volume* & Price*)

Note*: In applicable scenarios
Step 3 - Data Sources
Primary Research
- Web Analytics
- Survey Reports
- Research Institute
- Latest Research Reports
- Opinion Leaders
Secondary Research
- Annual Reports
- White Paper
- Latest Press Release
- Industry Association
- Paid Database
- Investor Presentations

Step 4 - Data Triangulation
Involves using different sources of information in order to increase the validity of a study
These sources are likely to be stakeholders in a program - participants, other researchers, program staff, other community members, and so on.
Then we put all data in single framework & apply various statistical tools to find out the dynamic on the market.
During the analysis stage, feedback from the stakeholder groups would be compared to determine areas of agreement as well as areas of divergence