

Key Insights
The global sports shoes market is a dynamic and expansive sector, projected to experience robust growth throughout the forecast period (2025-2033). While precise figures for market size and CAGR are unavailable, a reasonable estimation, considering the presence of major players like Nike, Adidas, and Under Armour, and the consistent popularity of athletic footwear, suggests a market size exceeding $100 billion in 2025. Growth is driven by several factors, including the increasing global participation in sports and fitness activities, rising disposable incomes in developing economies fueling demand for branded athletic footwear, and ongoing technological advancements leading to the creation of more comfortable, performance-enhancing shoes. Key trends include the rising popularity of specialized footwear for niche sports (e.g., running, basketball, training), the increasing adoption of sustainable and ethically sourced materials in manufacturing, and the growing influence of e-commerce on distribution channels. However, challenges remain, including fluctuating raw material costs, economic uncertainties impacting consumer spending, and intense competition among established and emerging brands.
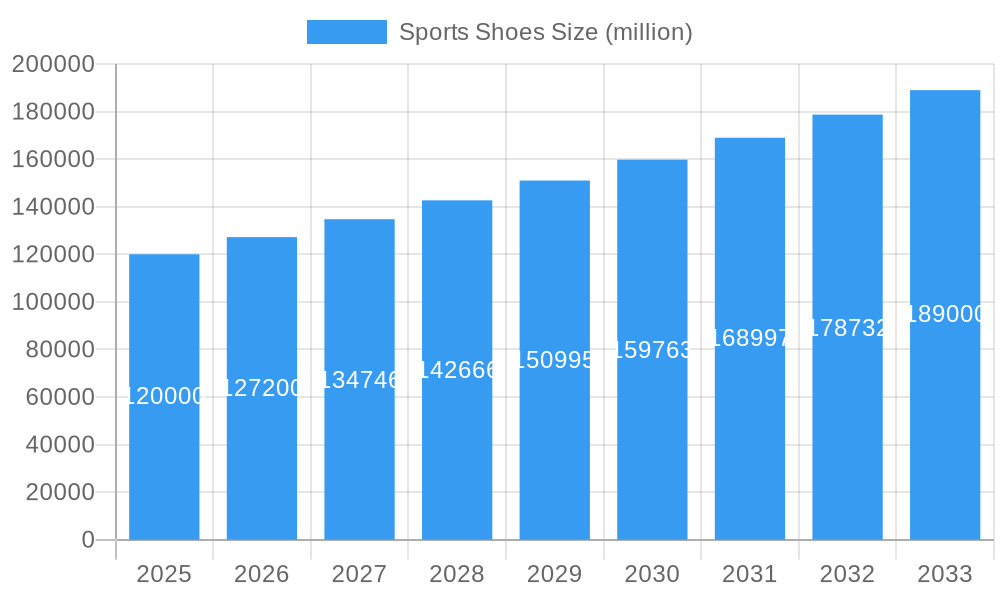
Sports Shoes Market Size (In Billion)
Market segmentation is crucial in understanding the nuances of the sports shoe landscape. Categories like running shoes, basketball shoes, training shoes, and casual athletic shoes each represent significant sub-markets with unique growth trajectories. Geographical segmentation reveals regional variations in consumer preferences and market maturity. North America and Europe are currently major markets, but Asia-Pacific is expected to witness significant growth driven by increasing urbanization and a rising middle class. Competitive analysis highlights the ongoing rivalry among major players like Nike and Adidas, along with the increasing presence of emerging brands particularly in Asia-Pacific. Strategic initiatives like collaborations, product innovation, and targeted marketing campaigns are vital for brands to navigate the competitive landscape and capture market share. The forecast period will likely see continued consolidation, innovation, and a growing emphasis on sustainability and technological advancements within the industry.
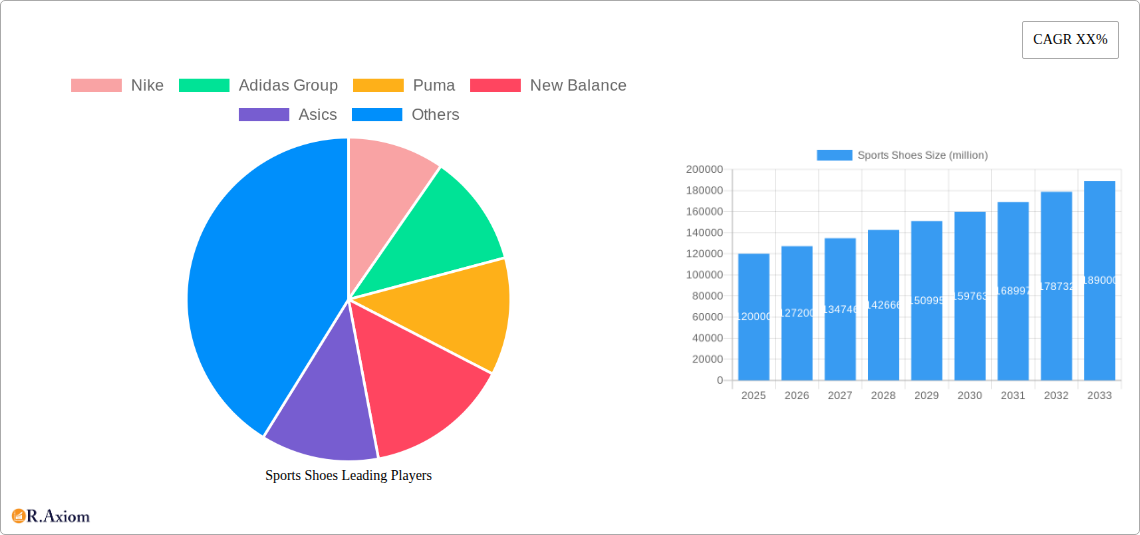
Sports Shoes Company Market Share
This comprehensive report provides a detailed analysis of the global sports shoes market, offering invaluable insights for industry stakeholders, investors, and businesses seeking to navigate this dynamic landscape. The report covers the period from 2019 to 2033, with a base year of 2025 and a forecast period of 2025-2033. The market is valued at $xx million in 2025 and is projected to reach $xx million by 2033, exhibiting a CAGR of xx%. This in-depth study explores market concentration, innovation, trends, dominant segments, and key players, providing actionable insights to drive strategic decision-making.
Sports Shoes Market Concentration & Innovation
The global sports shoes market is characterized by a moderately concentrated landscape, dominated by established players like Nike, Adidas Group, and Puma. These giants collectively hold approximately xx% of the global market share in 2025, benefiting from extensive brand recognition, strong distribution networks, and continuous innovation. However, smaller players like New Balance, Asics, and Under Armour are also making significant inroads, particularly through niche product offerings and targeted marketing strategies.
Market Share (2025):
- Nike: xx%
- Adidas Group: xx%
- Puma: xx%
- Others: xx%
Innovation is a key driver in the sports shoes market, with companies constantly striving to enhance performance, comfort, and style. This is evidenced by advancements in material science (e.g., lightweight, breathable fabrics), design (e.g., ergonomic soles, personalized fitting), and manufacturing techniques (e.g., 3D printing, sustainable production). Regulatory frameworks related to material safety and labor practices are also influencing innovation. Substitutes include casual sneakers and other athletic footwear, while end-user trends towards athleisure and sustainable products impact market dynamics. M&A activities, while not as frequent as in other sectors, play a role in consolidating market share and introducing new technologies. Recent M&A deals totaled approximately $xx million in the past five years, with a focus on smaller brands specializing in innovation and sustainable manufacturing.
Sports Shoes Industry Trends & Insights
The global sports shoes market is experiencing robust growth, driven by several factors. Rising disposable incomes in developing economies, coupled with increasing health consciousness and participation in sports and fitness activities are key growth drivers. The athleisure trend, blurring the lines between athletic and casual wear, has significantly expanded the market, leading to increased demand for versatile and stylish sports shoes. Technological advancements such as personalized fit technologies, smart shoe integration, and sustainable material use are further driving market expansion. The market penetration of technologically advanced shoes is growing at a CAGR of xx% during the forecast period. Competitive dynamics are intense, with major players focusing on brand building, product diversification, and strategic partnerships to maintain a competitive edge.
Dominant Markets & Segments in Sports Shoes
North America currently holds the largest share of the global sports shoes market, primarily due to high consumer spending, strong brand loyalty, and widespread adoption of fitness and sports activities. The region's established distribution channels and extensive marketing campaigns also contribute to its dominance.
Key Drivers of North American Dominance:
- High disposable incomes
- Strong brand presence
- Developed retail infrastructure
- Proactive government support for sporting activities
However, the Asia-Pacific region is projected to exhibit the highest CAGR during the forecast period, driven by rapidly rising disposable incomes, increasing urbanization, and a growing middle class with a greater interest in fitness and sports. Similarly, Europe and other regions are expected to see healthy growth, though at a slightly slower pace. Specific country-level analyses further reveal that the US, China, and Germany are among the top performing markets.
Sports Shoes Product Developments
Recent innovations in sports shoes focus on enhanced performance features such as improved cushioning, enhanced stability, and increased breathability through the use of advanced materials like graphene-infused foams and recycled materials. The integration of smart technology, including sensors and GPS trackers, adds to the appeal of many products, providing users with real-time performance data. Furthermore, manufacturers are prioritizing sustainable manufacturing processes and eco-friendly materials to address environmental concerns, creating a competitive advantage in a growing market segment.
Report Scope & Segmentation Analysis
This report provides a comprehensive segmentation of the sports shoes market based on product type (running shoes, basketball shoes, training shoes, etc.), price range (budget, mid-range, premium), distribution channel (online, offline), and geography (North America, Europe, Asia-Pacific, etc.). Each segment's market size, growth projections, and competitive dynamics are detailed, offering granular insights into market trends and opportunities. For instance, the running shoe segment is projected to show substantial growth driven by an increase in marathon participation, while the online distribution channel is witnessing rapid expansion due to increased e-commerce adoption.
Key Drivers of Sports Shoes Growth
The global sports shoes market is fuelled by several key factors. The rising popularity of fitness activities and sports participation globally is a significant driver, alongside increased disposable incomes, particularly in developing economies. Government initiatives promoting sports and health awareness, coupled with technological advancements in shoe design and manufacturing, are also contributing to market expansion. Finally, the growing trend of athleisure, increasing demand for stylish and functional footwear, further fuels this market.
Challenges in the Sports Shoes Sector
The sports shoes sector faces several challenges. Supply chain disruptions, including raw material shortages and logistical hurdles, can impact production and delivery. Intense competition from established and emerging players necessitates continuous innovation and marketing efforts. Furthermore, stringent environmental regulations related to manufacturing processes and material sourcing pose a challenge, requiring companies to adopt sustainable practices. These factors can affect profitability and market share.
Emerging Opportunities in Sports Shoes
Several emerging opportunities exist within the sports shoes market. The increasing demand for personalized and customized footwear, leveraging technology like 3D printing and data analytics, offers significant potential. The growing focus on sustainable and ethically sourced materials provides a significant opportunity to gain a competitive edge. Expansion into untapped markets, particularly in developing countries, presents further avenues for growth. Finally, the integration of wearable technology into sports shoes is an increasingly attractive market.
Leading Players in the Sports Shoes Market
- Nike
- Adidas Group
- Puma
- New Balance
- Asics
- Sketcher
- K-Swiss
- MIZUNO
- KAPPA
- Merrell
- Vibram
- LI-NING
- ANTA
- XTEP
- 361°
- PEAK
- Under Armour
- BasicNet
Key Developments in Sports Shoes Industry
- 2022 Q4: Nike launched its new line of sustainable running shoes using recycled materials.
- 2023 Q1: Adidas Group partnered with a tech company to integrate smart sensors into their new basketball shoe line.
- 2023 Q2: Puma acquired a smaller company specializing in 3D-printed shoe technology.
- 2024 Q3: New Balance introduced a highly personalized shoe fitting system.
(Further key developments can be added based on actual data.)
Strategic Outlook for Sports Shoes Market
The future of the sports shoes market looks promising, driven by continued growth in health consciousness, technological innovation, and the expansion of the athleisure market. Companies that successfully integrate sustainable practices, personalized technology, and innovative design will be best positioned to capture market share and drive future growth. The demand for high-performance and stylish footwear will remain strong, creating lucrative opportunities for businesses that cater to evolving consumer preferences.
Sports Shoes Segmentation
-
1. Application
- 1.1. Men
- 1.2. Women
- 1.3. Children
-
2. Types
- 2.1. Athleisure Shoes
- 2.2. Running Shoes
- 2.3. Ball Sports Shoes
- 2.4. Others
Sports Shoes Segmentation By Geography
-
1. North America
- 1.1. United States
- 1.2. Canada
- 1.3. Mexico
-
2. South America
- 2.1. Brazil
- 2.2. Argentina
- 2.3. Rest of South America
-
3. Europe
- 3.1. United Kingdom
- 3.2. Germany
- 3.3. France
- 3.4. Italy
- 3.5. Spain
- 3.6. Russia
- 3.7. Benelux
- 3.8. Nordics
- 3.9. Rest of Europe
-
4. Middle East & Africa
- 4.1. Turkey
- 4.2. Israel
- 4.3. GCC
- 4.4. North Africa
- 4.5. South Africa
- 4.6. Rest of Middle East & Africa
-
5. Asia Pacific
- 5.1. China
- 5.2. India
- 5.3. Japan
- 5.4. South Korea
- 5.5. ASEAN
- 5.6. Oceania
- 5.7. Rest of Asia Pacific
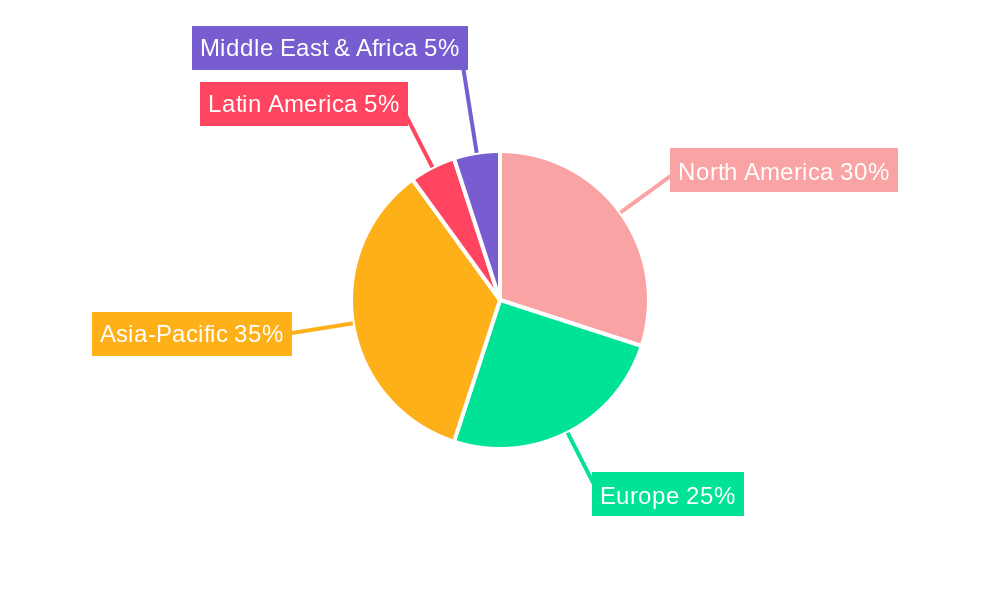
Sports Shoes Regional Market Share
Geographic Coverage of Sports Shoes
Sports Shoes REPORT HIGHLIGHTS
| Aspects | Details |
|---|---|
| Study Period | 2020-2034 |
| Base Year | 2025 |
| Estimated Year | 2026 |
| Forecast Period | 2026-2034 |
| Historical Period | 2020-2025 |
| Growth Rate | CAGR of XX% from 2020-2034 |
| Segmentation |
|
Table of Contents
- 1. Introduction
- 1.1. Research Scope
- 1.2. Market Segmentation
- 1.3. Research Methodology
- 1.4. Definitions and Assumptions
- 2. Executive Summary
- 2.1. Introduction
- 3. Market Dynamics
- 3.1. Introduction
- 3.2. Market Drivers
- 3.3. Market Restrains
- 3.4. Market Trends
- 4. Market Factor Analysis
- 4.1. Porters Five Forces
- 4.2. Supply/Value Chain
- 4.3. PESTEL analysis
- 4.4. Market Entropy
- 4.5. Patent/Trademark Analysis
- 5. Global Sports Shoes Analysis, Insights and Forecast, 2020-2032
- 5.1. Market Analysis, Insights and Forecast - by Application
- 5.1.1. Men
- 5.1.2. Women
- 5.1.3. Children
- 5.2. Market Analysis, Insights and Forecast - by Types
- 5.2.1. Athleisure Shoes
- 5.2.2. Running Shoes
- 5.2.3. Ball Sports Shoes
- 5.2.4. Others
- 5.3. Market Analysis, Insights and Forecast - by Region
- 5.3.1. North America
- 5.3.2. South America
- 5.3.3. Europe
- 5.3.4. Middle East & Africa
- 5.3.5. Asia Pacific
- 5.1. Market Analysis, Insights and Forecast - by Application
- 6. North America Sports Shoes Analysis, Insights and Forecast, 2020-2032
- 6.1. Market Analysis, Insights and Forecast - by Application
- 6.1.1. Men
- 6.1.2. Women
- 6.1.3. Children
- 6.2. Market Analysis, Insights and Forecast - by Types
- 6.2.1. Athleisure Shoes
- 6.2.2. Running Shoes
- 6.2.3. Ball Sports Shoes
- 6.2.4. Others
- 6.1. Market Analysis, Insights and Forecast - by Application
- 7. South America Sports Shoes Analysis, Insights and Forecast, 2020-2032
- 7.1. Market Analysis, Insights and Forecast - by Application
- 7.1.1. Men
- 7.1.2. Women
- 7.1.3. Children
- 7.2. Market Analysis, Insights and Forecast - by Types
- 7.2.1. Athleisure Shoes
- 7.2.2. Running Shoes
- 7.2.3. Ball Sports Shoes
- 7.2.4. Others
- 7.1. Market Analysis, Insights and Forecast - by Application
- 8. Europe Sports Shoes Analysis, Insights and Forecast, 2020-2032
- 8.1. Market Analysis, Insights and Forecast - by Application
- 8.1.1. Men
- 8.1.2. Women
- 8.1.3. Children
- 8.2. Market Analysis, Insights and Forecast - by Types
- 8.2.1. Athleisure Shoes
- 8.2.2. Running Shoes
- 8.2.3. Ball Sports Shoes
- 8.2.4. Others
- 8.1. Market Analysis, Insights and Forecast - by Application
- 9. Middle East & Africa Sports Shoes Analysis, Insights and Forecast, 2020-2032
- 9.1. Market Analysis, Insights and Forecast - by Application
- 9.1.1. Men
- 9.1.2. Women
- 9.1.3. Children
- 9.2. Market Analysis, Insights and Forecast - by Types
- 9.2.1. Athleisure Shoes
- 9.2.2. Running Shoes
- 9.2.3. Ball Sports Shoes
- 9.2.4. Others
- 9.1. Market Analysis, Insights and Forecast - by Application
- 10. Asia Pacific Sports Shoes Analysis, Insights and Forecast, 2020-2032
- 10.1. Market Analysis, Insights and Forecast - by Application
- 10.1.1. Men
- 10.1.2. Women
- 10.1.3. Children
- 10.2. Market Analysis, Insights and Forecast - by Types
- 10.2.1. Athleisure Shoes
- 10.2.2. Running Shoes
- 10.2.3. Ball Sports Shoes
- 10.2.4. Others
- 10.1. Market Analysis, Insights and Forecast - by Application
- 11. Competitive Analysis
- 11.1. Global Market Share Analysis 2025
- 11.2. Company Profiles
- 11.2.1 Nike
- 11.2.1.1. Overview
- 11.2.1.2. Products
- 11.2.1.3. SWOT Analysis
- 11.2.1.4. Recent Developments
- 11.2.1.5. Financials (Based on Availability)
- 11.2.2 Adidas Group
- 11.2.2.1. Overview
- 11.2.2.2. Products
- 11.2.2.3. SWOT Analysis
- 11.2.2.4. Recent Developments
- 11.2.2.5. Financials (Based on Availability)
- 11.2.3 Puma
- 11.2.3.1. Overview
- 11.2.3.2. Products
- 11.2.3.3. SWOT Analysis
- 11.2.3.4. Recent Developments
- 11.2.3.5. Financials (Based on Availability)
- 11.2.4 New Balance
- 11.2.4.1. Overview
- 11.2.4.2. Products
- 11.2.4.3. SWOT Analysis
- 11.2.4.4. Recent Developments
- 11.2.4.5. Financials (Based on Availability)
- 11.2.5 Asics
- 11.2.5.1. Overview
- 11.2.5.2. Products
- 11.2.5.3. SWOT Analysis
- 11.2.5.4. Recent Developments
- 11.2.5.5. Financials (Based on Availability)
- 11.2.6 Sketcher
- 11.2.6.1. Overview
- 11.2.6.2. Products
- 11.2.6.3. SWOT Analysis
- 11.2.6.4. Recent Developments
- 11.2.6.5. Financials (Based on Availability)
- 11.2.7 K-Swiss
- 11.2.7.1. Overview
- 11.2.7.2. Products
- 11.2.7.3. SWOT Analysis
- 11.2.7.4. Recent Developments
- 11.2.7.5. Financials (Based on Availability)
- 11.2.8 MIZUNO
- 11.2.8.1. Overview
- 11.2.8.2. Products
- 11.2.8.3. SWOT Analysis
- 11.2.8.4. Recent Developments
- 11.2.8.5. Financials (Based on Availability)
- 11.2.9 KAPPA
- 11.2.9.1. Overview
- 11.2.9.2. Products
- 11.2.9.3. SWOT Analysis
- 11.2.9.4. Recent Developments
- 11.2.9.5. Financials (Based on Availability)
- 11.2.10 Merrell
- 11.2.10.1. Overview
- 11.2.10.2. Products
- 11.2.10.3. SWOT Analysis
- 11.2.10.4. Recent Developments
- 11.2.10.5. Financials (Based on Availability)
- 11.2.11 Vibram
- 11.2.11.1. Overview
- 11.2.11.2. Products
- 11.2.11.3. SWOT Analysis
- 11.2.11.4. Recent Developments
- 11.2.11.5. Financials (Based on Availability)
- 11.2.12 LI-NING
- 11.2.12.1. Overview
- 11.2.12.2. Products
- 11.2.12.3. SWOT Analysis
- 11.2.12.4. Recent Developments
- 11.2.12.5. Financials (Based on Availability)
- 11.2.13 ANTA
- 11.2.13.1. Overview
- 11.2.13.2. Products
- 11.2.13.3. SWOT Analysis
- 11.2.13.4. Recent Developments
- 11.2.13.5. Financials (Based on Availability)
- 11.2.14 XTEP
- 11.2.14.1. Overview
- 11.2.14.2. Products
- 11.2.14.3. SWOT Analysis
- 11.2.14.4. Recent Developments
- 11.2.14.5. Financials (Based on Availability)
- 11.2.15 361°
- 11.2.15.1. Overview
- 11.2.15.2. Products
- 11.2.15.3. SWOT Analysis
- 11.2.15.4. Recent Developments
- 11.2.15.5. Financials (Based on Availability)
- 11.2.16 PEAK
- 11.2.16.1. Overview
- 11.2.16.2. Products
- 11.2.16.3. SWOT Analysis
- 11.2.16.4. Recent Developments
- 11.2.16.5. Financials (Based on Availability)
- 11.2.17 Under Armour
- 11.2.17.1. Overview
- 11.2.17.2. Products
- 11.2.17.3. SWOT Analysis
- 11.2.17.4. Recent Developments
- 11.2.17.5. Financials (Based on Availability)
- 11.2.18 BasicNet
- 11.2.18.1. Overview
- 11.2.18.2. Products
- 11.2.18.3. SWOT Analysis
- 11.2.18.4. Recent Developments
- 11.2.18.5. Financials (Based on Availability)
- 11.2.1 Nike
List of Figures
- Figure 1: Global Sports Shoes Revenue Breakdown (million, %) by Region 2025 & 2033
- Figure 2: Global Sports Shoes Volume Breakdown (K, %) by Region 2025 & 2033
- Figure 3: North America Sports Shoes Revenue (million), by Application 2025 & 2033
- Figure 4: North America Sports Shoes Volume (K), by Application 2025 & 2033
- Figure 5: North America Sports Shoes Revenue Share (%), by Application 2025 & 2033
- Figure 6: North America Sports Shoes Volume Share (%), by Application 2025 & 2033
- Figure 7: North America Sports Shoes Revenue (million), by Types 2025 & 2033
- Figure 8: North America Sports Shoes Volume (K), by Types 2025 & 2033
- Figure 9: North America Sports Shoes Revenue Share (%), by Types 2025 & 2033
- Figure 10: North America Sports Shoes Volume Share (%), by Types 2025 & 2033
- Figure 11: North America Sports Shoes Revenue (million), by Country 2025 & 2033
- Figure 12: North America Sports Shoes Volume (K), by Country 2025 & 2033
- Figure 13: North America Sports Shoes Revenue Share (%), by Country 2025 & 2033
- Figure 14: North America Sports Shoes Volume Share (%), by Country 2025 & 2033
- Figure 15: South America Sports Shoes Revenue (million), by Application 2025 & 2033
- Figure 16: South America Sports Shoes Volume (K), by Application 2025 & 2033
- Figure 17: South America Sports Shoes Revenue Share (%), by Application 2025 & 2033
- Figure 18: South America Sports Shoes Volume Share (%), by Application 2025 & 2033
- Figure 19: South America Sports Shoes Revenue (million), by Types 2025 & 2033
- Figure 20: South America Sports Shoes Volume (K), by Types 2025 & 2033
- Figure 21: South America Sports Shoes Revenue Share (%), by Types 2025 & 2033
- Figure 22: South America Sports Shoes Volume Share (%), by Types 2025 & 2033
- Figure 23: South America Sports Shoes Revenue (million), by Country 2025 & 2033
- Figure 24: South America Sports Shoes Volume (K), by Country 2025 & 2033
- Figure 25: South America Sports Shoes Revenue Share (%), by Country 2025 & 2033
- Figure 26: South America Sports Shoes Volume Share (%), by Country 2025 & 2033
- Figure 27: Europe Sports Shoes Revenue (million), by Application 2025 & 2033
- Figure 28: Europe Sports Shoes Volume (K), by Application 2025 & 2033
- Figure 29: Europe Sports Shoes Revenue Share (%), by Application 2025 & 2033
- Figure 30: Europe Sports Shoes Volume Share (%), by Application 2025 & 2033
- Figure 31: Europe Sports Shoes Revenue (million), by Types 2025 & 2033
- Figure 32: Europe Sports Shoes Volume (K), by Types 2025 & 2033
- Figure 33: Europe Sports Shoes Revenue Share (%), by Types 2025 & 2033
- Figure 34: Europe Sports Shoes Volume Share (%), by Types 2025 & 2033
- Figure 35: Europe Sports Shoes Revenue (million), by Country 2025 & 2033
- Figure 36: Europe Sports Shoes Volume (K), by Country 2025 & 2033
- Figure 37: Europe Sports Shoes Revenue Share (%), by Country 2025 & 2033
- Figure 38: Europe Sports Shoes Volume Share (%), by Country 2025 & 2033
- Figure 39: Middle East & Africa Sports Shoes Revenue (million), by Application 2025 & 2033
- Figure 40: Middle East & Africa Sports Shoes Volume (K), by Application 2025 & 2033
- Figure 41: Middle East & Africa Sports Shoes Revenue Share (%), by Application 2025 & 2033
- Figure 42: Middle East & Africa Sports Shoes Volume Share (%), by Application 2025 & 2033
- Figure 43: Middle East & Africa Sports Shoes Revenue (million), by Types 2025 & 2033
- Figure 44: Middle East & Africa Sports Shoes Volume (K), by Types 2025 & 2033
- Figure 45: Middle East & Africa Sports Shoes Revenue Share (%), by Types 2025 & 2033
- Figure 46: Middle East & Africa Sports Shoes Volume Share (%), by Types 2025 & 2033
- Figure 47: Middle East & Africa Sports Shoes Revenue (million), by Country 2025 & 2033
- Figure 48: Middle East & Africa Sports Shoes Volume (K), by Country 2025 & 2033
- Figure 49: Middle East & Africa Sports Shoes Revenue Share (%), by Country 2025 & 2033
- Figure 50: Middle East & Africa Sports Shoes Volume Share (%), by Country 2025 & 2033
- Figure 51: Asia Pacific Sports Shoes Revenue (million), by Application 2025 & 2033
- Figure 52: Asia Pacific Sports Shoes Volume (K), by Application 2025 & 2033
- Figure 53: Asia Pacific Sports Shoes Revenue Share (%), by Application 2025 & 2033
- Figure 54: Asia Pacific Sports Shoes Volume Share (%), by Application 2025 & 2033
- Figure 55: Asia Pacific Sports Shoes Revenue (million), by Types 2025 & 2033
- Figure 56: Asia Pacific Sports Shoes Volume (K), by Types 2025 & 2033
- Figure 57: Asia Pacific Sports Shoes Revenue Share (%), by Types 2025 & 2033
- Figure 58: Asia Pacific Sports Shoes Volume Share (%), by Types 2025 & 2033
- Figure 59: Asia Pacific Sports Shoes Revenue (million), by Country 2025 & 2033
- Figure 60: Asia Pacific Sports Shoes Volume (K), by Country 2025 & 2033
- Figure 61: Asia Pacific Sports Shoes Revenue Share (%), by Country 2025 & 2033
- Figure 62: Asia Pacific Sports Shoes Volume Share (%), by Country 2025 & 2033
List of Tables
- Table 1: Global Sports Shoes Revenue million Forecast, by Application 2020 & 2033
- Table 2: Global Sports Shoes Volume K Forecast, by Application 2020 & 2033
- Table 3: Global Sports Shoes Revenue million Forecast, by Types 2020 & 2033
- Table 4: Global Sports Shoes Volume K Forecast, by Types 2020 & 2033
- Table 5: Global Sports Shoes Revenue million Forecast, by Region 2020 & 2033
- Table 6: Global Sports Shoes Volume K Forecast, by Region 2020 & 2033
- Table 7: Global Sports Shoes Revenue million Forecast, by Application 2020 & 2033
- Table 8: Global Sports Shoes Volume K Forecast, by Application 2020 & 2033
- Table 9: Global Sports Shoes Revenue million Forecast, by Types 2020 & 2033
- Table 10: Global Sports Shoes Volume K Forecast, by Types 2020 & 2033
- Table 11: Global Sports Shoes Revenue million Forecast, by Country 2020 & 2033
- Table 12: Global Sports Shoes Volume K Forecast, by Country 2020 & 2033
- Table 13: United States Sports Shoes Revenue (million) Forecast, by Application 2020 & 2033
- Table 14: United States Sports Shoes Volume (K) Forecast, by Application 2020 & 2033
- Table 15: Canada Sports Shoes Revenue (million) Forecast, by Application 2020 & 2033
- Table 16: Canada Sports Shoes Volume (K) Forecast, by Application 2020 & 2033
- Table 17: Mexico Sports Shoes Revenue (million) Forecast, by Application 2020 & 2033
- Table 18: Mexico Sports Shoes Volume (K) Forecast, by Application 2020 & 2033
- Table 19: Global Sports Shoes Revenue million Forecast, by Application 2020 & 2033
- Table 20: Global Sports Shoes Volume K Forecast, by Application 2020 & 2033
- Table 21: Global Sports Shoes Revenue million Forecast, by Types 2020 & 2033
- Table 22: Global Sports Shoes Volume K Forecast, by Types 2020 & 2033
- Table 23: Global Sports Shoes Revenue million Forecast, by Country 2020 & 2033
- Table 24: Global Sports Shoes Volume K Forecast, by Country 2020 & 2033
- Table 25: Brazil Sports Shoes Revenue (million) Forecast, by Application 2020 & 2033
- Table 26: Brazil Sports Shoes Volume (K) Forecast, by Application 2020 & 2033
- Table 27: Argentina Sports Shoes Revenue (million) Forecast, by Application 2020 & 2033
- Table 28: Argentina Sports Shoes Volume (K) Forecast, by Application 2020 & 2033
- Table 29: Rest of South America Sports Shoes Revenue (million) Forecast, by Application 2020 & 2033
- Table 30: Rest of South America Sports Shoes Volume (K) Forecast, by Application 2020 & 2033
- Table 31: Global Sports Shoes Revenue million Forecast, by Application 2020 & 2033
- Table 32: Global Sports Shoes Volume K Forecast, by Application 2020 & 2033
- Table 33: Global Sports Shoes Revenue million Forecast, by Types 2020 & 2033
- Table 34: Global Sports Shoes Volume K Forecast, by Types 2020 & 2033
- Table 35: Global Sports Shoes Revenue million Forecast, by Country 2020 & 2033
- Table 36: Global Sports Shoes Volume K Forecast, by Country 2020 & 2033
- Table 37: United Kingdom Sports Shoes Revenue (million) Forecast, by Application 2020 & 2033
- Table 38: United Kingdom Sports Shoes Volume (K) Forecast, by Application 2020 & 2033
- Table 39: Germany Sports Shoes Revenue (million) Forecast, by Application 2020 & 2033
- Table 40: Germany Sports Shoes Volume (K) Forecast, by Application 2020 & 2033
- Table 41: France Sports Shoes Revenue (million) Forecast, by Application 2020 & 2033
- Table 42: France Sports Shoes Volume (K) Forecast, by Application 2020 & 2033
- Table 43: Italy Sports Shoes Revenue (million) Forecast, by Application 2020 & 2033
- Table 44: Italy Sports Shoes Volume (K) Forecast, by Application 2020 & 2033
- Table 45: Spain Sports Shoes Revenue (million) Forecast, by Application 2020 & 2033
- Table 46: Spain Sports Shoes Volume (K) Forecast, by Application 2020 & 2033
- Table 47: Russia Sports Shoes Revenue (million) Forecast, by Application 2020 & 2033
- Table 48: Russia Sports Shoes Volume (K) Forecast, by Application 2020 & 2033
- Table 49: Benelux Sports Shoes Revenue (million) Forecast, by Application 2020 & 2033
- Table 50: Benelux Sports Shoes Volume (K) Forecast, by Application 2020 & 2033
- Table 51: Nordics Sports Shoes Revenue (million) Forecast, by Application 2020 & 2033
- Table 52: Nordics Sports Shoes Volume (K) Forecast, by Application 2020 & 2033
- Table 53: Rest of Europe Sports Shoes Revenue (million) Forecast, by Application 2020 & 2033
- Table 54: Rest of Europe Sports Shoes Volume (K) Forecast, by Application 2020 & 2033
- Table 55: Global Sports Shoes Revenue million Forecast, by Application 2020 & 2033
- Table 56: Global Sports Shoes Volume K Forecast, by Application 2020 & 2033
- Table 57: Global Sports Shoes Revenue million Forecast, by Types 2020 & 2033
- Table 58: Global Sports Shoes Volume K Forecast, by Types 2020 & 2033
- Table 59: Global Sports Shoes Revenue million Forecast, by Country 2020 & 2033
- Table 60: Global Sports Shoes Volume K Forecast, by Country 2020 & 2033
- Table 61: Turkey Sports Shoes Revenue (million) Forecast, by Application 2020 & 2033
- Table 62: Turkey Sports Shoes Volume (K) Forecast, by Application 2020 & 2033
- Table 63: Israel Sports Shoes Revenue (million) Forecast, by Application 2020 & 2033
- Table 64: Israel Sports Shoes Volume (K) Forecast, by Application 2020 & 2033
- Table 65: GCC Sports Shoes Revenue (million) Forecast, by Application 2020 & 2033
- Table 66: GCC Sports Shoes Volume (K) Forecast, by Application 2020 & 2033
- Table 67: North Africa Sports Shoes Revenue (million) Forecast, by Application 2020 & 2033
- Table 68: North Africa Sports Shoes Volume (K) Forecast, by Application 2020 & 2033
- Table 69: South Africa Sports Shoes Revenue (million) Forecast, by Application 2020 & 2033
- Table 70: South Africa Sports Shoes Volume (K) Forecast, by Application 2020 & 2033
- Table 71: Rest of Middle East & Africa Sports Shoes Revenue (million) Forecast, by Application 2020 & 2033
- Table 72: Rest of Middle East & Africa Sports Shoes Volume (K) Forecast, by Application 2020 & 2033
- Table 73: Global Sports Shoes Revenue million Forecast, by Application 2020 & 2033
- Table 74: Global Sports Shoes Volume K Forecast, by Application 2020 & 2033
- Table 75: Global Sports Shoes Revenue million Forecast, by Types 2020 & 2033
- Table 76: Global Sports Shoes Volume K Forecast, by Types 2020 & 2033
- Table 77: Global Sports Shoes Revenue million Forecast, by Country 2020 & 2033
- Table 78: Global Sports Shoes Volume K Forecast, by Country 2020 & 2033
- Table 79: China Sports Shoes Revenue (million) Forecast, by Application 2020 & 2033
- Table 80: China Sports Shoes Volume (K) Forecast, by Application 2020 & 2033
- Table 81: India Sports Shoes Revenue (million) Forecast, by Application 2020 & 2033
- Table 82: India Sports Shoes Volume (K) Forecast, by Application 2020 & 2033
- Table 83: Japan Sports Shoes Revenue (million) Forecast, by Application 2020 & 2033
- Table 84: Japan Sports Shoes Volume (K) Forecast, by Application 2020 & 2033
- Table 85: South Korea Sports Shoes Revenue (million) Forecast, by Application 2020 & 2033
- Table 86: South Korea Sports Shoes Volume (K) Forecast, by Application 2020 & 2033
- Table 87: ASEAN Sports Shoes Revenue (million) Forecast, by Application 2020 & 2033
- Table 88: ASEAN Sports Shoes Volume (K) Forecast, by Application 2020 & 2033
- Table 89: Oceania Sports Shoes Revenue (million) Forecast, by Application 2020 & 2033
- Table 90: Oceania Sports Shoes Volume (K) Forecast, by Application 2020 & 2033
- Table 91: Rest of Asia Pacific Sports Shoes Revenue (million) Forecast, by Application 2020 & 2033
- Table 92: Rest of Asia Pacific Sports Shoes Volume (K) Forecast, by Application 2020 & 2033
Frequently Asked Questions
1. What is the projected Compound Annual Growth Rate (CAGR) of the Sports Shoes?
The projected CAGR is approximately XX%.
2. Which companies are prominent players in the Sports Shoes?
Key companies in the market include Nike, Adidas Group, Puma, New Balance, Asics, Sketcher, K-Swiss, MIZUNO, KAPPA, Merrell, Vibram, LI-NING, ANTA, XTEP, 361°, PEAK, Under Armour, BasicNet.
3. What are the main segments of the Sports Shoes?
The market segments include Application, Types.
4. Can you provide details about the market size?
The market size is estimated to be USD XXX million as of 2022.
5. What are some drivers contributing to market growth?
N/A
6. What are the notable trends driving market growth?
N/A
7. Are there any restraints impacting market growth?
N/A
8. Can you provide examples of recent developments in the market?
N/A
9. What pricing options are available for accessing the report?
Pricing options include single-user, multi-user, and enterprise licenses priced at USD 3350.00, USD 5025.00, and USD 6700.00 respectively.
10. Is the market size provided in terms of value or volume?
The market size is provided in terms of value, measured in million and volume, measured in K.
11. Are there any specific market keywords associated with the report?
Yes, the market keyword associated with the report is "Sports Shoes," which aids in identifying and referencing the specific market segment covered.
12. How do I determine which pricing option suits my needs best?
The pricing options vary based on user requirements and access needs. Individual users may opt for single-user licenses, while businesses requiring broader access may choose multi-user or enterprise licenses for cost-effective access to the report.
13. Are there any additional resources or data provided in the Sports Shoes report?
While the report offers comprehensive insights, it's advisable to review the specific contents or supplementary materials provided to ascertain if additional resources or data are available.
14. How can I stay updated on further developments or reports in the Sports Shoes?
To stay informed about further developments, trends, and reports in the Sports Shoes, consider subscribing to industry newsletters, following relevant companies and organizations, or regularly checking reputable industry news sources and publications.
Methodology
Step 1 - Identification of Relevant Samples Size from Population Database


Step 2 - Approaches for Defining Global Market Size (Value, Volume* & Price*)

Note*: In applicable scenarios
Step 3 - Data Sources
Primary Research
- Web Analytics
- Survey Reports
- Research Institute
- Latest Research Reports
- Opinion Leaders
Secondary Research
- Annual Reports
- White Paper
- Latest Press Release
- Industry Association
- Paid Database
- Investor Presentations

Step 4 - Data Triangulation
Involves using different sources of information in order to increase the validity of a study
These sources are likely to be stakeholders in a program - participants, other researchers, program staff, other community members, and so on.
Then we put all data in single framework & apply various statistical tools to find out the dynamic on the market.
During the analysis stage, feedback from the stakeholder groups would be compared to determine areas of agreement as well as areas of divergence