

Key Insights
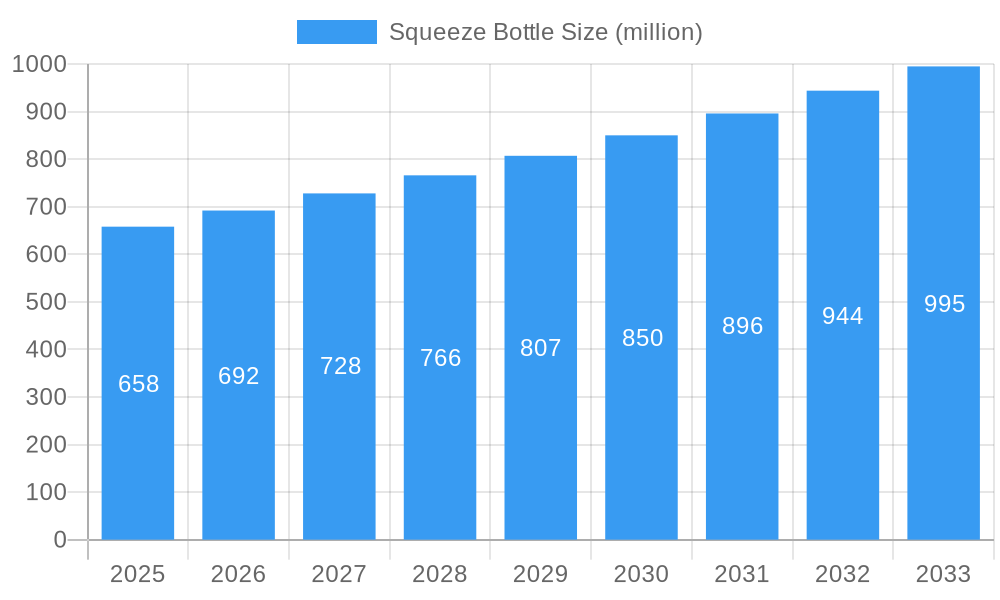
The global squeeze bottle market is experiencing robust growth, projected to reach approximately USD 658 million by 2025. This expansion is fueled by an estimated Compound Annual Growth Rate (CAGR) of 5.3% from 2025 to 2033, indicating a sustained upward trajectory. A primary driver for this market is the increasing demand from the food and beverage sector, where squeeze bottles offer convenience, portion control, and enhanced product appeal for a wide array of condiments, sauces, and beverages. The automotive industry also contributes significantly, utilizing squeeze bottles for various lubricants, adhesives, and cleaning agents. Furthermore, the chemicals sector leverages these containers for safe and controlled dispensing of specialized fluids. The market is segmented by volume, with capacities ranging from below 100 ml to above 750 ml, catering to diverse consumer and industrial needs. The "Below 100 ml" and "100 ml to 250 ml" segments are particularly dynamic, driven by single-serving packaging trends and on-the-go consumption.
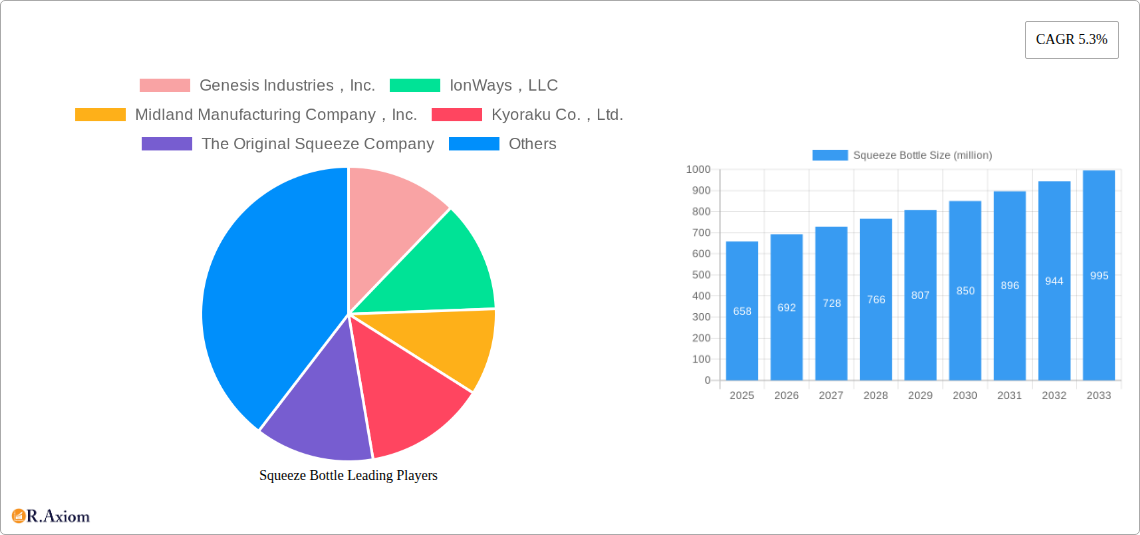
Squeeze Bottle Market Size (In Million)
Emerging trends shaping the squeeze bottle market include a strong emphasis on sustainable materials and innovative designs. Manufacturers are increasingly focusing on recyclable and biodegradable plastics, as well as exploring reusable options to meet environmental regulations and consumer preferences. Advanced dispensing mechanisms, such as tamper-evident closures and child-resistant features, are also gaining traction. Geographically, the Asia Pacific region, led by China and India, is anticipated to be a key growth engine due to its burgeoning middle class, expanding food processing industry, and increasing adoption of convenient packaging solutions. North America and Europe remain mature yet significant markets, characterized by a strong demand for premium and specialized squeeze bottle applications. Restraints to growth may include fluctuating raw material prices for plastic production and intense competition among manufacturers, pushing for continuous innovation and cost-efficiency. Key players like Genesis Industries, Inc., IonWays, LLC, and Kyoraku Co., Ltd. are actively involved in expanding their product portfolios and geographical reach to capitalize on these market dynamics.
Squeeze Bottle Company Market Share
Squeeze Bottle Market Concentration & Innovation
The global squeeze bottle market exhibits a moderate to high concentration, with several key players vying for market share. Genesis Industries, Inc., IonWays, LLC, Midland Manufacturing Company, Inc., Kyoraku Co., Ltd., The Original Squeeze Company, Suzhou Innovation Packaging Materials Co., Ltd, Illing Company, Inc., and Kaufman Container Company are prominent entities shaping the competitive landscape. Innovation is a crucial driver, with companies investing significantly in developing novel materials, dispensing mechanisms, and sustainable packaging solutions. Regulatory frameworks, particularly concerning food contact safety and environmental impact, influence product development and manufacturing processes. The threat of product substitutes, such as rigid containers and pouches, remains a consideration, though squeeze bottles offer distinct advantages in convenience and portion control. End-user trends are leaning towards personalized packaging, on-the-go consumption, and eco-friendly options. Mergers and acquisitions (M&A) activity is expected to continue, with projected M&A deal values reaching hundreds of millions over the forecast period as larger players consolidate their market positions and acquire innovative technologies or niche market access. Market share for top companies is estimated to be in the millions, reflecting their substantial contributions to the global squeeze bottle market.
Squeeze Bottle Industry Trends & Insights
The squeeze bottle industry is poised for significant expansion, driven by a confluence of factors that are reshaping consumer habits and industrial applications. The projected Compound Annual Growth Rate (CAGR) for the squeeze bottle market is estimated at xx% over the forecast period of 2025-2033. This robust growth is fueled by an increasing demand for convenience and portability, especially within the food and beverage sector, where consumers are increasingly opting for single-serving and on-the-go options for condiments, sauces, and beverages. Technological advancements are at the forefront of industry evolution. Innovations in material science are leading to the development of lighter, more durable, and more sustainable squeeze bottle designs. Enhanced dispensing mechanisms, such as tamper-evident caps and precision-flow nozzles, are improving user experience and reducing product wastage. Furthermore, advancements in printing and labeling technologies allow for greater customization and brand differentiation, catering to the growing trend of personalized products.
Consumer preferences are increasingly aligning with sustainability and health consciousness. This translates into a demand for squeeze bottles made from recycled or bio-based materials, as well as those that minimize environmental impact throughout their lifecycle. Brands are responding by offering eco-friendly packaging solutions, which are gaining traction among environmentally aware consumers. The competitive dynamics within the squeeze bottle market are characterized by intense rivalry, with established manufacturers and emerging players constantly innovating to capture market share. Strategic partnerships, product diversification, and a focus on cost-efficiency are key strategies employed by companies to maintain a competitive edge. The market penetration of squeeze bottles is expected to deepen across various applications, driven by their inherent versatility and cost-effectiveness compared to alternative packaging formats. The global market size is projected to reach billions of dollars by 2033, with continuous investment in research and development playing a pivotal role in driving future growth.
Dominant Markets & Segments in Squeeze Bottle
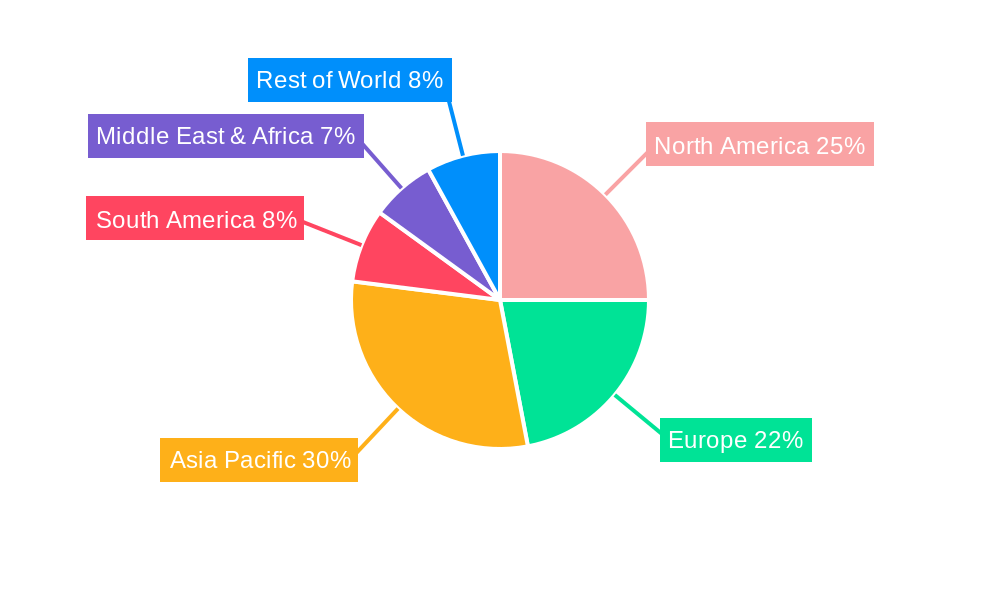
The global squeeze bottle market demonstrates significant regional dominance, with Asia Pacific emerging as the leading territory, driven by its massive consumer base, rapidly expanding economies, and increasing adoption of modern retail and packaging practices. Countries like China and India, with their burgeoning middle class and a growing demand for processed foods and beverages, are major contributors to this regional leadership. Economic policies that support manufacturing and export, coupled with substantial investments in infrastructure development, further bolster the dominance of this region.
Within the diverse applications of squeeze bottles, the Food & Beverages segment is unequivocally the most dominant. This segment accounts for a significant portion of the market's revenue, estimated to be in the billions of dollars annually.
- Condiments and Sauces: The widespread use of squeeze bottles for ketchup, mustard, mayonnaise, hot sauces, and salad dressings in households and foodservice establishments is a primary driver. The convenience of controlled dispensing and reduced mess makes them the preferred choice.
- Beverages: Single-serving juice, flavored water, and sports drink squeeze bottles are popular for their portability and ease of consumption, particularly among children and active individuals.
- Dairy Products: Yogurt, milk, and flavored milk in squeeze bottle formats offer a convenient and appealing option for on-the-go consumption.
In terms of product types, the 250 ml to 500 ml category commands the largest market share, also valued in the billions. This size range strikes an optimal balance between portability and capacity for a wide array of food and beverage products, catering to individual servings and common household needs.
- Ideal for Condiments and Sauces: This volume is perfect for standard ketchup, mustard, and specialty sauce bottles, providing ample product for multiple uses without being overly cumbersome.
- Popular for Beverages: Many single-serving juice boxes and sports drinks are now transitioning to squeeze bottle formats within this capacity range, offering enhanced user experience.
- Versatility in Personal Care and Pharmaceuticals: While Food & Beverages dominate, this size segment also sees significant use in travel-sized toiletries and certain over-the-counter medications, further contributing to its market dominance.
The Automobile sector, while a smaller segment, is experiencing consistent growth due to the use of squeeze bottles for lubricants, coolants, and cleaning agents, where precise application is crucial. The Chemicals segment utilizes squeeze bottles for specialized adhesives, sealants, and laboratory reagents, emphasizing accuracy and safety in dispensing. The Others segment, encompassing personal care, pharmaceuticals, and industrial applications, collectively contributes to the overall market size, demonstrating the pervasive utility of squeeze bottle technology. Economic policies favoring consumer spending, coupled with evolving lifestyle choices that prioritize convenience and portion control, are key drivers of this segmented dominance.
Squeeze Bottle Product Developments
Recent product developments in the squeeze bottle market are significantly enhancing functionality and sustainability. Innovations include the introduction of multi-layer co-extruded bottles offering improved barrier properties and extended shelf life for sensitive contents. Advanced dispensing cap designs are providing greater control over flow rates, reducing spillage and enabling precise application. Furthermore, a strong emphasis is placed on incorporating recycled content and exploring bio-plastic alternatives to meet growing consumer demand for eco-friendly packaging. These advancements contribute to competitive advantages by offering superior product protection, enhanced user convenience, and a reduced environmental footprint, aligning with evolving market expectations.
Report Scope & Segmentation Analysis
This comprehensive report delves into the global squeeze bottle market, providing an in-depth analysis across key segmentation parameters. The market is meticulously segmented by Application into Food & Beverages, Automobile, Chemicals, and Others. Each application segment is analyzed for its unique market dynamics, growth projections, and competitive landscape. The Food & Beverages segment, expected to witness a CAGR of xx%, is projected to hold a market size of billions by 2033. The Automobile segment, while smaller, is anticipated to grow at xx% CAGR, reaching millions in market value. The Chemicals segment is projected to achieve a CAGR of xx%, with a market size in the millions. The Others segment, encompassing pharmaceuticals, personal care, and industrial uses, is estimated to grow at xx% CAGR, contributing billions to the overall market.
Furthermore, the report meticulously segments the market by Type, categorizing it into Below 100 ml, 100 ml to 250 ml, 250 ml to 500 ml, 500 ml to 750 ml, and Above 750 ml. The 250 ml to 500 ml segment is projected to maintain its leadership with a CAGR of xx% and a market size in the billions by 2033. The 100 ml to 250 ml segment is expected to grow at xx% CAGR, reaching billions. The Below 100 ml segment, catering to single-use and travel-sized products, is projected to grow at xx% CAGR, with a market value in the millions. The 500 ml to 750 ml and Above 750 ml segments, while experiencing steady growth at xx% and xx% CAGR respectively, are anticipated to contribute billions and millions to the market by 2033, respectively.
Key Drivers of Squeeze Bottle Growth
Several pivotal factors are propelling the growth of the global squeeze bottle market. The escalating demand for convenience and portability, particularly within the food and beverage industry, is a primary catalyst, driven by modern lifestyles and on-the-go consumption trends. Technological advancements in materials science and dispensing mechanisms are enabling the creation of more functional, durable, and user-friendly squeeze bottles. Growing consumer awareness regarding sustainability and the environmental impact of packaging is fostering a preference for recyclable, reusable, and bio-based squeeze bottle solutions, compelling manufacturers to innovate in this space. Furthermore, expanding e-commerce platforms are increasing the reach of packaged goods, thereby boosting the demand for various packaging formats, including squeeze bottles. The increasing disposable income in emerging economies is also contributing to a rise in the consumption of processed foods and beverages, directly impacting the squeeze bottle market.
Challenges in the Squeeze Bottle Sector
Despite its promising growth trajectory, the squeeze bottle sector faces several formidable challenges. Stringent regulatory frameworks regarding food contact materials and environmental standards can increase compliance costs and slow down product development cycles. Fluctuations in raw material prices, such as polyethylene and polypropylene, can impact manufacturing costs and profit margins. Intense competition from alternative packaging solutions like rigid containers and stand-up pouches poses a continuous threat, requiring manufacturers to constantly innovate and differentiate their offerings. Supply chain disruptions, whether due to geopolitical events, natural disasters, or logistical complexities, can lead to production delays and increased costs. Furthermore, the increasing focus on plastic waste reduction and the push towards a circular economy present a significant challenge, necessitating substantial investment in sustainable materials and recycling infrastructure.
Emerging Opportunities in Squeeze Bottle
The squeeze bottle market is ripe with emerging opportunities, driven by evolving consumer preferences and technological advancements. The growing demand for personalized and customizable packaging presents a significant avenue for growth, allowing brands to cater to niche markets and enhance consumer engagement. The increasing popularity of plant-based diets and specialized dietary products is creating opportunities for squeeze bottles in packaging innovative food items. Furthermore, the expansion of e-commerce and direct-to-consumer (DTC) models offers new distribution channels and market access for squeeze bottle manufacturers. The development and adoption of advanced barrier technologies and smart packaging solutions can open doors in segments requiring extended shelf life and enhanced product safety. Investing in biodegradable and compostable squeeze bottle materials will also be crucial for tapping into the environmentally conscious consumer base and meeting future regulatory demands.
Leading Players in the Squeeze Bottle Market
- Genesis Industries, Inc.
- IonWays, LLC
- Midland Manufacturing Company, Inc.
- Kyoraku Co., Ltd.
- The Original Squeeze Company
- Suzhou Innovation Packaging Materials Co.,Ltd
- Illing Company, Inc.
- Kaufman Container Company
Key Developments in Squeeze Bottle Industry
- 2024 April: Launch of advanced child-resistant dispensing caps by a major manufacturer, enhancing safety in pharmaceutical and household chemical applications.
- 2023 November: Introduction of a new line of squeeze bottles made from 30% post-consumer recycled (PCR) content by Genesis Industries, Inc., underscoring a commitment to sustainability.
- 2023 July: Acquisition of a specialized dispensing technology firm by IonWays, LLC, to bolster its innovation pipeline in precision fluid delivery.
- 2022 December: Midland Manufacturing Company, Inc. expands its production capacity for high-density polyethylene (HDPE) squeeze bottles to meet surging demand from the food and beverage sector.
- 2022 May: Kyoraku Co., Ltd. announces a partnership to explore the use of novel bio-based polymers for squeeze bottle manufacturing.
- 2021 October: The Original Squeeze Company introduces an innovative ergonomic design for its foodservice squeeze bottles, improving user comfort and efficiency.
- 2021 March: Suzhou Innovation Packaging Materials Co.,Ltd secures a significant contract for supplying squeeze bottles to a multinational beverage company, highlighting its growing market presence.
- 2020 September: Illing Company, Inc. invests in advanced printing capabilities to offer enhanced branding and customization options for squeeze bottles.
Strategic Outlook for Squeeze Bottle Market
The strategic outlook for the squeeze bottle market is exceptionally positive, characterized by sustained growth and innovation. The increasing global emphasis on convenience, coupled with evolving consumer preferences for on-the-go consumption, will continue to be a primary growth catalyst. Manufacturers are strategically focusing on developing sustainable and eco-friendly packaging solutions, including those made from recycled materials and bioplastics, to align with regulatory mandates and consumer expectations. Technological advancements in dispensing mechanisms and material science will play a crucial role in creating differentiated products and enhancing functionality. The expanding middle class in emerging economies presents significant untapped market potential, offering lucrative opportunities for market expansion. Strategic partnerships, M&A activities, and a robust focus on research and development will be key for players aiming to maintain a competitive edge and capitalize on the burgeoning demand for versatile and convenient squeeze bottle solutions across diverse industries.
Squeeze Bottle Segmentation
-
1. Application
- 1.1. Food & Beverages
- 1.2. Automobile
- 1.3. Chemicals
- 1.4. Others
-
2. Types
- 2.1. Below 100 ml
- 2.2. 100 ml to 250 ml
- 2.3. 250 ml to 500 ml
- 2.4. 500 ml to 750 ml
- 2.5. Above 750 ml
Squeeze Bottle Segmentation By Geography
-
1. North America
- 1.1. United States
- 1.2. Canada
- 1.3. Mexico
-
2. South America
- 2.1. Brazil
- 2.2. Argentina
- 2.3. Rest of South America
-
3. Europe
- 3.1. United Kingdom
- 3.2. Germany
- 3.3. France
- 3.4. Italy
- 3.5. Spain
- 3.6. Russia
- 3.7. Benelux
- 3.8. Nordics
- 3.9. Rest of Europe
-
4. Middle East & Africa
- 4.1. Turkey
- 4.2. Israel
- 4.3. GCC
- 4.4. North Africa
- 4.5. South Africa
- 4.6. Rest of Middle East & Africa
-
5. Asia Pacific
- 5.1. China
- 5.2. India
- 5.3. Japan
- 5.4. South Korea
- 5.5. ASEAN
- 5.6. Oceania
- 5.7. Rest of Asia Pacific
Squeeze Bottle Regional Market Share
Geographic Coverage of Squeeze Bottle
Squeeze Bottle REPORT HIGHLIGHTS
| Aspects | Details |
|---|---|
| Study Period | 2020-2034 |
| Base Year | 2025 |
| Estimated Year | 2026 |
| Forecast Period | 2026-2034 |
| Historical Period | 2020-2025 |
| Growth Rate | CAGR of 7.2% from 2020-2034 |
| Segmentation |
|
Table of Contents
- 1. Introduction
- 1.1. Research Scope
- 1.2. Market Segmentation
- 1.3. Research Methodology
- 1.4. Definitions and Assumptions
- 2. Executive Summary
- 2.1. Introduction
- 3. Market Dynamics
- 3.1. Introduction
- 3.2. Market Drivers
- 3.3. Market Restrains
- 3.4. Market Trends
- 4. Market Factor Analysis
- 4.1. Porters Five Forces
- 4.2. Supply/Value Chain
- 4.3. PESTEL analysis
- 4.4. Market Entropy
- 4.5. Patent/Trademark Analysis
- 5. Global Squeeze Bottle Analysis, Insights and Forecast, 2020-2032
- 5.1. Market Analysis, Insights and Forecast - by Application
- 5.1.1. Food & Beverages
- 5.1.2. Automobile
- 5.1.3. Chemicals
- 5.1.4. Others
- 5.2. Market Analysis, Insights and Forecast - by Types
- 5.2.1. Below 100 ml
- 5.2.2. 100 ml to 250 ml
- 5.2.3. 250 ml to 500 ml
- 5.2.4. 500 ml to 750 ml
- 5.2.5. Above 750 ml
- 5.3. Market Analysis, Insights and Forecast - by Region
- 5.3.1. North America
- 5.3.2. South America
- 5.3.3. Europe
- 5.3.4. Middle East & Africa
- 5.3.5. Asia Pacific
- 5.1. Market Analysis, Insights and Forecast - by Application
- 6. North America Squeeze Bottle Analysis, Insights and Forecast, 2020-2032
- 6.1. Market Analysis, Insights and Forecast - by Application
- 6.1.1. Food & Beverages
- 6.1.2. Automobile
- 6.1.3. Chemicals
- 6.1.4. Others
- 6.2. Market Analysis, Insights and Forecast - by Types
- 6.2.1. Below 100 ml
- 6.2.2. 100 ml to 250 ml
- 6.2.3. 250 ml to 500 ml
- 6.2.4. 500 ml to 750 ml
- 6.2.5. Above 750 ml
- 6.1. Market Analysis, Insights and Forecast - by Application
- 7. South America Squeeze Bottle Analysis, Insights and Forecast, 2020-2032
- 7.1. Market Analysis, Insights and Forecast - by Application
- 7.1.1. Food & Beverages
- 7.1.2. Automobile
- 7.1.3. Chemicals
- 7.1.4. Others
- 7.2. Market Analysis, Insights and Forecast - by Types
- 7.2.1. Below 100 ml
- 7.2.2. 100 ml to 250 ml
- 7.2.3. 250 ml to 500 ml
- 7.2.4. 500 ml to 750 ml
- 7.2.5. Above 750 ml
- 7.1. Market Analysis, Insights and Forecast - by Application
- 8. Europe Squeeze Bottle Analysis, Insights and Forecast, 2020-2032
- 8.1. Market Analysis, Insights and Forecast - by Application
- 8.1.1. Food & Beverages
- 8.1.2. Automobile
- 8.1.3. Chemicals
- 8.1.4. Others
- 8.2. Market Analysis, Insights and Forecast - by Types
- 8.2.1. Below 100 ml
- 8.2.2. 100 ml to 250 ml
- 8.2.3. 250 ml to 500 ml
- 8.2.4. 500 ml to 750 ml
- 8.2.5. Above 750 ml
- 8.1. Market Analysis, Insights and Forecast - by Application
- 9. Middle East & Africa Squeeze Bottle Analysis, Insights and Forecast, 2020-2032
- 9.1. Market Analysis, Insights and Forecast - by Application
- 9.1.1. Food & Beverages
- 9.1.2. Automobile
- 9.1.3. Chemicals
- 9.1.4. Others
- 9.2. Market Analysis, Insights and Forecast - by Types
- 9.2.1. Below 100 ml
- 9.2.2. 100 ml to 250 ml
- 9.2.3. 250 ml to 500 ml
- 9.2.4. 500 ml to 750 ml
- 9.2.5. Above 750 ml
- 9.1. Market Analysis, Insights and Forecast - by Application
- 10. Asia Pacific Squeeze Bottle Analysis, Insights and Forecast, 2020-2032
- 10.1. Market Analysis, Insights and Forecast - by Application
- 10.1.1. Food & Beverages
- 10.1.2. Automobile
- 10.1.3. Chemicals
- 10.1.4. Others
- 10.2. Market Analysis, Insights and Forecast - by Types
- 10.2.1. Below 100 ml
- 10.2.2. 100 ml to 250 ml
- 10.2.3. 250 ml to 500 ml
- 10.2.4. 500 ml to 750 ml
- 10.2.5. Above 750 ml
- 10.1. Market Analysis, Insights and Forecast - by Application
- 11. Competitive Analysis
- 11.1. Global Market Share Analysis 2025
- 11.2. Company Profiles
- 11.2.1 Genesis Industries,Inc.
- 11.2.1.1. Overview
- 11.2.1.2. Products
- 11.2.1.3. SWOT Analysis
- 11.2.1.4. Recent Developments
- 11.2.1.5. Financials (Based on Availability)
- 11.2.2 IonWays,LLC
- 11.2.2.1. Overview
- 11.2.2.2. Products
- 11.2.2.3. SWOT Analysis
- 11.2.2.4. Recent Developments
- 11.2.2.5. Financials (Based on Availability)
- 11.2.3 Midland Manufacturing Company,Inc.
- 11.2.3.1. Overview
- 11.2.3.2. Products
- 11.2.3.3. SWOT Analysis
- 11.2.3.4. Recent Developments
- 11.2.3.5. Financials (Based on Availability)
- 11.2.4 Kyoraku Co.,Ltd.
- 11.2.4.1. Overview
- 11.2.4.2. Products
- 11.2.4.3. SWOT Analysis
- 11.2.4.4. Recent Developments
- 11.2.4.5. Financials (Based on Availability)
- 11.2.5 The Original Squeeze Company
- 11.2.5.1. Overview
- 11.2.5.2. Products
- 11.2.5.3. SWOT Analysis
- 11.2.5.4. Recent Developments
- 11.2.5.5. Financials (Based on Availability)
- 11.2.6 Suzhou Innovation Packaging Materials Co.
- 11.2.6.1. Overview
- 11.2.6.2. Products
- 11.2.6.3. SWOT Analysis
- 11.2.6.4. Recent Developments
- 11.2.6.5. Financials (Based on Availability)
- 11.2.7 Ltd
- 11.2.7.1. Overview
- 11.2.7.2. Products
- 11.2.7.3. SWOT Analysis
- 11.2.7.4. Recent Developments
- 11.2.7.5. Financials (Based on Availability)
- 11.2.8 Illing Company
- 11.2.8.1. Overview
- 11.2.8.2. Products
- 11.2.8.3. SWOT Analysis
- 11.2.8.4. Recent Developments
- 11.2.8.5. Financials (Based on Availability)
- 11.2.9 Inc.
- 11.2.9.1. Overview
- 11.2.9.2. Products
- 11.2.9.3. SWOT Analysis
- 11.2.9.4. Recent Developments
- 11.2.9.5. Financials (Based on Availability)
- 11.2.10 Kaufman Container Company
- 11.2.10.1. Overview
- 11.2.10.2. Products
- 11.2.10.3. SWOT Analysis
- 11.2.10.4. Recent Developments
- 11.2.10.5. Financials (Based on Availability)
- 11.2.1 Genesis Industries,Inc.
List of Figures
- Figure 1: Global Squeeze Bottle Revenue Breakdown (undefined, %) by Region 2025 & 2033
- Figure 2: Global Squeeze Bottle Volume Breakdown (K, %) by Region 2025 & 2033
- Figure 3: North America Squeeze Bottle Revenue (undefined), by Application 2025 & 2033
- Figure 4: North America Squeeze Bottle Volume (K), by Application 2025 & 2033
- Figure 5: North America Squeeze Bottle Revenue Share (%), by Application 2025 & 2033
- Figure 6: North America Squeeze Bottle Volume Share (%), by Application 2025 & 2033
- Figure 7: North America Squeeze Bottle Revenue (undefined), by Types 2025 & 2033
- Figure 8: North America Squeeze Bottle Volume (K), by Types 2025 & 2033
- Figure 9: North America Squeeze Bottle Revenue Share (%), by Types 2025 & 2033
- Figure 10: North America Squeeze Bottle Volume Share (%), by Types 2025 & 2033
- Figure 11: North America Squeeze Bottle Revenue (undefined), by Country 2025 & 2033
- Figure 12: North America Squeeze Bottle Volume (K), by Country 2025 & 2033
- Figure 13: North America Squeeze Bottle Revenue Share (%), by Country 2025 & 2033
- Figure 14: North America Squeeze Bottle Volume Share (%), by Country 2025 & 2033
- Figure 15: South America Squeeze Bottle Revenue (undefined), by Application 2025 & 2033
- Figure 16: South America Squeeze Bottle Volume (K), by Application 2025 & 2033
- Figure 17: South America Squeeze Bottle Revenue Share (%), by Application 2025 & 2033
- Figure 18: South America Squeeze Bottle Volume Share (%), by Application 2025 & 2033
- Figure 19: South America Squeeze Bottle Revenue (undefined), by Types 2025 & 2033
- Figure 20: South America Squeeze Bottle Volume (K), by Types 2025 & 2033
- Figure 21: South America Squeeze Bottle Revenue Share (%), by Types 2025 & 2033
- Figure 22: South America Squeeze Bottle Volume Share (%), by Types 2025 & 2033
- Figure 23: South America Squeeze Bottle Revenue (undefined), by Country 2025 & 2033
- Figure 24: South America Squeeze Bottle Volume (K), by Country 2025 & 2033
- Figure 25: South America Squeeze Bottle Revenue Share (%), by Country 2025 & 2033
- Figure 26: South America Squeeze Bottle Volume Share (%), by Country 2025 & 2033
- Figure 27: Europe Squeeze Bottle Revenue (undefined), by Application 2025 & 2033
- Figure 28: Europe Squeeze Bottle Volume (K), by Application 2025 & 2033
- Figure 29: Europe Squeeze Bottle Revenue Share (%), by Application 2025 & 2033
- Figure 30: Europe Squeeze Bottle Volume Share (%), by Application 2025 & 2033
- Figure 31: Europe Squeeze Bottle Revenue (undefined), by Types 2025 & 2033
- Figure 32: Europe Squeeze Bottle Volume (K), by Types 2025 & 2033
- Figure 33: Europe Squeeze Bottle Revenue Share (%), by Types 2025 & 2033
- Figure 34: Europe Squeeze Bottle Volume Share (%), by Types 2025 & 2033
- Figure 35: Europe Squeeze Bottle Revenue (undefined), by Country 2025 & 2033
- Figure 36: Europe Squeeze Bottle Volume (K), by Country 2025 & 2033
- Figure 37: Europe Squeeze Bottle Revenue Share (%), by Country 2025 & 2033
- Figure 38: Europe Squeeze Bottle Volume Share (%), by Country 2025 & 2033
- Figure 39: Middle East & Africa Squeeze Bottle Revenue (undefined), by Application 2025 & 2033
- Figure 40: Middle East & Africa Squeeze Bottle Volume (K), by Application 2025 & 2033
- Figure 41: Middle East & Africa Squeeze Bottle Revenue Share (%), by Application 2025 & 2033
- Figure 42: Middle East & Africa Squeeze Bottle Volume Share (%), by Application 2025 & 2033
- Figure 43: Middle East & Africa Squeeze Bottle Revenue (undefined), by Types 2025 & 2033
- Figure 44: Middle East & Africa Squeeze Bottle Volume (K), by Types 2025 & 2033
- Figure 45: Middle East & Africa Squeeze Bottle Revenue Share (%), by Types 2025 & 2033
- Figure 46: Middle East & Africa Squeeze Bottle Volume Share (%), by Types 2025 & 2033
- Figure 47: Middle East & Africa Squeeze Bottle Revenue (undefined), by Country 2025 & 2033
- Figure 48: Middle East & Africa Squeeze Bottle Volume (K), by Country 2025 & 2033
- Figure 49: Middle East & Africa Squeeze Bottle Revenue Share (%), by Country 2025 & 2033
- Figure 50: Middle East & Africa Squeeze Bottle Volume Share (%), by Country 2025 & 2033
- Figure 51: Asia Pacific Squeeze Bottle Revenue (undefined), by Application 2025 & 2033
- Figure 52: Asia Pacific Squeeze Bottle Volume (K), by Application 2025 & 2033
- Figure 53: Asia Pacific Squeeze Bottle Revenue Share (%), by Application 2025 & 2033
- Figure 54: Asia Pacific Squeeze Bottle Volume Share (%), by Application 2025 & 2033
- Figure 55: Asia Pacific Squeeze Bottle Revenue (undefined), by Types 2025 & 2033
- Figure 56: Asia Pacific Squeeze Bottle Volume (K), by Types 2025 & 2033
- Figure 57: Asia Pacific Squeeze Bottle Revenue Share (%), by Types 2025 & 2033
- Figure 58: Asia Pacific Squeeze Bottle Volume Share (%), by Types 2025 & 2033
- Figure 59: Asia Pacific Squeeze Bottle Revenue (undefined), by Country 2025 & 2033
- Figure 60: Asia Pacific Squeeze Bottle Volume (K), by Country 2025 & 2033
- Figure 61: Asia Pacific Squeeze Bottle Revenue Share (%), by Country 2025 & 2033
- Figure 62: Asia Pacific Squeeze Bottle Volume Share (%), by Country 2025 & 2033
List of Tables
- Table 1: Global Squeeze Bottle Revenue undefined Forecast, by Application 2020 & 2033
- Table 2: Global Squeeze Bottle Volume K Forecast, by Application 2020 & 2033
- Table 3: Global Squeeze Bottle Revenue undefined Forecast, by Types 2020 & 2033
- Table 4: Global Squeeze Bottle Volume K Forecast, by Types 2020 & 2033
- Table 5: Global Squeeze Bottle Revenue undefined Forecast, by Region 2020 & 2033
- Table 6: Global Squeeze Bottle Volume K Forecast, by Region 2020 & 2033
- Table 7: Global Squeeze Bottle Revenue undefined Forecast, by Application 2020 & 2033
- Table 8: Global Squeeze Bottle Volume K Forecast, by Application 2020 & 2033
- Table 9: Global Squeeze Bottle Revenue undefined Forecast, by Types 2020 & 2033
- Table 10: Global Squeeze Bottle Volume K Forecast, by Types 2020 & 2033
- Table 11: Global Squeeze Bottle Revenue undefined Forecast, by Country 2020 & 2033
- Table 12: Global Squeeze Bottle Volume K Forecast, by Country 2020 & 2033
- Table 13: United States Squeeze Bottle Revenue (undefined) Forecast, by Application 2020 & 2033
- Table 14: United States Squeeze Bottle Volume (K) Forecast, by Application 2020 & 2033
- Table 15: Canada Squeeze Bottle Revenue (undefined) Forecast, by Application 2020 & 2033
- Table 16: Canada Squeeze Bottle Volume (K) Forecast, by Application 2020 & 2033
- Table 17: Mexico Squeeze Bottle Revenue (undefined) Forecast, by Application 2020 & 2033
- Table 18: Mexico Squeeze Bottle Volume (K) Forecast, by Application 2020 & 2033
- Table 19: Global Squeeze Bottle Revenue undefined Forecast, by Application 2020 & 2033
- Table 20: Global Squeeze Bottle Volume K Forecast, by Application 2020 & 2033
- Table 21: Global Squeeze Bottle Revenue undefined Forecast, by Types 2020 & 2033
- Table 22: Global Squeeze Bottle Volume K Forecast, by Types 2020 & 2033
- Table 23: Global Squeeze Bottle Revenue undefined Forecast, by Country 2020 & 2033
- Table 24: Global Squeeze Bottle Volume K Forecast, by Country 2020 & 2033
- Table 25: Brazil Squeeze Bottle Revenue (undefined) Forecast, by Application 2020 & 2033
- Table 26: Brazil Squeeze Bottle Volume (K) Forecast, by Application 2020 & 2033
- Table 27: Argentina Squeeze Bottle Revenue (undefined) Forecast, by Application 2020 & 2033
- Table 28: Argentina Squeeze Bottle Volume (K) Forecast, by Application 2020 & 2033
- Table 29: Rest of South America Squeeze Bottle Revenue (undefined) Forecast, by Application 2020 & 2033
- Table 30: Rest of South America Squeeze Bottle Volume (K) Forecast, by Application 2020 & 2033
- Table 31: Global Squeeze Bottle Revenue undefined Forecast, by Application 2020 & 2033
- Table 32: Global Squeeze Bottle Volume K Forecast, by Application 2020 & 2033
- Table 33: Global Squeeze Bottle Revenue undefined Forecast, by Types 2020 & 2033
- Table 34: Global Squeeze Bottle Volume K Forecast, by Types 2020 & 2033
- Table 35: Global Squeeze Bottle Revenue undefined Forecast, by Country 2020 & 2033
- Table 36: Global Squeeze Bottle Volume K Forecast, by Country 2020 & 2033
- Table 37: United Kingdom Squeeze Bottle Revenue (undefined) Forecast, by Application 2020 & 2033
- Table 38: United Kingdom Squeeze Bottle Volume (K) Forecast, by Application 2020 & 2033
- Table 39: Germany Squeeze Bottle Revenue (undefined) Forecast, by Application 2020 & 2033
- Table 40: Germany Squeeze Bottle Volume (K) Forecast, by Application 2020 & 2033
- Table 41: France Squeeze Bottle Revenue (undefined) Forecast, by Application 2020 & 2033
- Table 42: France Squeeze Bottle Volume (K) Forecast, by Application 2020 & 2033
- Table 43: Italy Squeeze Bottle Revenue (undefined) Forecast, by Application 2020 & 2033
- Table 44: Italy Squeeze Bottle Volume (K) Forecast, by Application 2020 & 2033
- Table 45: Spain Squeeze Bottle Revenue (undefined) Forecast, by Application 2020 & 2033
- Table 46: Spain Squeeze Bottle Volume (K) Forecast, by Application 2020 & 2033
- Table 47: Russia Squeeze Bottle Revenue (undefined) Forecast, by Application 2020 & 2033
- Table 48: Russia Squeeze Bottle Volume (K) Forecast, by Application 2020 & 2033
- Table 49: Benelux Squeeze Bottle Revenue (undefined) Forecast, by Application 2020 & 2033
- Table 50: Benelux Squeeze Bottle Volume (K) Forecast, by Application 2020 & 2033
- Table 51: Nordics Squeeze Bottle Revenue (undefined) Forecast, by Application 2020 & 2033
- Table 52: Nordics Squeeze Bottle Volume (K) Forecast, by Application 2020 & 2033
- Table 53: Rest of Europe Squeeze Bottle Revenue (undefined) Forecast, by Application 2020 & 2033
- Table 54: Rest of Europe Squeeze Bottle Volume (K) Forecast, by Application 2020 & 2033
- Table 55: Global Squeeze Bottle Revenue undefined Forecast, by Application 2020 & 2033
- Table 56: Global Squeeze Bottle Volume K Forecast, by Application 2020 & 2033
- Table 57: Global Squeeze Bottle Revenue undefined Forecast, by Types 2020 & 2033
- Table 58: Global Squeeze Bottle Volume K Forecast, by Types 2020 & 2033
- Table 59: Global Squeeze Bottle Revenue undefined Forecast, by Country 2020 & 2033
- Table 60: Global Squeeze Bottle Volume K Forecast, by Country 2020 & 2033
- Table 61: Turkey Squeeze Bottle Revenue (undefined) Forecast, by Application 2020 & 2033
- Table 62: Turkey Squeeze Bottle Volume (K) Forecast, by Application 2020 & 2033
- Table 63: Israel Squeeze Bottle Revenue (undefined) Forecast, by Application 2020 & 2033
- Table 64: Israel Squeeze Bottle Volume (K) Forecast, by Application 2020 & 2033
- Table 65: GCC Squeeze Bottle Revenue (undefined) Forecast, by Application 2020 & 2033
- Table 66: GCC Squeeze Bottle Volume (K) Forecast, by Application 2020 & 2033
- Table 67: North Africa Squeeze Bottle Revenue (undefined) Forecast, by Application 2020 & 2033
- Table 68: North Africa Squeeze Bottle Volume (K) Forecast, by Application 2020 & 2033
- Table 69: South Africa Squeeze Bottle Revenue (undefined) Forecast, by Application 2020 & 2033
- Table 70: South Africa Squeeze Bottle Volume (K) Forecast, by Application 2020 & 2033
- Table 71: Rest of Middle East & Africa Squeeze Bottle Revenue (undefined) Forecast, by Application 2020 & 2033
- Table 72: Rest of Middle East & Africa Squeeze Bottle Volume (K) Forecast, by Application 2020 & 2033
- Table 73: Global Squeeze Bottle Revenue undefined Forecast, by Application 2020 & 2033
- Table 74: Global Squeeze Bottle Volume K Forecast, by Application 2020 & 2033
- Table 75: Global Squeeze Bottle Revenue undefined Forecast, by Types 2020 & 2033
- Table 76: Global Squeeze Bottle Volume K Forecast, by Types 2020 & 2033
- Table 77: Global Squeeze Bottle Revenue undefined Forecast, by Country 2020 & 2033
- Table 78: Global Squeeze Bottle Volume K Forecast, by Country 2020 & 2033
- Table 79: China Squeeze Bottle Revenue (undefined) Forecast, by Application 2020 & 2033
- Table 80: China Squeeze Bottle Volume (K) Forecast, by Application 2020 & 2033
- Table 81: India Squeeze Bottle Revenue (undefined) Forecast, by Application 2020 & 2033
- Table 82: India Squeeze Bottle Volume (K) Forecast, by Application 2020 & 2033
- Table 83: Japan Squeeze Bottle Revenue (undefined) Forecast, by Application 2020 & 2033
- Table 84: Japan Squeeze Bottle Volume (K) Forecast, by Application 2020 & 2033
- Table 85: South Korea Squeeze Bottle Revenue (undefined) Forecast, by Application 2020 & 2033
- Table 86: South Korea Squeeze Bottle Volume (K) Forecast, by Application 2020 & 2033
- Table 87: ASEAN Squeeze Bottle Revenue (undefined) Forecast, by Application 2020 & 2033
- Table 88: ASEAN Squeeze Bottle Volume (K) Forecast, by Application 2020 & 2033
- Table 89: Oceania Squeeze Bottle Revenue (undefined) Forecast, by Application 2020 & 2033
- Table 90: Oceania Squeeze Bottle Volume (K) Forecast, by Application 2020 & 2033
- Table 91: Rest of Asia Pacific Squeeze Bottle Revenue (undefined) Forecast, by Application 2020 & 2033
- Table 92: Rest of Asia Pacific Squeeze Bottle Volume (K) Forecast, by Application 2020 & 2033
Frequently Asked Questions
1. What is the projected Compound Annual Growth Rate (CAGR) of the Squeeze Bottle?
The projected CAGR is approximately 7.2%.
2. Which companies are prominent players in the Squeeze Bottle?
Key companies in the market include Genesis Industries,Inc., IonWays,LLC, Midland Manufacturing Company,Inc., Kyoraku Co.,Ltd., The Original Squeeze Company, Suzhou Innovation Packaging Materials Co., Ltd, Illing Company, Inc., Kaufman Container Company.
3. What are the main segments of the Squeeze Bottle?
The market segments include Application, Types.
4. Can you provide details about the market size?
The market size is estimated to be USD XXX N/A as of 2022.
5. What are some drivers contributing to market growth?
N/A
6. What are the notable trends driving market growth?
N/A
7. Are there any restraints impacting market growth?
N/A
8. Can you provide examples of recent developments in the market?
N/A
9. What pricing options are available for accessing the report?
Pricing options include single-user, multi-user, and enterprise licenses priced at USD 3350.00, USD 5025.00, and USD 6700.00 respectively.
10. Is the market size provided in terms of value or volume?
The market size is provided in terms of value, measured in N/A and volume, measured in K.
11. Are there any specific market keywords associated with the report?
Yes, the market keyword associated with the report is "Squeeze Bottle," which aids in identifying and referencing the specific market segment covered.
12. How do I determine which pricing option suits my needs best?
The pricing options vary based on user requirements and access needs. Individual users may opt for single-user licenses, while businesses requiring broader access may choose multi-user or enterprise licenses for cost-effective access to the report.
13. Are there any additional resources or data provided in the Squeeze Bottle report?
While the report offers comprehensive insights, it's advisable to review the specific contents or supplementary materials provided to ascertain if additional resources or data are available.
14. How can I stay updated on further developments or reports in the Squeeze Bottle?
To stay informed about further developments, trends, and reports in the Squeeze Bottle, consider subscribing to industry newsletters, following relevant companies and organizations, or regularly checking reputable industry news sources and publications.
Methodology
Step 1 - Identification of Relevant Samples Size from Population Database


Step 2 - Approaches for Defining Global Market Size (Value, Volume* & Price*)

Note*: In applicable scenarios
Step 3 - Data Sources
Primary Research
- Web Analytics
- Survey Reports
- Research Institute
- Latest Research Reports
- Opinion Leaders
Secondary Research
- Annual Reports
- White Paper
- Latest Press Release
- Industry Association
- Paid Database
- Investor Presentations

Step 4 - Data Triangulation
Involves using different sources of information in order to increase the validity of a study
These sources are likely to be stakeholders in a program - participants, other researchers, program staff, other community members, and so on.
Then we put all data in single framework & apply various statistical tools to find out the dynamic on the market.
During the analysis stage, feedback from the stakeholder groups would be compared to determine areas of agreement as well as areas of divergence