

Key Insights
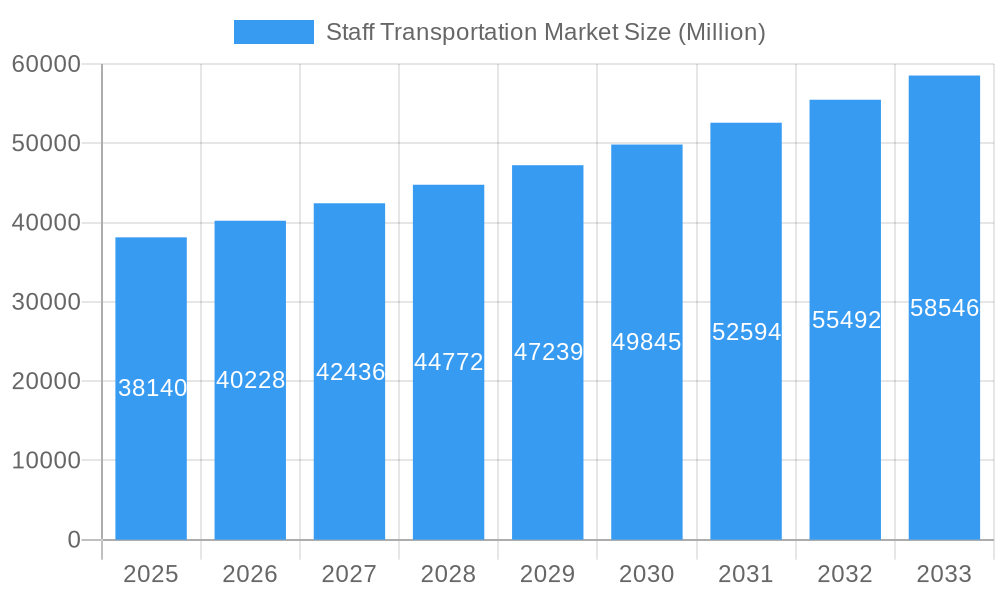
The global staff transportation market, valued at $38.14 billion in 2025, is projected to experience robust growth, driven by a compound annual growth rate (CAGR) of 5.34% from 2025 to 2033. This expansion is fueled by several key factors. The increasing adoption of Mobility as a Service (MaaS) solutions offers companies cost-effective and efficient employee transportation, reducing individual commuting burdens and promoting sustainability. Furthermore, the growth of the SaaS segment simplifies fleet management and route optimization, contributing to operational efficiency and cost savings for businesses. The rising demand for outsourced transportation services, particularly in urban areas with congested traffic, further bolsters market growth. This trend allows companies to focus on core operations while entrusting staff transportation to specialized providers. Different passenger vehicle types, including cars, vans, and buses, cater to varying organizational needs and employee numbers. While company-owned transportation services remain prevalent, the rental and pick-and-drop segments are gaining traction, offering flexible solutions for short-term needs and event transportation. Geographical expansion, particularly in developing economies with rapidly growing urban populations, presents significant opportunities for market players. However, challenges such as fluctuating fuel prices, regulatory complexities, and the need for robust safety and security measures represent potential restraints on market growth.
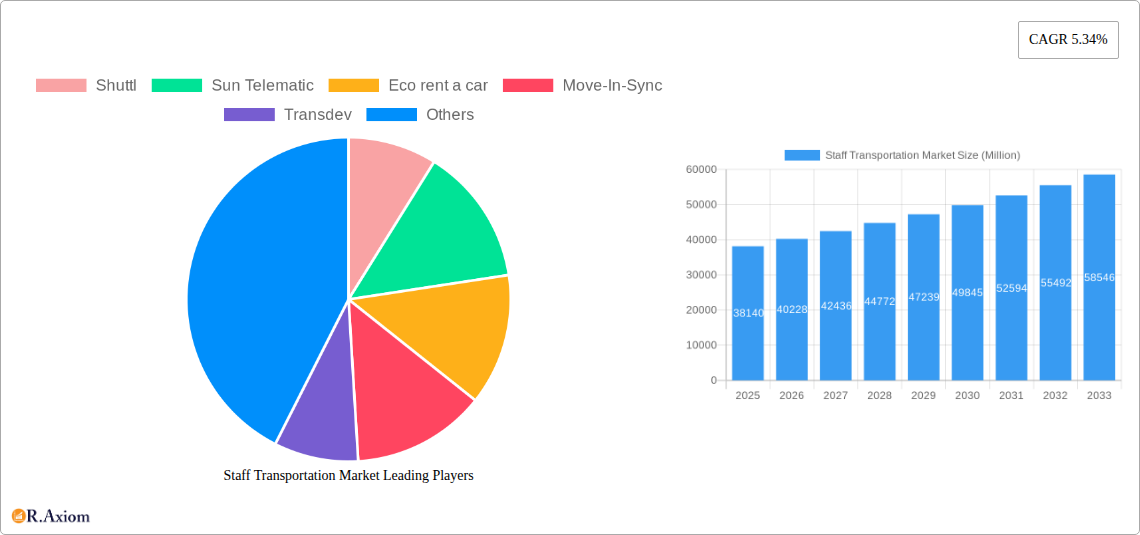
Staff Transportation Market Market Size (In Billion)
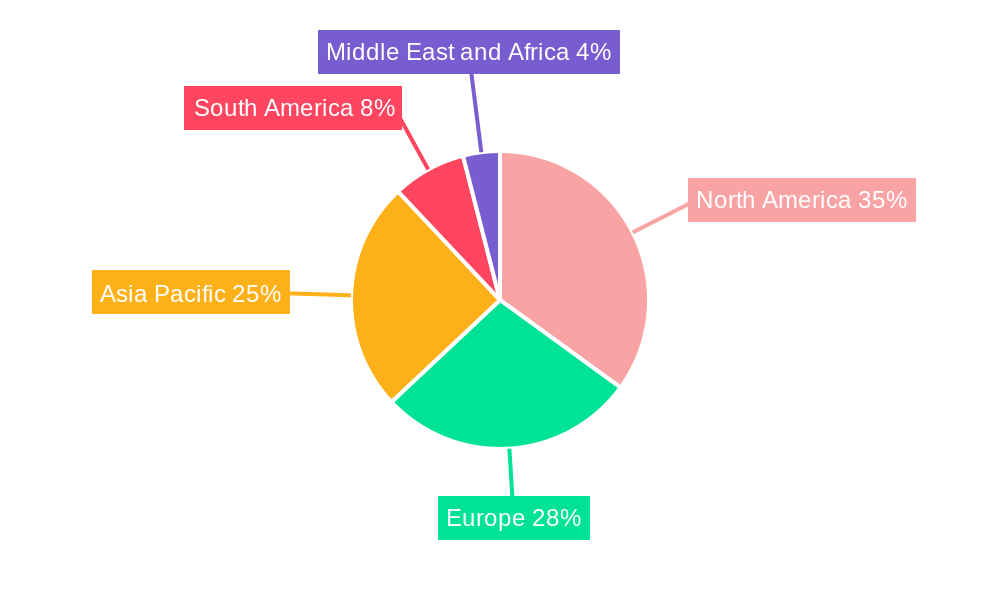
The market segmentation highlights diverse options available to businesses. The MaaS segment is gaining significant traction as companies seek integrated and efficient solutions. The preference for outsourced transportation services is driven by cost optimization and improved operational efficiency. Within passenger vehicle types, the choice varies depending on the scale and nature of the workforce and the distance employees need to commute. Regional variations reflect different levels of urbanization, economic development, and government regulations. North America and Europe currently hold significant market share, but the Asia-Pacific region is expected to show considerable growth due to rapid urbanization and economic expansion. The historical period (2019-2024) likely saw slower growth compared to the projected forecast period (2025-2033), reflecting the impact of global events and evolving business preferences. Companies are increasingly focusing on employee well-being and offering attractive commuting options as part of their employee benefits packages, which is a key factor driving market growth.
Staff Transportation Market Company Market Share
Staff Transportation Market: A Comprehensive Report (2019-2033)
This in-depth report provides a comprehensive analysis of the Staff Transportation Market, covering the period 2019-2033, with a focus on market size, segmentation, key players, and future growth potential. The report incorporates detailed insights into industry trends, technological advancements, and competitive dynamics, offering invaluable data for stakeholders seeking to navigate this evolving landscape. The base year for the analysis is 2025, with estimations for 2025 and forecasts extending to 2033.
Staff Transportation Market Concentration & Innovation
This section analyzes the competitive landscape of the Staff Transportation Market, examining market concentration, innovation drivers, regulatory frameworks, and M&A activities. The market is characterized by a mix of large multinational corporations and smaller, specialized providers. Market share data reveals a moderately concentrated market, with the top 5 players accounting for approximately xx% of the global revenue in 2024. Innovation is driven by the need for efficient, sustainable, and technologically advanced transportation solutions. The increasing adoption of MaaS and SaaS platforms is a significant driver of innovation. Regulatory frameworks vary across regions, impacting operational costs and service offerings. Product substitutes, such as private vehicle usage and ride-hailing services, pose a competitive threat, while the increasing prevalence of electric vehicles presents both opportunities and challenges.
- Market Concentration: Top 5 players holding approximately xx% of global market share in 2024.
- M&A Activity: A total of xx M&A deals valued at approximately $xx Million were recorded between 2019 and 2024. This highlights the strategic importance of consolidation and expansion within the market.
- Innovation Drivers: Technological advancements in electric vehicles, MaaS platforms, and route optimization software are key drivers.
- Regulatory Frameworks: Vary widely across geographical regions, influencing operational costs and service models.
- End-User Trends: Growing demand for sustainable and convenient transportation options amongst employees.
Staff Transportation Market Industry Trends & Insights
The Staff Transportation Market is experiencing robust growth, driven by several key factors. The increasing urbanization and concentration of workplaces in metropolitan areas is fueling demand for efficient and reliable transportation solutions. The rising adoption of flexible work arrangements and the increasing focus on employee well-being are also contributing to market expansion. Technological disruptions, particularly in the areas of electric vehicles and data analytics, are reshaping the industry. Consumer preferences are shifting towards sustainable and technologically advanced transportation options, leading to increased demand for electric buses and MaaS platforms. Competitive dynamics are characterized by intense competition amongst established players and the emergence of new entrants, particularly in the MaaS segment. The market is estimated to grow at a CAGR of xx% from 2025 to 2033, with a market penetration rate reaching xx% by 2033.
Dominant Markets & Segments in Staff Transportation Market
The North American region currently dominates the Staff Transportation Market, driven by high corporate density, robust economic growth, and favorable regulatory environments. Within the service type segment, MaaS is exhibiting significant growth potential due to its flexibility and scalability. The outsourced transportation service segment holds a substantial market share, reflecting the increasing preference for outsourcing logistical complexities. Buses dominate the passenger vehicle type segment owing to their high passenger capacity and cost-effectiveness for large-scale employee transportation.
Key Drivers of Regional Dominance (North America):
- Strong economic growth and high corporate concentration.
- Supportive government policies promoting efficient transportation solutions.
- Developed infrastructure facilitating seamless operations.
Dominant Segments:
- Service Type: MaaS is showing rapid growth due to its scalable nature.
- Ownership: Outsourced Transportation Services holds a significant market share due to cost efficiency and management simplification.
- Passenger Vehicle Type: Buses are the most prevalent due to higher passenger capacity.
Staff Transportation Market Product Developments
Recent product innovations focus on enhancing efficiency, sustainability, and passenger comfort. The introduction of electric buses, such as the Switch Mobility EiV12, is a significant development, addressing environmental concerns and reducing operational costs. Advancements in route optimization software and real-time tracking systems enhance operational efficiency and improve passenger experience. These innovations cater to the increasing demand for sustainable and technologically advanced transportation solutions, creating a strong market fit.
Report Scope & Segmentation Analysis
This report segments the Staff Transportation Market by service type (MaaS, SaaS), ownership (company-owned, outsourced, rentals), and passenger vehicle type (cars, vans, buses). Each segment is analyzed in detail, providing market size estimations, growth projections, and competitive dynamics. The MaaS segment is projected to exhibit the highest growth rate, driven by increasing demand for flexible and on-demand transportation solutions. The outsourced transportation service segment is expected to maintain its dominant position due to cost-effectiveness. The bus segment holds a significant share in passenger vehicle type due to its suitability for large-scale employee transportation.
Key Drivers of Staff Transportation Market Growth
The Staff Transportation Market is propelled by several key drivers, including increasing urbanization, the growth of corporate sectors, and rising demand for efficient and eco-friendly transportation solutions. Government initiatives promoting sustainable transport and improved infrastructure also contribute to market expansion. Technological advancements, such as electric vehicles and intelligent transportation systems, further fuel market growth.
Challenges in the Staff Transportation Market Sector
The Staff Transportation Market faces challenges such as fluctuating fuel prices, stringent regulatory requirements, and intense competition among service providers. Supply chain disruptions and driver shortages can also affect operational efficiency. These factors impact profitability and necessitate strategic adaptation from market players. The total impact of these challenges is estimated to reduce market growth by approximately xx% by 2033.
Emerging Opportunities in Staff Transportation Market
The market presents significant opportunities for growth, particularly in developing economies with expanding corporate sectors. The increasing adoption of electric vehicles and the growing demand for MaaS solutions create significant potential for new market entrants. The integration of advanced technologies, such as AI-powered route optimization and real-time passenger tracking, offers considerable scope for improvement.
Key Developments in Staff Transportation Market Industry
- December 2021: Transdev launched the largest electric bus fleet in the Nordic region (145 buses). This significantly increased the market presence of electric buses in the staff transportation sector.
- September 2021: Uber India launched a corporate shuttle service, expanding the options available to companies for employee transportation.
- June 2022: Switch Mobility unveiled the EiV12 electric bus, aiming to capture a significant share of the electric vehicle market for staff transportation. This indicates a growing focus on sustainable solutions within the industry.
Strategic Outlook for Staff Transportation Market Market
The Staff Transportation Market is poised for continued growth, driven by technological advancements, increasing urbanization, and a growing emphasis on sustainable transportation. Opportunities exist in expanding into new markets, developing innovative service models, and leveraging data analytics to enhance operational efficiency. The market's future success hinges on adapting to evolving consumer preferences and regulatory landscapes.
Staff Transportation Market Segmentation
-
1. Ownership
- 1.1. Company-owned Transportation Service
- 1.2. Outsourced Transportation Service
- 1.3. Rentals
- 1.4. Pick and Drop Transportation Service
-
2. Passenger Vehicle Type
- 2.1. Cars
- 2.2. Vans
- 2.3. Bus
-
3. Service Type
- 3.1. Mobility as a Service (MaaS)
- 3.2. Software as a Service (SaaS)
Staff Transportation Market Segmentation By Geography
-
1. North America
- 1.1. United States
- 1.2. Canada
- 1.3. Rest of North America
-
2. Europe
- 2.1. Germany
- 2.2. United Kingdom
- 2.3. France
- 2.4. Rest of Europe
-
3. Asia Pacific
- 3.1. India
- 3.2. China
- 3.3. Japan
- 3.4. Rest of Asia Pacific
-
4. South America
- 4.1. Brazil
- 4.2. Argentina
- 4.3. Rest of the South America
-
5. Middle East and Africa
- 5.1. United Arab Emirates
- 5.2. Saudi Arabia
- 5.3. Rest of the Middle East and Africa
Staff Transportation Market Regional Market Share
Geographic Coverage of Staff Transportation Market
Staff Transportation Market REPORT HIGHLIGHTS
| Aspects | Details |
|---|---|
| Study Period | 2020-2034 |
| Base Year | 2025 |
| Estimated Year | 2026 |
| Forecast Period | 2026-2034 |
| Historical Period | 2020-2025 |
| Growth Rate | CAGR of 5.34% from 2020-2034 |
| Segmentation |
|
Table of Contents
- 1. Introduction
- 1.1. Research Scope
- 1.2. Market Segmentation
- 1.3. Research Objective
- 1.4. Definitions and Assumptions
- 2. Executive Summary
- 2.1. Market Snapshot
- 3. Market Dynamics
- 3.1. Market Drivers
- 3.2. Market Restrains
- 3.3. Market Trends
- 3.4. Market Opportunities
- 4. Market Factor Analysis
- 4.1. Porters Five Forces
- 4.1.1. Bargaining Power of Suppliers
- 4.1.2. Bargaining Power of Buyers
- 4.1.3. Threat of New Entrants
- 4.1.4. Threat of Substitutes
- 4.1.5. Competitive Rivalry
- 4.2. PESTEL analysis
- 4.3. BCG Analysis
- 4.3.1. Stars (High Growth, High Market Share)
- 4.3.2. Cash Cows (Low Growth, High Market Share)
- 4.3.3. Question Mark (High Growth, Low Market Share)
- 4.3.4. Dogs (Low Growth, Low Market Share)
- 4.4. Ansoff Matrix Analysis
- 4.5. Supply Chain Analysis
- 4.6. Regulatory Landscape
- 4.7. Current Market Potential and Opportunity Assessment (TAM–SAM–SOM Framework)
- 4.8. RAX Analyst Note
- 4.1. Porters Five Forces
- 5. Market Analysis, Insights and Forecast 2021-2033
- 5.1. Market Analysis, Insights and Forecast - by Ownership
- 5.1.1. Company-owned Transportation Service
- 5.1.2. Outsourced Transportation Service
- 5.1.3. Rentals
- 5.1.4. Pick and Drop Transportation Service
- 5.2. Market Analysis, Insights and Forecast - by Passenger Vehicle Type
- 5.2.1. Cars
- 5.2.2. Vans
- 5.2.3. Bus
- 5.3. Market Analysis, Insights and Forecast - by Service Type
- 5.3.1. Mobility as a Service (MaaS)
- 5.3.2. Software as a Service (SaaS)
- 5.4. Market Analysis, Insights and Forecast - by Region
- 5.4.1. North America
- 5.4.2. Europe
- 5.4.3. Asia Pacific
- 5.4.4. South America
- 5.4.5. Middle East and Africa
- 5.1. Market Analysis, Insights and Forecast - by Ownership
- 6. Global Staff Transportation Market Analysis, Insights and Forecast, 2021-2033
- 6.1. Market Analysis, Insights and Forecast - by Ownership
- 6.1.1. Company-owned Transportation Service
- 6.1.2. Outsourced Transportation Service
- 6.1.3. Rentals
- 6.1.4. Pick and Drop Transportation Service
- 6.2. Market Analysis, Insights and Forecast - by Passenger Vehicle Type
- 6.2.1. Cars
- 6.2.2. Vans
- 6.2.3. Bus
- 6.3. Market Analysis, Insights and Forecast - by Service Type
- 6.3.1. Mobility as a Service (MaaS)
- 6.3.2. Software as a Service (SaaS)
- 6.1. Market Analysis, Insights and Forecast - by Ownership
- 7. North America Staff Transportation Market Analysis, Insights and Forecast, 2020-2032
- 7.1. Market Analysis, Insights and Forecast - by Ownership
- 7.1.1. Company-owned Transportation Service
- 7.1.2. Outsourced Transportation Service
- 7.1.3. Rentals
- 7.1.4. Pick and Drop Transportation Service
- 7.2. Market Analysis, Insights and Forecast - by Passenger Vehicle Type
- 7.2.1. Cars
- 7.2.2. Vans
- 7.2.3. Bus
- 7.3. Market Analysis, Insights and Forecast - by Service Type
- 7.3.1. Mobility as a Service (MaaS)
- 7.3.2. Software as a Service (SaaS)
- 7.1. Market Analysis, Insights and Forecast - by Ownership
- 8. Europe Staff Transportation Market Analysis, Insights and Forecast, 2020-2032
- 8.1. Market Analysis, Insights and Forecast - by Ownership
- 8.1.1. Company-owned Transportation Service
- 8.1.2. Outsourced Transportation Service
- 8.1.3. Rentals
- 8.1.4. Pick and Drop Transportation Service
- 8.2. Market Analysis, Insights and Forecast - by Passenger Vehicle Type
- 8.2.1. Cars
- 8.2.2. Vans
- 8.2.3. Bus
- 8.3. Market Analysis, Insights and Forecast - by Service Type
- 8.3.1. Mobility as a Service (MaaS)
- 8.3.2. Software as a Service (SaaS)
- 8.1. Market Analysis, Insights and Forecast - by Ownership
- 9. Asia Pacific Staff Transportation Market Analysis, Insights and Forecast, 2020-2032
- 9.1. Market Analysis, Insights and Forecast - by Ownership
- 9.1.1. Company-owned Transportation Service
- 9.1.2. Outsourced Transportation Service
- 9.1.3. Rentals
- 9.1.4. Pick and Drop Transportation Service
- 9.2. Market Analysis, Insights and Forecast - by Passenger Vehicle Type
- 9.2.1. Cars
- 9.2.2. Vans
- 9.2.3. Bus
- 9.3. Market Analysis, Insights and Forecast - by Service Type
- 9.3.1. Mobility as a Service (MaaS)
- 9.3.2. Software as a Service (SaaS)
- 9.1. Market Analysis, Insights and Forecast - by Ownership
- 10. South America Staff Transportation Market Analysis, Insights and Forecast, 2020-2032
- 10.1. Market Analysis, Insights and Forecast - by Ownership
- 10.1.1. Company-owned Transportation Service
- 10.1.2. Outsourced Transportation Service
- 10.1.3. Rentals
- 10.1.4. Pick and Drop Transportation Service
- 10.2. Market Analysis, Insights and Forecast - by Passenger Vehicle Type
- 10.2.1. Cars
- 10.2.2. Vans
- 10.2.3. Bus
- 10.3. Market Analysis, Insights and Forecast - by Service Type
- 10.3.1. Mobility as a Service (MaaS)
- 10.3.2. Software as a Service (SaaS)
- 10.1. Market Analysis, Insights and Forecast - by Ownership
- 11. Middle East and Africa Staff Transportation Market Analysis, Insights and Forecast, 2020-2032
- 11.1. Market Analysis, Insights and Forecast - by Ownership
- 11.1.1. Company-owned Transportation Service
- 11.1.2. Outsourced Transportation Service
- 11.1.3. Rentals
- 11.1.4. Pick and Drop Transportation Service
- 11.2. Market Analysis, Insights and Forecast - by Passenger Vehicle Type
- 11.2.1. Cars
- 11.2.2. Vans
- 11.2.3. Bus
- 11.3. Market Analysis, Insights and Forecast - by Service Type
- 11.3.1. Mobility as a Service (MaaS)
- 11.3.2. Software as a Service (SaaS)
- 11.1. Market Analysis, Insights and Forecast - by Ownership
- 12. Competitive Analysis
- 12.1. Company Profiles
- 12.1.1 Shuttl
- 12.1.1.1. Company Overview
- 12.1.1.2. Products
- 12.1.1.3. Company Financials
- 12.1.1.4. SWOT Analysis
- 12.1.2 Sun Telematic
- 12.1.2.1. Company Overview
- 12.1.2.2. Products
- 12.1.2.3. Company Financials
- 12.1.2.4. SWOT Analysis
- 12.1.3 Eco rent a car
- 12.1.3.1. Company Overview
- 12.1.3.2. Products
- 12.1.3.3. Company Financials
- 12.1.3.4. SWOT Analysis
- 12.1.4 Move-In-Sync
- 12.1.4.1. Company Overview
- 12.1.4.2. Products
- 12.1.4.3. Company Financials
- 12.1.4.4. SWOT Analysis
- 12.1.5 Transdev
- 12.1.5.1. Company Overview
- 12.1.5.2. Products
- 12.1.5.3. Company Financials
- 12.1.5.4. SWOT Analysis
- 12.1.6 Prairie Bus Line Limited
- 12.1.6.1. Company Overview
- 12.1.6.2. Products
- 12.1.6.3. Company Financials
- 12.1.6.4. SWOT Analysis
- 12.1.7 Janani Tours
- 12.1.7.1. Company Overview
- 12.1.7.2. Products
- 12.1.7.3. Company Financials
- 12.1.7.4. SWOT Analysis
- 12.1.8 Busbank (Global Charter Services Ltd )
- 12.1.8.1. Company Overview
- 12.1.8.2. Products
- 12.1.8.3. Company Financials
- 12.1.8.4. SWOT Analysis
- 12.1.9 First Class Tours
- 12.1.9.1. Company Overview
- 12.1.9.2. Products
- 12.1.9.3. Company Financials
- 12.1.9.4. SWOT Analysis
- 12.1.1 Shuttl
- 12.2. Market Entropy
- 12.2.1 Company's Key Areas Served
- 12.2.2 Recent Developments
- 12.3. Company Market Share Analysis 2025
- 12.3.1 Top 5 Companies Market Share Analysis
- 12.3.2 Top 3 Companies Market Share Analysis
- 12.4. List of Potential Customers
- 13. Research Methodology
List of Figures
- Figure 1: Global Staff Transportation Market Revenue Breakdown (Million, %) by Region 2025 & 2033
- Figure 2: North America Staff Transportation Market Revenue (Million), by Ownership 2025 & 2033
- Figure 3: North America Staff Transportation Market Revenue Share (%), by Ownership 2025 & 2033
- Figure 4: North America Staff Transportation Market Revenue (Million), by Passenger Vehicle Type 2025 & 2033
- Figure 5: North America Staff Transportation Market Revenue Share (%), by Passenger Vehicle Type 2025 & 2033
- Figure 6: North America Staff Transportation Market Revenue (Million), by Service Type 2025 & 2033
- Figure 7: North America Staff Transportation Market Revenue Share (%), by Service Type 2025 & 2033
- Figure 8: North America Staff Transportation Market Revenue (Million), by Country 2025 & 2033
- Figure 9: North America Staff Transportation Market Revenue Share (%), by Country 2025 & 2033
- Figure 10: Europe Staff Transportation Market Revenue (Million), by Ownership 2025 & 2033
- Figure 11: Europe Staff Transportation Market Revenue Share (%), by Ownership 2025 & 2033
- Figure 12: Europe Staff Transportation Market Revenue (Million), by Passenger Vehicle Type 2025 & 2033
- Figure 13: Europe Staff Transportation Market Revenue Share (%), by Passenger Vehicle Type 2025 & 2033
- Figure 14: Europe Staff Transportation Market Revenue (Million), by Service Type 2025 & 2033
- Figure 15: Europe Staff Transportation Market Revenue Share (%), by Service Type 2025 & 2033
- Figure 16: Europe Staff Transportation Market Revenue (Million), by Country 2025 & 2033
- Figure 17: Europe Staff Transportation Market Revenue Share (%), by Country 2025 & 2033
- Figure 18: Asia Pacific Staff Transportation Market Revenue (Million), by Ownership 2025 & 2033
- Figure 19: Asia Pacific Staff Transportation Market Revenue Share (%), by Ownership 2025 & 2033
- Figure 20: Asia Pacific Staff Transportation Market Revenue (Million), by Passenger Vehicle Type 2025 & 2033
- Figure 21: Asia Pacific Staff Transportation Market Revenue Share (%), by Passenger Vehicle Type 2025 & 2033
- Figure 22: Asia Pacific Staff Transportation Market Revenue (Million), by Service Type 2025 & 2033
- Figure 23: Asia Pacific Staff Transportation Market Revenue Share (%), by Service Type 2025 & 2033
- Figure 24: Asia Pacific Staff Transportation Market Revenue (Million), by Country 2025 & 2033
- Figure 25: Asia Pacific Staff Transportation Market Revenue Share (%), by Country 2025 & 2033
- Figure 26: South America Staff Transportation Market Revenue (Million), by Ownership 2025 & 2033
- Figure 27: South America Staff Transportation Market Revenue Share (%), by Ownership 2025 & 2033
- Figure 28: South America Staff Transportation Market Revenue (Million), by Passenger Vehicle Type 2025 & 2033
- Figure 29: South America Staff Transportation Market Revenue Share (%), by Passenger Vehicle Type 2025 & 2033
- Figure 30: South America Staff Transportation Market Revenue (Million), by Service Type 2025 & 2033
- Figure 31: South America Staff Transportation Market Revenue Share (%), by Service Type 2025 & 2033
- Figure 32: South America Staff Transportation Market Revenue (Million), by Country 2025 & 2033
- Figure 33: South America Staff Transportation Market Revenue Share (%), by Country 2025 & 2033
- Figure 34: Middle East and Africa Staff Transportation Market Revenue (Million), by Ownership 2025 & 2033
- Figure 35: Middle East and Africa Staff Transportation Market Revenue Share (%), by Ownership 2025 & 2033
- Figure 36: Middle East and Africa Staff Transportation Market Revenue (Million), by Passenger Vehicle Type 2025 & 2033
- Figure 37: Middle East and Africa Staff Transportation Market Revenue Share (%), by Passenger Vehicle Type 2025 & 2033
- Figure 38: Middle East and Africa Staff Transportation Market Revenue (Million), by Service Type 2025 & 2033
- Figure 39: Middle East and Africa Staff Transportation Market Revenue Share (%), by Service Type 2025 & 2033
- Figure 40: Middle East and Africa Staff Transportation Market Revenue (Million), by Country 2025 & 2033
- Figure 41: Middle East and Africa Staff Transportation Market Revenue Share (%), by Country 2025 & 2033
List of Tables
- Table 1: Global Staff Transportation Market Revenue Million Forecast, by Ownership 2020 & 2033
- Table 2: Global Staff Transportation Market Revenue Million Forecast, by Passenger Vehicle Type 2020 & 2033
- Table 3: Global Staff Transportation Market Revenue Million Forecast, by Service Type 2020 & 2033
- Table 4: Global Staff Transportation Market Revenue Million Forecast, by Region 2020 & 2033
- Table 5: Global Staff Transportation Market Revenue Million Forecast, by Ownership 2020 & 2033
- Table 6: Global Staff Transportation Market Revenue Million Forecast, by Passenger Vehicle Type 2020 & 2033
- Table 7: Global Staff Transportation Market Revenue Million Forecast, by Service Type 2020 & 2033
- Table 8: Global Staff Transportation Market Revenue Million Forecast, by Country 2020 & 2033
- Table 9: United States Staff Transportation Market Revenue (Million) Forecast, by Application 2020 & 2033
- Table 10: Canada Staff Transportation Market Revenue (Million) Forecast, by Application 2020 & 2033
- Table 11: Rest of North America Staff Transportation Market Revenue (Million) Forecast, by Application 2020 & 2033
- Table 12: Global Staff Transportation Market Revenue Million Forecast, by Ownership 2020 & 2033
- Table 13: Global Staff Transportation Market Revenue Million Forecast, by Passenger Vehicle Type 2020 & 2033
- Table 14: Global Staff Transportation Market Revenue Million Forecast, by Service Type 2020 & 2033
- Table 15: Global Staff Transportation Market Revenue Million Forecast, by Country 2020 & 2033
- Table 16: Germany Staff Transportation Market Revenue (Million) Forecast, by Application 2020 & 2033
- Table 17: United Kingdom Staff Transportation Market Revenue (Million) Forecast, by Application 2020 & 2033
- Table 18: France Staff Transportation Market Revenue (Million) Forecast, by Application 2020 & 2033
- Table 19: Rest of Europe Staff Transportation Market Revenue (Million) Forecast, by Application 2020 & 2033
- Table 20: Global Staff Transportation Market Revenue Million Forecast, by Ownership 2020 & 2033
- Table 21: Global Staff Transportation Market Revenue Million Forecast, by Passenger Vehicle Type 2020 & 2033
- Table 22: Global Staff Transportation Market Revenue Million Forecast, by Service Type 2020 & 2033
- Table 23: Global Staff Transportation Market Revenue Million Forecast, by Country 2020 & 2033
- Table 24: India Staff Transportation Market Revenue (Million) Forecast, by Application 2020 & 2033
- Table 25: China Staff Transportation Market Revenue (Million) Forecast, by Application 2020 & 2033
- Table 26: Japan Staff Transportation Market Revenue (Million) Forecast, by Application 2020 & 2033
- Table 27: Rest of Asia Pacific Staff Transportation Market Revenue (Million) Forecast, by Application 2020 & 2033
- Table 28: Global Staff Transportation Market Revenue Million Forecast, by Ownership 2020 & 2033
- Table 29: Global Staff Transportation Market Revenue Million Forecast, by Passenger Vehicle Type 2020 & 2033
- Table 30: Global Staff Transportation Market Revenue Million Forecast, by Service Type 2020 & 2033
- Table 31: Global Staff Transportation Market Revenue Million Forecast, by Country 2020 & 2033
- Table 32: Brazil Staff Transportation Market Revenue (Million) Forecast, by Application 2020 & 2033
- Table 33: Argentina Staff Transportation Market Revenue (Million) Forecast, by Application 2020 & 2033
- Table 34: Rest of the South America Staff Transportation Market Revenue (Million) Forecast, by Application 2020 & 2033
- Table 35: Global Staff Transportation Market Revenue Million Forecast, by Ownership 2020 & 2033
- Table 36: Global Staff Transportation Market Revenue Million Forecast, by Passenger Vehicle Type 2020 & 2033
- Table 37: Global Staff Transportation Market Revenue Million Forecast, by Service Type 2020 & 2033
- Table 38: Global Staff Transportation Market Revenue Million Forecast, by Country 2020 & 2033
- Table 39: United Arab Emirates Staff Transportation Market Revenue (Million) Forecast, by Application 2020 & 2033
- Table 40: Saudi Arabia Staff Transportation Market Revenue (Million) Forecast, by Application 2020 & 2033
- Table 41: Rest of the Middle East and Africa Staff Transportation Market Revenue (Million) Forecast, by Application 2020 & 2033
Frequently Asked Questions
1. What is the projected Compound Annual Growth Rate (CAGR) of the Staff Transportation Market?
The projected CAGR is approximately 5.34%.
2. Which companies are prominent players in the Staff Transportation Market?
Key companies in the market include Shuttl, Sun Telematic, Eco rent a car, Move-In-Sync, Transdev, Prairie Bus Line Limited, Janani Tours, Busbank (Global Charter Services Ltd ), First Class Tours.
3. What are the main segments of the Staff Transportation Market?
The market segments include Ownership, Passenger Vehicle Type, Service Type.
4. Can you provide details about the market size?
The market size is estimated to be USD 38.14 Million as of 2022.
5. What are some drivers contributing to market growth?
Stringent Emission Regulations are Fueling the Market Growth.
6. What are the notable trends driving market growth?
Increasing Internet Usage and Technological Advancements to Drive Demand in the Market.
7. Are there any restraints impacting market growth?
High Cost of Electric Commercial Vehicle May Hamper the Growth.
8. Can you provide examples of recent developments in the market?
June 2022: Switch Mobility, the electric vehicle division of Hinduja Group flagship Ashok Leyland, unveiled the EiV12 electric bus, aiming to capture a significant share of the electric vehicle market with a slew of customer-friendly features. The company intends to serve inter-city, and intra-city, staff transportation with this launch.
9. What pricing options are available for accessing the report?
Pricing options include single-user, multi-user, and enterprise licenses priced at USD 4750, USD 5250, and USD 8750 respectively.
10. Is the market size provided in terms of value or volume?
The market size is provided in terms of value, measured in Million.
11. Are there any specific market keywords associated with the report?
Yes, the market keyword associated with the report is "Staff Transportation Market," which aids in identifying and referencing the specific market segment covered.
12. How do I determine which pricing option suits my needs best?
The pricing options vary based on user requirements and access needs. Individual users may opt for single-user licenses, while businesses requiring broader access may choose multi-user or enterprise licenses for cost-effective access to the report.
13. Are there any additional resources or data provided in the Staff Transportation Market report?
While the report offers comprehensive insights, it's advisable to review the specific contents or supplementary materials provided to ascertain if additional resources or data are available.
14. How can I stay updated on further developments or reports in the Staff Transportation Market?
To stay informed about further developments, trends, and reports in the Staff Transportation Market, consider subscribing to industry newsletters, following relevant companies and organizations, or regularly checking reputable industry news sources and publications.
Methodology
Step 1 - Identification of Relevant Samples Size from Population Database


Step 2 - Approaches for Defining Global Market Size (Value, Volume* & Price*)

Note*: In applicable scenarios
Step 3 - Data Sources
Primary Research
- Web Analytics
- Survey Reports
- Research Institute
- Latest Research Reports
- Opinion Leaders
Secondary Research
- Annual Reports
- White Paper
- Latest Press Release
- Industry Association
- Paid Database
- Investor Presentations

Step 4 - Data Triangulation
Involves using different sources of information in order to increase the validity of a study
These sources are likely to be stakeholders in a program - participants, other researchers, program staff, other community members, and so on.
Then we put all data in single framework & apply various statistical tools to find out the dynamic on the market.
During the analysis stage, feedback from the stakeholder groups would be compared to determine areas of agreement as well as areas of divergence