

Key Insights
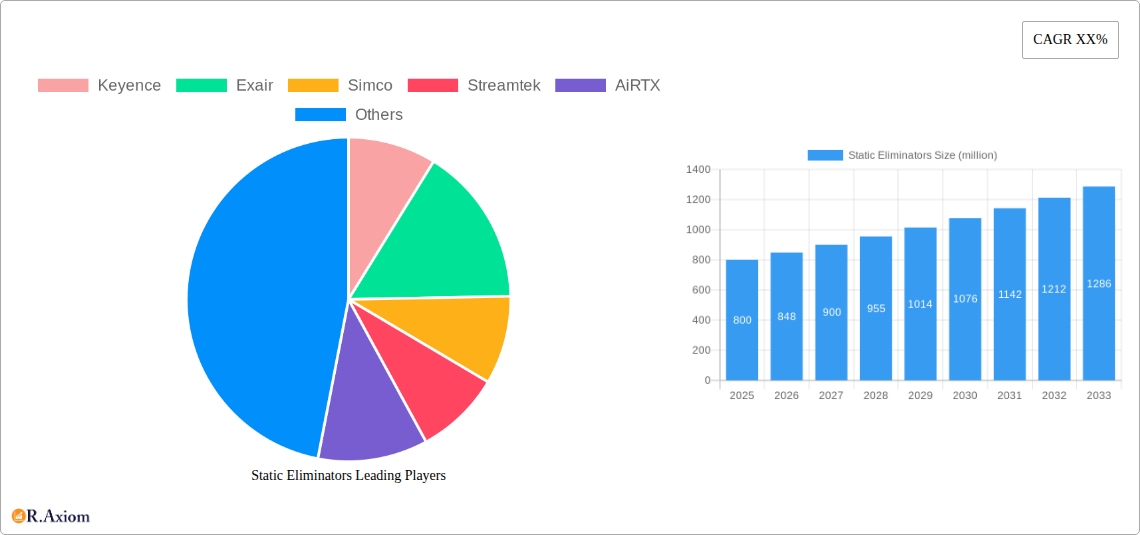
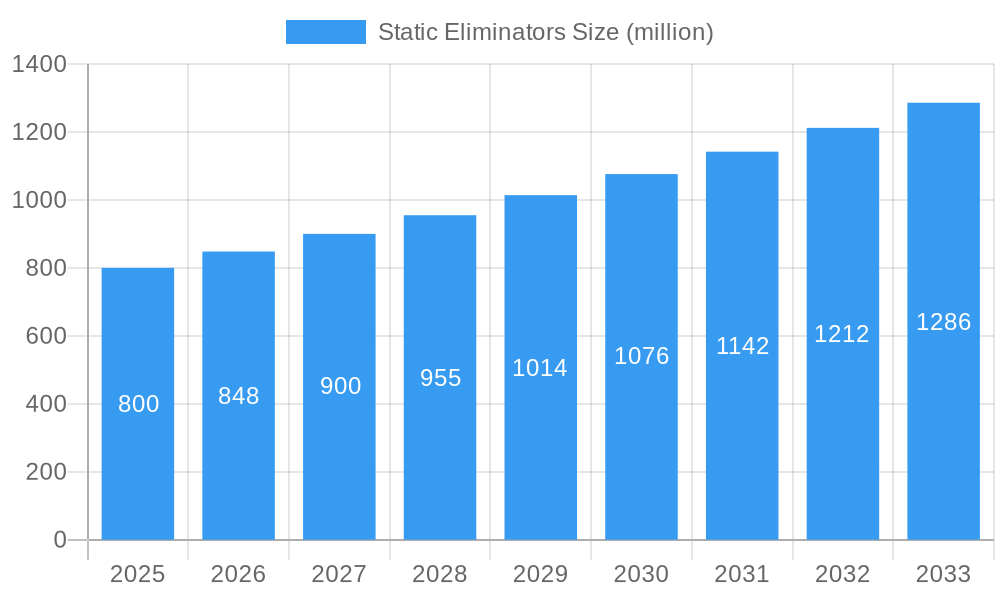
The global static eliminators market is experiencing robust growth, driven by increasing automation across diverse industries and stringent regulations regarding electrostatic discharge (ESD) protection. The market, estimated at $800 million in 2025, is projected to witness a Compound Annual Growth Rate (CAGR) of 6% from 2025 to 2033, reaching approximately $1.3 billion by 2033. Key drivers include the escalating demand for static eliminators in electronics manufacturing, healthcare, and the pharmaceutical sectors, where even minor electrostatic discharge can cause significant damage or safety hazards. The rising adoption of advanced technologies like ionizing air blowers and anti-static coatings further fuels market expansion. Market segmentation reveals a strong preference for air ionization systems, owing to their effectiveness and versatility in various applications. Leading players like Keyence, Exair, Simco, Streamtek, AiRTX, and Meech are actively investing in research and development to enhance product performance and expand their market share through innovative solutions and strategic partnerships.
Static Eliminators Market Size (In Million)
However, the market faces certain restraints, including the high initial investment costs associated with advanced static elimination systems and the potential for maintenance complexities. Furthermore, regional variations in adoption rates exist, with North America and Europe currently dominating the market due to higher technological advancements and stringent regulatory frameworks. Emerging economies in Asia-Pacific and other regions present significant growth opportunities as industrialization accelerates and awareness of ESD protection increases. The trend towards miniaturization and improved energy efficiency in static eliminators is expected to further shape the market landscape in the coming years. The focus on sustainable manufacturing practices is also influencing the demand for eco-friendly static elimination solutions.
Static Eliminators Company Market Share
Static Eliminators Market Report: A Comprehensive Analysis (2019-2033)
This comprehensive report provides a detailed analysis of the global static eliminators market, offering invaluable insights for industry stakeholders, investors, and strategic decision-makers. The report covers the period from 2019 to 2033, with a base year of 2025 and a forecast period from 2025 to 2033. The report values are presented in millions of dollars (USD).
Static Eliminators Market Concentration & Innovation
The global static eliminators market exhibits a moderately concentrated landscape, with key players such as Keyence, Exair, Simco, Streamtek, AiRTX, and Meech holding significant market share. The estimated market share for 2025 is as follows: Keyence (xx%), Exair (xx%), Simco (xx%), Streamtek (xx%), AiRTX (xx%), Meech (xx%), and Others (xx%). Innovation is a key driver, with continuous advancements in ionization technologies, material science, and miniaturization leading to improved efficiency and performance. Regulatory frameworks, particularly concerning worker safety and environmental regulations, significantly influence market dynamics. Product substitutes, such as compressed air systems, are present but generally less efficient. M&A activity has been moderate, with estimated deal values totaling $xx million in the historical period (2019-2024), primarily focused on strengthening technological capabilities and expanding market reach. End-user trends towards automation and increased focus on quality control are bolstering demand.
Static Eliminators Industry Trends & Insights
The static eliminators market is experiencing robust growth, driven by increasing demand across various industries. The Compound Annual Growth Rate (CAGR) from 2025 to 2033 is projected at xx%. Technological advancements, such as the adoption of advanced ionization technologies and the integration of smart sensors, are fueling market expansion. Consumer preferences are shifting towards more energy-efficient and environmentally friendly solutions, influencing product development. The competitive landscape is characterized by both established players and emerging entrants, leading to continuous innovation and price optimization. Market penetration is highest in the electronics and automotive sectors, with a significant growth potential in emerging industries like pharmaceuticals and renewable energy.
Dominant Markets & Segments in Static Eliminators
The North American region currently dominates the static eliminators market, primarily driven by the strong presence of manufacturing industries and stringent regulatory standards.
- Key Drivers in North America:
- Robust industrial base, particularly in electronics and automotive sectors.
- Stringent safety regulations and environmental concerns.
- Strong focus on automation and advanced manufacturing technologies.
- High disposable income and consumer spending power.
Europe and Asia Pacific are also significant markets, with substantial growth potential in emerging economies driven by industrialization and infrastructure development. Within segments, the electronics industry constitutes the largest market share, followed by the automotive and packaging industries. Detailed analysis reveals that this dominance is driven by stringent quality requirements and the prevalence of static-sensitive components in these sectors.
Static Eliminators Product Developments
Recent innovations in static eliminators focus on improved efficiency, energy savings, and compact designs. Ionizing bars with advanced electrode geometries and high-output ionizers are gaining traction. New applications are emerging in sectors such as healthcare and food processing, owing to increasing awareness of the detrimental effects of static electricity. The competitive advantage lies in providing superior performance, reliability, and ease of integration into existing manufacturing processes.
Report Scope & Segmentation Analysis
This report segments the static eliminators market based on product type (ionization bars, blowers, air guns, etc.), technology (ionizing air, radioactive sources, etc.), application (electronics, automotive, pharmaceuticals, etc.), and region (North America, Europe, Asia Pacific, etc.). Each segment's market size, growth projection, and competitive dynamics are analyzed in detail. The report provides a comprehensive overview of the diverse application and technological landscape of static eliminators. Each segment is forecasted to demonstrate significant growth over the forecast period, reflecting evolving industry needs and technological advancements.
Key Drivers of Static Eliminators Growth
Growth in the static eliminators market is propelled by several factors: the increasing automation of manufacturing processes across industries, strict regulations regarding electrostatic discharge (ESD) prevention, and the growing demand for high-precision manufacturing in electronics and related sectors. Technological advancements leading to more efficient and reliable static eliminators further fuel market expansion. Stringent quality standards and the increasing need for ESD protection across various industries also contribute to market growth.
Challenges in the Static Eliminators Sector
Challenges facing the static eliminators sector include fluctuating raw material prices, supply chain disruptions, and intense competition from both established and emerging players. Stringent safety and environmental regulations can also pose challenges for manufacturers. The competitive landscape requires continuous innovation and cost optimization strategies for sustained growth. These factors result in an estimated xx% impact on market growth for the next 5 years.
Emerging Opportunities in Static Eliminators
Emerging opportunities lie in the development of smart and integrated static elimination systems, incorporating features like real-time monitoring and predictive maintenance. Expanding into new applications, such as cleanrooms and healthcare facilities, presents significant growth potential. Growing demand for ESD protection in emerging industries, including renewable energy and 3D printing, also offers substantial market opportunities. Furthermore, the integration of IoT technologies and AI provides immense potential for innovation.
Key Developments in Static Eliminators Industry
- 2022 Q4: Keyence launched a new generation of compact ionizing bars with enhanced efficiency.
- 2023 Q1: Simco acquired a smaller competitor, expanding its product portfolio.
- 2023 Q3: Exair introduced a new line of energy-efficient static eliminators.
- 2024 Q2: Meech released an innovative static elimination system for the pharmaceutical industry. (Further developments can be added here as they occur.)
Strategic Outlook for Static Eliminators Market
The future of the static eliminators market is bright, driven by the ongoing technological advancements and the expanding adoption of automation across diverse sectors. The increasing focus on improving product quality and safety standards will continue to bolster demand. Emerging applications and the integration of advanced technologies will create new growth opportunities, leading to a projected xx% market expansion over the next decade. Strategic collaborations and mergers & acquisitions will play a significant role in shaping the market landscape in the years to come.
Static Eliminators Segmentation
-
1. Application
- 1.1. Household
- 1.2. Travel
- 1.3. Office
- 1.4. Manufacturing Shop
- 1.5. Other
-
2. Types
- 2.1. Contact Type Static Eliminators
- 2.2. Induction Type Static Eliminators
Static Eliminators Segmentation By Geography
-
1. North America
- 1.1. United States
- 1.2. Canada
- 1.3. Mexico
-
2. South America
- 2.1. Brazil
- 2.2. Argentina
- 2.3. Rest of South America
-
3. Europe
- 3.1. United Kingdom
- 3.2. Germany
- 3.3. France
- 3.4. Italy
- 3.5. Spain
- 3.6. Russia
- 3.7. Benelux
- 3.8. Nordics
- 3.9. Rest of Europe
-
4. Middle East & Africa
- 4.1. Turkey
- 4.2. Israel
- 4.3. GCC
- 4.4. North Africa
- 4.5. South Africa
- 4.6. Rest of Middle East & Africa
-
5. Asia Pacific
- 5.1. China
- 5.2. India
- 5.3. Japan
- 5.4. South Korea
- 5.5. ASEAN
- 5.6. Oceania
- 5.7. Rest of Asia Pacific

Static Eliminators Regional Market Share
Geographic Coverage of Static Eliminators
Static Eliminators REPORT HIGHLIGHTS
| Aspects | Details |
|---|---|
| Study Period | 2020-2034 |
| Base Year | 2025 |
| Estimated Year | 2026 |
| Forecast Period | 2026-2034 |
| Historical Period | 2020-2025 |
| Growth Rate | CAGR of 12.08% from 2020-2034 |
| Segmentation |
|
Table of Contents
- 1. Introduction
- 1.1. Research Scope
- 1.2. Market Segmentation
- 1.3. Research Objective
- 1.4. Definitions and Assumptions
- 2. Executive Summary
- 2.1. Market Snapshot
- 3. Market Dynamics
- 3.1. Market Drivers
- 3.2. Market Restrains
- 3.3. Market Trends
- 3.4. Market Opportunities
- 4. Market Factor Analysis
- 4.1. Porters Five Forces
- 4.1.1. Bargaining Power of Suppliers
- 4.1.2. Bargaining Power of Buyers
- 4.1.3. Threat of New Entrants
- 4.1.4. Threat of Substitutes
- 4.1.5. Competitive Rivalry
- 4.2. PESTEL analysis
- 4.3. BCG Analysis
- 4.3.1. Stars (High Growth, High Market Share)
- 4.3.2. Cash Cows (Low Growth, High Market Share)
- 4.3.3. Question Mark (High Growth, Low Market Share)
- 4.3.4. Dogs (Low Growth, Low Market Share)
- 4.4. Ansoff Matrix Analysis
- 4.5. Supply Chain Analysis
- 4.6. Regulatory Landscape
- 4.7. Current Market Potential and Opportunity Assessment (TAM–SAM–SOM Framework)
- 4.8. RAX Analyst Note
- 4.1. Porters Five Forces
- 5. Market Analysis, Insights and Forecast 2021-2033
- 5.1. Market Analysis, Insights and Forecast - by Application
- 5.1.1. Household
- 5.1.2. Travel
- 5.1.3. Office
- 5.1.4. Manufacturing Shop
- 5.1.5. Other
- 5.2. Market Analysis, Insights and Forecast - by Types
- 5.2.1. Contact Type Static Eliminators
- 5.2.2. Induction Type Static Eliminators
- 5.3. Market Analysis, Insights and Forecast - by Region
- 5.3.1. North America
- 5.3.2. South America
- 5.3.3. Europe
- 5.3.4. Middle East & Africa
- 5.3.5. Asia Pacific
- 5.1. Market Analysis, Insights and Forecast - by Application
- 6. Global Static Eliminators Analysis, Insights and Forecast, 2021-2033
- 6.1. Market Analysis, Insights and Forecast - by Application
- 6.1.1. Household
- 6.1.2. Travel
- 6.1.3. Office
- 6.1.4. Manufacturing Shop
- 6.1.5. Other
- 6.2. Market Analysis, Insights and Forecast - by Types
- 6.2.1. Contact Type Static Eliminators
- 6.2.2. Induction Type Static Eliminators
- 6.1. Market Analysis, Insights and Forecast - by Application
- 7. North America Static Eliminators Analysis, Insights and Forecast, 2020-2032
- 7.1. Market Analysis, Insights and Forecast - by Application
- 7.1.1. Household
- 7.1.2. Travel
- 7.1.3. Office
- 7.1.4. Manufacturing Shop
- 7.1.5. Other
- 7.2. Market Analysis, Insights and Forecast - by Types
- 7.2.1. Contact Type Static Eliminators
- 7.2.2. Induction Type Static Eliminators
- 7.1. Market Analysis, Insights and Forecast - by Application
- 8. South America Static Eliminators Analysis, Insights and Forecast, 2020-2032
- 8.1. Market Analysis, Insights and Forecast - by Application
- 8.1.1. Household
- 8.1.2. Travel
- 8.1.3. Office
- 8.1.4. Manufacturing Shop
- 8.1.5. Other
- 8.2. Market Analysis, Insights and Forecast - by Types
- 8.2.1. Contact Type Static Eliminators
- 8.2.2. Induction Type Static Eliminators
- 8.1. Market Analysis, Insights and Forecast - by Application
- 9. Europe Static Eliminators Analysis, Insights and Forecast, 2020-2032
- 9.1. Market Analysis, Insights and Forecast - by Application
- 9.1.1. Household
- 9.1.2. Travel
- 9.1.3. Office
- 9.1.4. Manufacturing Shop
- 9.1.5. Other
- 9.2. Market Analysis, Insights and Forecast - by Types
- 9.2.1. Contact Type Static Eliminators
- 9.2.2. Induction Type Static Eliminators
- 9.1. Market Analysis, Insights and Forecast - by Application
- 10. Middle East & Africa Static Eliminators Analysis, Insights and Forecast, 2020-2032
- 10.1. Market Analysis, Insights and Forecast - by Application
- 10.1.1. Household
- 10.1.2. Travel
- 10.1.3. Office
- 10.1.4. Manufacturing Shop
- 10.1.5. Other
- 10.2. Market Analysis, Insights and Forecast - by Types
- 10.2.1. Contact Type Static Eliminators
- 10.2.2. Induction Type Static Eliminators
- 10.1. Market Analysis, Insights and Forecast - by Application
- 11. Asia Pacific Static Eliminators Analysis, Insights and Forecast, 2020-2032
- 11.1. Market Analysis, Insights and Forecast - by Application
- 11.1.1. Household
- 11.1.2. Travel
- 11.1.3. Office
- 11.1.4. Manufacturing Shop
- 11.1.5. Other
- 11.2. Market Analysis, Insights and Forecast - by Types
- 11.2.1. Contact Type Static Eliminators
- 11.2.2. Induction Type Static Eliminators
- 11.1. Market Analysis, Insights and Forecast - by Application
- 12. Competitive Analysis
- 12.1. Company Profiles
- 12.1.1 Keyence
- 12.1.1.1. Company Overview
- 12.1.1.2. Products
- 12.1.1.3. Company Financials
- 12.1.1.4. SWOT Analysis
- 12.1.2 Exair
- 12.1.2.1. Company Overview
- 12.1.2.2. Products
- 12.1.2.3. Company Financials
- 12.1.2.4. SWOT Analysis
- 12.1.3 Simco
- 12.1.3.1. Company Overview
- 12.1.3.2. Products
- 12.1.3.3. Company Financials
- 12.1.3.4. SWOT Analysis
- 12.1.4 Streamtek
- 12.1.4.1. Company Overview
- 12.1.4.2. Products
- 12.1.4.3. Company Financials
- 12.1.4.4. SWOT Analysis
- 12.1.5 AiRTX
- 12.1.5.1. Company Overview
- 12.1.5.2. Products
- 12.1.5.3. Company Financials
- 12.1.5.4. SWOT Analysis
- 12.1.6 Meech
- 12.1.6.1. Company Overview
- 12.1.6.2. Products
- 12.1.6.3. Company Financials
- 12.1.6.4. SWOT Analysis
- 12.1.1 Keyence
- 12.2. Market Entropy
- 12.2.1 Company's Key Areas Served
- 12.2.2 Recent Developments
- 12.3. Company Market Share Analysis 2025
- 12.3.1 Top 5 Companies Market Share Analysis
- 12.3.2 Top 3 Companies Market Share Analysis
- 12.4. List of Potential Customers
- 13. Research Methodology
List of Figures
- Figure 1: Global Static Eliminators Revenue Breakdown (undefined, %) by Region 2025 & 2033
- Figure 2: Global Static Eliminators Volume Breakdown (K, %) by Region 2025 & 2033
- Figure 3: North America Static Eliminators Revenue (undefined), by Application 2025 & 2033
- Figure 4: North America Static Eliminators Volume (K), by Application 2025 & 2033
- Figure 5: North America Static Eliminators Revenue Share (%), by Application 2025 & 2033
- Figure 6: North America Static Eliminators Volume Share (%), by Application 2025 & 2033
- Figure 7: North America Static Eliminators Revenue (undefined), by Types 2025 & 2033
- Figure 8: North America Static Eliminators Volume (K), by Types 2025 & 2033
- Figure 9: North America Static Eliminators Revenue Share (%), by Types 2025 & 2033
- Figure 10: North America Static Eliminators Volume Share (%), by Types 2025 & 2033
- Figure 11: North America Static Eliminators Revenue (undefined), by Country 2025 & 2033
- Figure 12: North America Static Eliminators Volume (K), by Country 2025 & 2033
- Figure 13: North America Static Eliminators Revenue Share (%), by Country 2025 & 2033
- Figure 14: North America Static Eliminators Volume Share (%), by Country 2025 & 2033
- Figure 15: South America Static Eliminators Revenue (undefined), by Application 2025 & 2033
- Figure 16: South America Static Eliminators Volume (K), by Application 2025 & 2033
- Figure 17: South America Static Eliminators Revenue Share (%), by Application 2025 & 2033
- Figure 18: South America Static Eliminators Volume Share (%), by Application 2025 & 2033
- Figure 19: South America Static Eliminators Revenue (undefined), by Types 2025 & 2033
- Figure 20: South America Static Eliminators Volume (K), by Types 2025 & 2033
- Figure 21: South America Static Eliminators Revenue Share (%), by Types 2025 & 2033
- Figure 22: South America Static Eliminators Volume Share (%), by Types 2025 & 2033
- Figure 23: South America Static Eliminators Revenue (undefined), by Country 2025 & 2033
- Figure 24: South America Static Eliminators Volume (K), by Country 2025 & 2033
- Figure 25: South America Static Eliminators Revenue Share (%), by Country 2025 & 2033
- Figure 26: South America Static Eliminators Volume Share (%), by Country 2025 & 2033
- Figure 27: Europe Static Eliminators Revenue (undefined), by Application 2025 & 2033
- Figure 28: Europe Static Eliminators Volume (K), by Application 2025 & 2033
- Figure 29: Europe Static Eliminators Revenue Share (%), by Application 2025 & 2033
- Figure 30: Europe Static Eliminators Volume Share (%), by Application 2025 & 2033
- Figure 31: Europe Static Eliminators Revenue (undefined), by Types 2025 & 2033
- Figure 32: Europe Static Eliminators Volume (K), by Types 2025 & 2033
- Figure 33: Europe Static Eliminators Revenue Share (%), by Types 2025 & 2033
- Figure 34: Europe Static Eliminators Volume Share (%), by Types 2025 & 2033
- Figure 35: Europe Static Eliminators Revenue (undefined), by Country 2025 & 2033
- Figure 36: Europe Static Eliminators Volume (K), by Country 2025 & 2033
- Figure 37: Europe Static Eliminators Revenue Share (%), by Country 2025 & 2033
- Figure 38: Europe Static Eliminators Volume Share (%), by Country 2025 & 2033
- Figure 39: Middle East & Africa Static Eliminators Revenue (undefined), by Application 2025 & 2033
- Figure 40: Middle East & Africa Static Eliminators Volume (K), by Application 2025 & 2033
- Figure 41: Middle East & Africa Static Eliminators Revenue Share (%), by Application 2025 & 2033
- Figure 42: Middle East & Africa Static Eliminators Volume Share (%), by Application 2025 & 2033
- Figure 43: Middle East & Africa Static Eliminators Revenue (undefined), by Types 2025 & 2033
- Figure 44: Middle East & Africa Static Eliminators Volume (K), by Types 2025 & 2033
- Figure 45: Middle East & Africa Static Eliminators Revenue Share (%), by Types 2025 & 2033
- Figure 46: Middle East & Africa Static Eliminators Volume Share (%), by Types 2025 & 2033
- Figure 47: Middle East & Africa Static Eliminators Revenue (undefined), by Country 2025 & 2033
- Figure 48: Middle East & Africa Static Eliminators Volume (K), by Country 2025 & 2033
- Figure 49: Middle East & Africa Static Eliminators Revenue Share (%), by Country 2025 & 2033
- Figure 50: Middle East & Africa Static Eliminators Volume Share (%), by Country 2025 & 2033
- Figure 51: Asia Pacific Static Eliminators Revenue (undefined), by Application 2025 & 2033
- Figure 52: Asia Pacific Static Eliminators Volume (K), by Application 2025 & 2033
- Figure 53: Asia Pacific Static Eliminators Revenue Share (%), by Application 2025 & 2033
- Figure 54: Asia Pacific Static Eliminators Volume Share (%), by Application 2025 & 2033
- Figure 55: Asia Pacific Static Eliminators Revenue (undefined), by Types 2025 & 2033
- Figure 56: Asia Pacific Static Eliminators Volume (K), by Types 2025 & 2033
- Figure 57: Asia Pacific Static Eliminators Revenue Share (%), by Types 2025 & 2033
- Figure 58: Asia Pacific Static Eliminators Volume Share (%), by Types 2025 & 2033
- Figure 59: Asia Pacific Static Eliminators Revenue (undefined), by Country 2025 & 2033
- Figure 60: Asia Pacific Static Eliminators Volume (K), by Country 2025 & 2033
- Figure 61: Asia Pacific Static Eliminators Revenue Share (%), by Country 2025 & 2033
- Figure 62: Asia Pacific Static Eliminators Volume Share (%), by Country 2025 & 2033
List of Tables
- Table 1: Global Static Eliminators Revenue undefined Forecast, by Application 2020 & 2033
- Table 2: Global Static Eliminators Volume K Forecast, by Application 2020 & 2033
- Table 3: Global Static Eliminators Revenue undefined Forecast, by Types 2020 & 2033
- Table 4: Global Static Eliminators Volume K Forecast, by Types 2020 & 2033
- Table 5: Global Static Eliminators Revenue undefined Forecast, by Region 2020 & 2033
- Table 6: Global Static Eliminators Volume K Forecast, by Region 2020 & 2033
- Table 7: Global Static Eliminators Revenue undefined Forecast, by Application 2020 & 2033
- Table 8: Global Static Eliminators Volume K Forecast, by Application 2020 & 2033
- Table 9: Global Static Eliminators Revenue undefined Forecast, by Types 2020 & 2033
- Table 10: Global Static Eliminators Volume K Forecast, by Types 2020 & 2033
- Table 11: Global Static Eliminators Revenue undefined Forecast, by Country 2020 & 2033
- Table 12: Global Static Eliminators Volume K Forecast, by Country 2020 & 2033
- Table 13: United States Static Eliminators Revenue (undefined) Forecast, by Application 2020 & 2033
- Table 14: United States Static Eliminators Volume (K) Forecast, by Application 2020 & 2033
- Table 15: Canada Static Eliminators Revenue (undefined) Forecast, by Application 2020 & 2033
- Table 16: Canada Static Eliminators Volume (K) Forecast, by Application 2020 & 2033
- Table 17: Mexico Static Eliminators Revenue (undefined) Forecast, by Application 2020 & 2033
- Table 18: Mexico Static Eliminators Volume (K) Forecast, by Application 2020 & 2033
- Table 19: Global Static Eliminators Revenue undefined Forecast, by Application 2020 & 2033
- Table 20: Global Static Eliminators Volume K Forecast, by Application 2020 & 2033
- Table 21: Global Static Eliminators Revenue undefined Forecast, by Types 2020 & 2033
- Table 22: Global Static Eliminators Volume K Forecast, by Types 2020 & 2033
- Table 23: Global Static Eliminators Revenue undefined Forecast, by Country 2020 & 2033
- Table 24: Global Static Eliminators Volume K Forecast, by Country 2020 & 2033
- Table 25: Brazil Static Eliminators Revenue (undefined) Forecast, by Application 2020 & 2033
- Table 26: Brazil Static Eliminators Volume (K) Forecast, by Application 2020 & 2033
- Table 27: Argentina Static Eliminators Revenue (undefined) Forecast, by Application 2020 & 2033
- Table 28: Argentina Static Eliminators Volume (K) Forecast, by Application 2020 & 2033
- Table 29: Rest of South America Static Eliminators Revenue (undefined) Forecast, by Application 2020 & 2033
- Table 30: Rest of South America Static Eliminators Volume (K) Forecast, by Application 2020 & 2033
- Table 31: Global Static Eliminators Revenue undefined Forecast, by Application 2020 & 2033
- Table 32: Global Static Eliminators Volume K Forecast, by Application 2020 & 2033
- Table 33: Global Static Eliminators Revenue undefined Forecast, by Types 2020 & 2033
- Table 34: Global Static Eliminators Volume K Forecast, by Types 2020 & 2033
- Table 35: Global Static Eliminators Revenue undefined Forecast, by Country 2020 & 2033
- Table 36: Global Static Eliminators Volume K Forecast, by Country 2020 & 2033
- Table 37: United Kingdom Static Eliminators Revenue (undefined) Forecast, by Application 2020 & 2033
- Table 38: United Kingdom Static Eliminators Volume (K) Forecast, by Application 2020 & 2033
- Table 39: Germany Static Eliminators Revenue (undefined) Forecast, by Application 2020 & 2033
- Table 40: Germany Static Eliminators Volume (K) Forecast, by Application 2020 & 2033
- Table 41: France Static Eliminators Revenue (undefined) Forecast, by Application 2020 & 2033
- Table 42: France Static Eliminators Volume (K) Forecast, by Application 2020 & 2033
- Table 43: Italy Static Eliminators Revenue (undefined) Forecast, by Application 2020 & 2033
- Table 44: Italy Static Eliminators Volume (K) Forecast, by Application 2020 & 2033
- Table 45: Spain Static Eliminators Revenue (undefined) Forecast, by Application 2020 & 2033
- Table 46: Spain Static Eliminators Volume (K) Forecast, by Application 2020 & 2033
- Table 47: Russia Static Eliminators Revenue (undefined) Forecast, by Application 2020 & 2033
- Table 48: Russia Static Eliminators Volume (K) Forecast, by Application 2020 & 2033
- Table 49: Benelux Static Eliminators Revenue (undefined) Forecast, by Application 2020 & 2033
- Table 50: Benelux Static Eliminators Volume (K) Forecast, by Application 2020 & 2033
- Table 51: Nordics Static Eliminators Revenue (undefined) Forecast, by Application 2020 & 2033
- Table 52: Nordics Static Eliminators Volume (K) Forecast, by Application 2020 & 2033
- Table 53: Rest of Europe Static Eliminators Revenue (undefined) Forecast, by Application 2020 & 2033
- Table 54: Rest of Europe Static Eliminators Volume (K) Forecast, by Application 2020 & 2033
- Table 55: Global Static Eliminators Revenue undefined Forecast, by Application 2020 & 2033
- Table 56: Global Static Eliminators Volume K Forecast, by Application 2020 & 2033
- Table 57: Global Static Eliminators Revenue undefined Forecast, by Types 2020 & 2033
- Table 58: Global Static Eliminators Volume K Forecast, by Types 2020 & 2033
- Table 59: Global Static Eliminators Revenue undefined Forecast, by Country 2020 & 2033
- Table 60: Global Static Eliminators Volume K Forecast, by Country 2020 & 2033
- Table 61: Turkey Static Eliminators Revenue (undefined) Forecast, by Application 2020 & 2033
- Table 62: Turkey Static Eliminators Volume (K) Forecast, by Application 2020 & 2033
- Table 63: Israel Static Eliminators Revenue (undefined) Forecast, by Application 2020 & 2033
- Table 64: Israel Static Eliminators Volume (K) Forecast, by Application 2020 & 2033
- Table 65: GCC Static Eliminators Revenue (undefined) Forecast, by Application 2020 & 2033
- Table 66: GCC Static Eliminators Volume (K) Forecast, by Application 2020 & 2033
- Table 67: North Africa Static Eliminators Revenue (undefined) Forecast, by Application 2020 & 2033
- Table 68: North Africa Static Eliminators Volume (K) Forecast, by Application 2020 & 2033
- Table 69: South Africa Static Eliminators Revenue (undefined) Forecast, by Application 2020 & 2033
- Table 70: South Africa Static Eliminators Volume (K) Forecast, by Application 2020 & 2033
- Table 71: Rest of Middle East & Africa Static Eliminators Revenue (undefined) Forecast, by Application 2020 & 2033
- Table 72: Rest of Middle East & Africa Static Eliminators Volume (K) Forecast, by Application 2020 & 2033
- Table 73: Global Static Eliminators Revenue undefined Forecast, by Application 2020 & 2033
- Table 74: Global Static Eliminators Volume K Forecast, by Application 2020 & 2033
- Table 75: Global Static Eliminators Revenue undefined Forecast, by Types 2020 & 2033
- Table 76: Global Static Eliminators Volume K Forecast, by Types 2020 & 2033
- Table 77: Global Static Eliminators Revenue undefined Forecast, by Country 2020 & 2033
- Table 78: Global Static Eliminators Volume K Forecast, by Country 2020 & 2033
- Table 79: China Static Eliminators Revenue (undefined) Forecast, by Application 2020 & 2033
- Table 80: China Static Eliminators Volume (K) Forecast, by Application 2020 & 2033
- Table 81: India Static Eliminators Revenue (undefined) Forecast, by Application 2020 & 2033
- Table 82: India Static Eliminators Volume (K) Forecast, by Application 2020 & 2033
- Table 83: Japan Static Eliminators Revenue (undefined) Forecast, by Application 2020 & 2033
- Table 84: Japan Static Eliminators Volume (K) Forecast, by Application 2020 & 2033
- Table 85: South Korea Static Eliminators Revenue (undefined) Forecast, by Application 2020 & 2033
- Table 86: South Korea Static Eliminators Volume (K) Forecast, by Application 2020 & 2033
- Table 87: ASEAN Static Eliminators Revenue (undefined) Forecast, by Application 2020 & 2033
- Table 88: ASEAN Static Eliminators Volume (K) Forecast, by Application 2020 & 2033
- Table 89: Oceania Static Eliminators Revenue (undefined) Forecast, by Application 2020 & 2033
- Table 90: Oceania Static Eliminators Volume (K) Forecast, by Application 2020 & 2033
- Table 91: Rest of Asia Pacific Static Eliminators Revenue (undefined) Forecast, by Application 2020 & 2033
- Table 92: Rest of Asia Pacific Static Eliminators Volume (K) Forecast, by Application 2020 & 2033
Frequently Asked Questions
1. What is the projected Compound Annual Growth Rate (CAGR) of the Static Eliminators?
The projected CAGR is approximately 12.08%.
2. Which companies are prominent players in the Static Eliminators?
Key companies in the market include Keyence, Exair, Simco, Streamtek, AiRTX, Meech.
3. What are the main segments of the Static Eliminators?
The market segments include Application, Types.
4. Can you provide details about the market size?
The market size is estimated to be USD XXX N/A as of 2022.
5. What are some drivers contributing to market growth?
N/A
6. What are the notable trends driving market growth?
N/A
7. Are there any restraints impacting market growth?
N/A
8. Can you provide examples of recent developments in the market?
N/A
9. What pricing options are available for accessing the report?
Pricing options include single-user, multi-user, and enterprise licenses priced at USD 3350.00, USD 5025.00, and USD 6700.00 respectively.
10. Is the market size provided in terms of value or volume?
The market size is provided in terms of value, measured in N/A and volume, measured in K.
11. Are there any specific market keywords associated with the report?
Yes, the market keyword associated with the report is "Static Eliminators," which aids in identifying and referencing the specific market segment covered.
12. How do I determine which pricing option suits my needs best?
The pricing options vary based on user requirements and access needs. Individual users may opt for single-user licenses, while businesses requiring broader access may choose multi-user or enterprise licenses for cost-effective access to the report.
13. Are there any additional resources or data provided in the Static Eliminators report?
While the report offers comprehensive insights, it's advisable to review the specific contents or supplementary materials provided to ascertain if additional resources or data are available.
14. How can I stay updated on further developments or reports in the Static Eliminators?
To stay informed about further developments, trends, and reports in the Static Eliminators, consider subscribing to industry newsletters, following relevant companies and organizations, or regularly checking reputable industry news sources and publications.
Methodology
Step 1 - Identification of Relevant Samples Size from Population Database


Step 2 - Approaches for Defining Global Market Size (Value, Volume* & Price*)

Note*: In applicable scenarios
Step 3 - Data Sources
Primary Research
- Web Analytics
- Survey Reports
- Research Institute
- Latest Research Reports
- Opinion Leaders
Secondary Research
- Annual Reports
- White Paper
- Latest Press Release
- Industry Association
- Paid Database
- Investor Presentations

Step 4 - Data Triangulation
Involves using different sources of information in order to increase the validity of a study
These sources are likely to be stakeholders in a program - participants, other researchers, program staff, other community members, and so on.
Then we put all data in single framework & apply various statistical tools to find out the dynamic on the market.
During the analysis stage, feedback from the stakeholder groups would be compared to determine areas of agreement as well as areas of divergence