

Key Insights
The Strategic Mineral Materials market is projected for substantial growth, expected to reach $8.9 billion by 2025, with a Compound Annual Growth Rate (CAGR) of 6.3%. This expansion is primarily driven by surging demand in key sectors such as advanced electronics, automotive (especially electric vehicles), consumer gadgets, and communication technologies. The burgeoning renewable energy sector, including solar, wind, and battery storage, also fuels demand for critical minerals like cobalt, rare earth elements, and lithium. Aerospace innovation, requiring lightweight alloys, further contributes to market growth through the use of materials like beryllium and niobium.
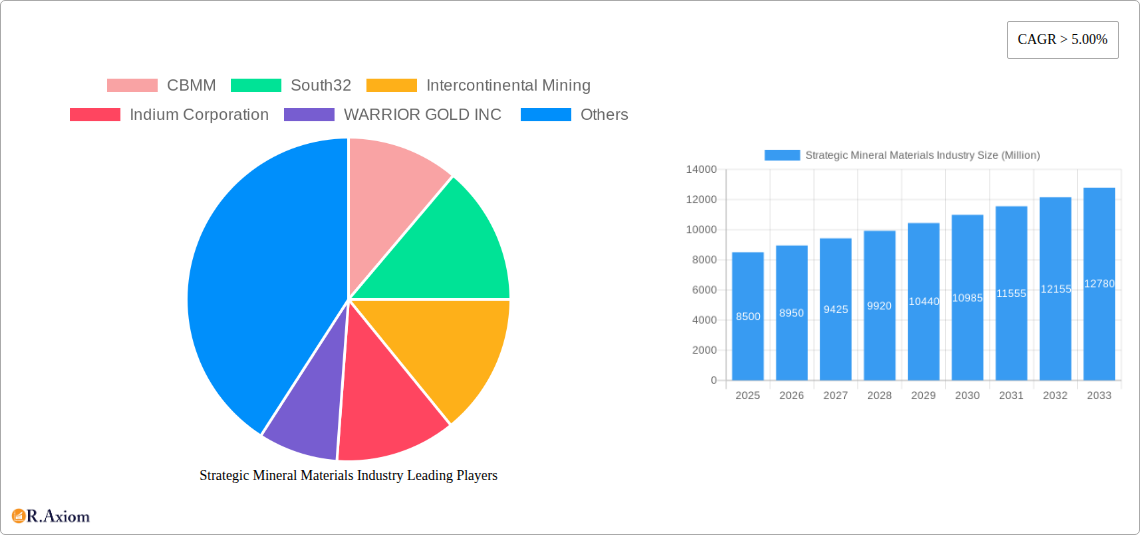
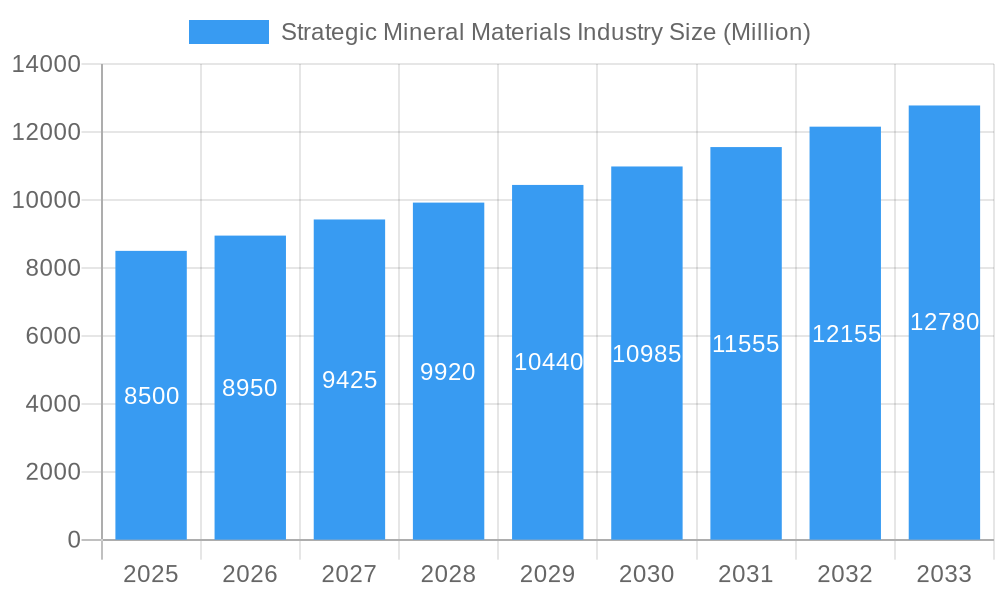
Strategic Mineral Materials Industry Market Size (In Billion)
Market dynamics are influenced by a focus on supply chain resilience and national security, leading to increased investment in domestic mineral exploration and processing, particularly in North America and Europe. Technological advancements in extraction and refining are unlocking new deposits and enhancing operational sustainability. The circular economy, emphasizing recycling and material recovery, is also emerging, though primary extraction remains dominant. Key restraints include geopolitical instability in producing regions, stringent environmental regulations, complex permitting processes, high capital investment, and inherent commodity price volatility.
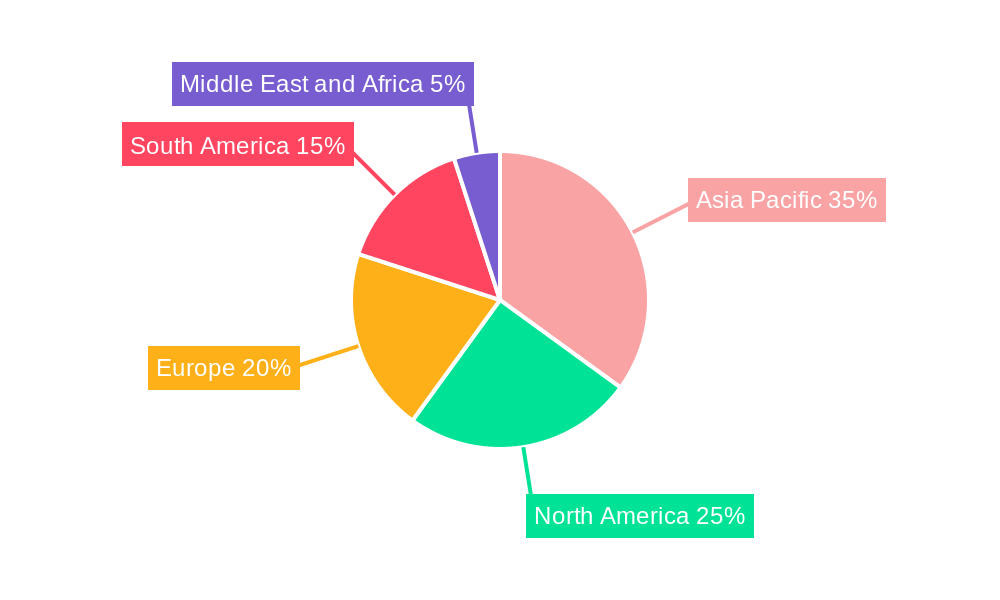
Strategic Mineral Materials Industry Company Market Share
This comprehensive report analyzes the Strategic Mineral Materials Industry, covering market dynamics, trends, key players, and projections from 2019 to 2033. With a base year of 2025 and a forecast period to 2033, the study is vital for understanding the evolving landscape of critical raw materials essential for global industrial advancement.
The report details the market for strategic minerals including Antimony, Barite, Beryllium, Cobalt, Fluorspar, Gallium, Germanium, Indium, Manganese, Niobium, Platinum Group Elements, Rare Earth Elements, and Tantalum, analyzing their applications and market segmentation. Key players such as CBMM, South32, Intercontinental Mining, Indium Corporation, WARRIOR GOLD INC, Anglo American plc, Glencore, Vale, and Materion Corporation are assessed for their strategic influence.
Strategic Mineral Materials Industry Market Concentration & Innovation
The Strategic Mineral Materials Industry exhibits a moderate to high level of market concentration, particularly within specific mineral segments. Dominant players like Glencore and Vale hold significant market shares in commodities such as Cobalt and Manganese, respectively. Innovation is a critical driver, fueled by the increasing demand for advanced technologies in electronics, aerospace, and renewable energy. Key innovation areas include enhanced extraction techniques, improved material processing, and the development of novel alloys and composites. Regulatory frameworks, such as those surrounding critical raw materials in the EU and US, are increasingly shaping market access and investment. Product substitutes, while a factor, are often limited by the unique properties of strategic minerals, especially in high-performance applications. End-user trends are strongly influenced by the push for electrification, miniaturization, and sustainable manufacturing. Mergers and acquisitions (M&A) activity is robust, with deal values in the billions, as companies seek to secure supply chains and expand their portfolios. For instance, M&A activities in the Rare Earth Elements sector have been substantial, aiming to consolidate control over crucial processing capabilities.
Strategic Mineral Materials Industry Industry Trends & Insights
The Strategic Mineral Materials Industry is poised for significant growth, projected to experience a Compound Annual Growth Rate (CAGR) of approximately 6.5% during the forecast period of 2025–2033. This expansion is primarily driven by the insatiable demand from burgeoning sectors such as electric vehicles (EVs), advanced electronics, renewable energy infrastructure, and defense applications. Technological disruptions are at the forefront, with advancements in mining and processing technologies leading to more efficient extraction and higher purity levels for critical minerals. The development of new alloys and composites incorporating strategic materials is enabling enhanced performance in aerospace and automotive components. Consumer preferences are increasingly leaning towards sustainable and ethically sourced materials, putting pressure on companies to adopt responsible mining and processing practices. Competitive dynamics are intensifying, marked by strategic partnerships, joint ventures, and increasing geopolitical considerations in securing supply chains. Market penetration of strategic minerals in emerging applications, such as advanced battery chemistries and next-generation semiconductors, is projected to surge. The global market size is estimated to reach over $1.2 trillion by 2033.
Dominant Markets & Segments in Strategic Mineral Materials Industry
The Asia-Pacific region, particularly China, continues to be a dominant force in the Strategic Mineral Materials Industry, driven by its vast manufacturing capabilities and significant control over critical raw material processing. Within this region, China leads in the production and consumption of Rare Earth Elements and Gallium, crucial for its advanced electronics and renewable energy sectors.
- Antimony: The Flame Retardants segment is a primary driver, with increasing safety regulations worldwide necessitating its use in plastics, textiles, and construction materials. China and Russia are key producers. Market growth is estimated at 5.2% CAGR.
- Barite: The Oil and Gas sector remains the largest consumer, with Barite's high density making it essential for drilling fluids. The Middle East and North America are dominant markets. Estimated market size of $3.5 Billion.
- Beryllium: The Electronics and Aerospace industries are pivotal, with Beryllium alloys offering superior strength-to-weight ratios and thermal conductivity for high-performance applications. The United States is a leading producer and consumer. Forecasted CAGR of 7.8%.
- Cobalt: Driven by the Superalloys and Catalysts segments, Cobalt is indispensable for EV batteries and aerospace turbines. The Democratic Republic of Congo is the largest producer. Market size expected to exceed $25 Billion.
- Fluorspar: The Chemicals industry, especially for the production of hydrofluoric acid, is the largest consumer. Steel and Aluminum industries also contribute significantly. China and Mexico are major producers. Expected growth of 5.9% CAGR.
- Gallium: The Integrated Circuits and Solar Cells segments are experiencing rapid growth, fueled by demand for semiconductors in consumer electronics and renewable energy. China dominates production. Market size projected to reach $2 Billion.
- Germanium: Fiber Optics and Electrical and Solar Equipment are key end-use sectors. Germanium's unique optical and electrical properties make it vital for high-speed communication and advanced solar technologies. Russia and China are significant producers. Forecasted CAGR of 8.1%.
- Indium: The Flat-Panel Display Screens and Touchscreens segment is the largest market, with Indium Tin Oxide (ITO) being a critical component. Semiconductors also represent a growing application. Asia is the primary production and consumption hub. Market size estimated at $4 Billion.
- Manganese: Critical for Casting Alloys, Transportation, and Construction, Manganese is a key ingredient in steel production and battery manufacturing. South Africa and Australia are leading producers. Projected CAGR of 4.5%.
- Niobium: Dominated by the Super Alloys and Superconducting Magnets segments, Niobium enhances the strength and performance of steel and is crucial for MRI machines and particle accelerators. Brazil is the primary producer. Market size anticipated to reach $6 Billion.
- Platinum Group Elements (PGEs): The Autocatalyst segment is the largest, driven by stringent emissions regulations. Electrical & Electronics and Jewelry are also significant markets. South Africa and Russia are the major sources. Forecasted CAGR of 6.2%.
- Rare Earth Elements (REEs): Essential for Magnetic Alloys in electric motors and wind turbines, and in Metallurgy for various alloys. China holds a dominant position in global supply. Market size expected to exceed $10 Billion.
- Tantalum: Primarily used in the Medical applications due to its biocompatibility and corrosion resistance, and in high-performance capacitors for electronics. Australia and Brazil are key producers. Expected CAGR of 7.5%.
Strategic Mineral Materials Industry Product Developments
Recent product developments in the Strategic Mineral Materials Industry focus on enhancing performance, sustainability, and cost-effectiveness. Innovations include advanced recycling processes for rare earth elements, yielding purity levels exceeding 99.9%, and the development of new cobalt-free battery chemistries to mitigate supply chain risks. In the semiconductor sector, novel gallium nitride (GaN) and silicon carbide (SiC) materials are enabling higher power efficiency and smaller device footprints. For the aerospace industry, new niobium-titanium alloys are offering improved temperature resistance and durability. These developments are driven by the need to meet stringent performance requirements in rapidly evolving end-use markets and to address growing environmental concerns.
Report Scope & Segmentation Analysis
This report segments the Strategic Mineral Materials Industry by mineral type and application, providing detailed analysis for each category.
- Antimony: Focuses on its use in flame retardants, batteries, ceramics and glass, catalysts, and alloys. Growth is projected at 5.2% CAGR, with a market size of $2.8 Billion.
- Barite: Examines applications in oil and gas, and other sectors. The oil and gas segment dominates, contributing to a market size of $3.5 Billion, with a moderate growth rate of 3.8%.
- Beryllium: Analyzes its role in electronics, aerospace, automotive, and energy. The electronics and aerospace sectors are key drivers, pushing the market towards $1.5 Billion with a 7.8% CAGR.
- Cobalt: Explores its significance in superalloys, cemented carbides and diamond tools, and catalysts. The surging demand from EV batteries fuels a market size of $25 Billion, with a projected CAGR of 9.5%.
- Fluorspar: Covers its use in chemicals, steel, and aluminum production. The chemical industry is the primary consumer, leading to a market of $4.2 Billion and a 5.9% CAGR.
- Gallium: Details applications in integrated circuits, laser diodes, photodetectors, and solar cells. The semiconductor and solar sectors are key growth areas, reaching $2 Billion with an 8.1% CAGR.
- Germanium: Analyzes its use in fiber optics, infrared optics, and electrical and solar equipment. Fiber optics and advanced electronics are driving a market of $1.8 Billion with an 8.1% CAGR.
- Indium: Highlights its role in flat-panel display screens and touchscreens, low melting alloys and solders, semiconductors, and transparent heat reflectors. The display market is dominant, contributing to a $4 Billion market with a 7.2% CAGR.
- Manganese: Covers applications in casting alloys, packaging, transportation, and construction. Steel production remains the largest segment, supporting a $9 Billion market with a 4.5% CAGR.
- Niobium: Examines its use in super alloys, superconducting magnets, and capacitors. The demand from advanced steel alloys is significant, leading to a $6 Billion market with a 6.8% CAGR.
- Platinum Group Elements: Analyzes applications in autocatalysts, jewelry, and electrical & electronics. Autocatalysts are the largest segment, driving a $30 Billion market with a 6.2% CAGR.
- Rare Earth Elements: Focuses on magnetic alloys and metallurgy. The demand for high-performance magnets in EVs and renewables is crucial, leading to a $10 Billion market with a 9.2% CAGR.
- Tantalum: Details its use in medical applications and capacitors. The medical and electronics sectors are significant growth areas, reaching $2.2 Billion with a 7.5% CAGR.
Key Drivers of Strategic Mineral Materials Industry Growth
The growth of the Strategic Mineral Materials Industry is propelled by several key factors. The global transition to cleaner energy sources, particularly electric vehicles and renewable energy infrastructure (solar and wind turbines), creates immense demand for minerals like Cobalt, Rare Earth Elements, and Niobium. Advancements in digitalization and the proliferation of smart devices are driving the consumption of Gallium, Indium, and Germanium for semiconductors and displays. Stringent environmental regulations, especially concerning emissions control, bolster the demand for Platinum Group Elements in catalytic converters. Furthermore, geopolitical strategies focused on securing critical raw material supply chains are stimulating investment in exploration, extraction, and processing capabilities, particularly in North America and Europe.
Challenges in the Strategic Mineral Materials Industry Sector
The Strategic Mineral Materials Industry faces significant challenges that can impede growth. Supply chain disruptions, exacerbated by geopolitical tensions and trade disputes, pose a constant threat to availability and price stability. Environmental concerns associated with mining operations, including habitat destruction and water contamination, lead to stricter regulatory oversight and increased operational costs. The high concentration of reserves and processing capabilities in a few countries creates vulnerabilities. Furthermore, the development of viable substitutes, while limited, remains a long-term consideration for certain applications. Volatile commodity prices and the substantial capital investment required for exploration and extraction also present financial hurdles for market participants.
Emerging Opportunities in Strategic Mineral Materials Industry
Emerging opportunities in the Strategic Mineral Materials Industry lie in technological innovation and sustainable practices. The development of advanced recycling technologies for critical minerals, reducing reliance on primary extraction, presents a significant opportunity. Innovations in material science are leading to the creation of new alloys and composites with enhanced properties, opening up new application areas. The growing focus on circular economy principles is fostering a market for responsibly sourced and recycled strategic minerals. Furthermore, exploration in new geographical regions and the development of novel extraction methods, such as deep-sea mining, could unlock significant new reserves, albeit with their own set of challenges and ethical considerations.
Leading Players in the Strategic Mineral Materials Industry Market
- CBMM
- South32
- Intercontinental Mining
- Indium Corporation
- WARRIOR GOLD INC
- Anglo American plc
- Glencore
- Vale
- Materion Corporation
Key Developments in Strategic Mineral Materials Industry Industry
- 2023 October: Anglo American plc announced a new sustainability-focused mining initiative for Rare Earth Elements.
- 2024 January: Glencore secured a long-term supply agreement for Cobalt with a major EV manufacturer.
- 2024 March: Indium Corporation launched a new, high-purity Indium alloy for advanced semiconductor applications.
- 2024 April: Vale announced significant investments in Niobium processing capacity expansion.
- 2024 May: Materion Corporation unveiled a new Beryllium-copper alloy for enhanced performance in demanding aerospace environments.
Strategic Outlook for Strategic Mineral Materials Industry Market
The strategic outlook for the Strategic Mineral Materials Industry is overwhelmingly positive, driven by megatrends such as decarbonization, digitalization, and defense modernization. The accelerating adoption of electric vehicles, expansion of renewable energy grids, and the continuous evolution of consumer electronics will sustain robust demand for critical minerals. Geopolitical efforts to diversify supply chains and reduce reliance on single sources will foster new investment and innovation in exploration, processing, and recycling. Companies that can effectively navigate regulatory landscapes, embrace sustainable practices, and invest in technological advancements will be well-positioned to capitalize on the substantial growth opportunities in this vital sector.
Strategic Mineral Materials Industry Segmentation
-
1. Mineral
-
1.1. Antimony
- 1.1.1. Flame Retardants
- 1.1.2. Batteries
- 1.1.3. Ceramics and Glass
- 1.1.4. Catalyst
- 1.1.5. Alloys
-
1.2. Barite
- 1.2.1. Oil and Gas
- 1.2.2. Other Ap
-
1.3. Beryllium
- 1.3.1. Electronics
- 1.3.2. Aerospace
- 1.3.3. Automotive
- 1.3.4. Energy
-
1.4. Cobalt
- 1.4.1. Superalloys
- 1.4.2. Cemented Carbides and Diamond Tools
- 1.4.3. Catalysts
-
1.5. Fluorspar
- 1.5.1. Chemicals
- 1.5.2. Steel
- 1.5.3. Aluminum
-
1.6. Gallium
- 1.6.1. Integrated Circuits
- 1.6.2. Laser diodes
- 1.6.3. Photodetectors
- 1.6.4. Solar Cells
-
1.7. Germanium
- 1.7.1. Fiber Optics
- 1.7.2. Infrared Optics
- 1.7.3. Electrical and Solar Equipment
-
1.8. Indium
- 1.8.1. Flat-Panel Display Screens and Touchscreens
- 1.8.2. Low Melting Alloys and Solders
- 1.8.3. Semiconductors
- 1.8.4. Transparent Heat Reflectors
-
1.9. Manganese
- 1.9.1. Casting Alloys
- 1.9.2. Packaging
- 1.9.3. Transportation
- 1.9.4. Construction
-
1.10. Niobium
- 1.10.1. Super Alloys
- 1.10.2. Superconducting Magnets
- 1.10.3. Capacitors
-
1.11. Platinum Group Elements
- 1.11.1. Autocatalyst
- 1.11.2. Jewelry
- 1.11.3. Electrical & Electronics
-
1.12. Rare Earth Elements
- 1.12.1. Magnetic Alloys
- 1.12.2. Metallurgy
-
1.13. Tantalum
- 1.13.1. Medical
-
1.1. Antimony
Strategic Mineral Materials Industry Segmentation By Geography
-
1. Asia Pacific
- 1.1. China
- 1.2. India
- 1.3. Japan
- 1.4. South Korea
- 1.5. ASEAN Countries
- 1.6. Rest of Asia Pacific
-
2. North America
- 2.1. United States
- 2.2. Canada
- 2.3. Mexico
-
3. Europe
- 3.1. Germany
- 3.2. United Kingdom
- 3.3. Italy
- 3.4. France
- 3.5. Spain
- 3.6. Rest of Europe
-
4. South America
- 4.1. Brazil
- 4.2. Argentina
- 4.3. Rest of South America
-
5. Middle East and Africa
- 5.1. Saudi Arabia
- 5.2. South Africa
- 5.3. Rest of Middle East and Africa
Strategic Mineral Materials Industry Regional Market Share
Geographic Coverage of Strategic Mineral Materials Industry
Strategic Mineral Materials Industry REPORT HIGHLIGHTS
| Aspects | Details |
|---|---|
| Study Period | 2020-2034 |
| Base Year | 2025 |
| Estimated Year | 2026 |
| Forecast Period | 2026-2034 |
| Historical Period | 2020-2025 |
| Growth Rate | CAGR of 6.3% from 2020-2034 |
| Segmentation |
|
Table of Contents
- 1. Introduction
- 1.1. Research Scope
- 1.2. Market Segmentation
- 1.3. Research Objective
- 1.4. Definitions and Assumptions
- 2. Executive Summary
- 2.1. Market Snapshot
- 3. Market Dynamics
- 3.1. Market Drivers
- 3.2. Market Restrains
- 3.3. Market Trends
- 3.4. Market Opportunities
- 4. Market Factor Analysis
- 4.1. Porters Five Forces
- 4.1.1. Bargaining Power of Suppliers
- 4.1.2. Bargaining Power of Buyers
- 4.1.3. Threat of New Entrants
- 4.1.4. Threat of Substitutes
- 4.1.5. Competitive Rivalry
- 4.2. PESTEL analysis
- 4.3. BCG Analysis
- 4.3.1. Stars (High Growth, High Market Share)
- 4.3.2. Cash Cows (Low Growth, High Market Share)
- 4.3.3. Question Mark (High Growth, Low Market Share)
- 4.3.4. Dogs (Low Growth, Low Market Share)
- 4.4. Ansoff Matrix Analysis
- 4.5. Supply Chain Analysis
- 4.6. Regulatory Landscape
- 4.7. Current Market Potential and Opportunity Assessment (TAM–SAM–SOM Framework)
- 4.8. RAX Analyst Note
- 4.1. Porters Five Forces
- 5. Market Analysis, Insights and Forecast 2021-2033
- 5.1. Market Analysis, Insights and Forecast - by Mineral
- 5.1.1. Antimony
- 5.1.1.1. Flame Retardants
- 5.1.1.2. Batteries
- 5.1.1.3. Ceramics and Glass
- 5.1.1.4. Catalyst
- 5.1.1.5. Alloys
- 5.1.2. Barite
- 5.1.2.1. Oil and Gas
- 5.1.2.2. Other Ap
- 5.1.3. Beryllium
- 5.1.3.1. Electronics
- 5.1.3.2. Aerospace
- 5.1.3.3. Automotive
- 5.1.3.4. Energy
- 5.1.4. Cobalt
- 5.1.4.1. Superalloys
- 5.1.4.2. Cemented Carbides and Diamond Tools
- 5.1.4.3. Catalysts
- 5.1.5. Fluorspar
- 5.1.5.1. Chemicals
- 5.1.5.2. Steel
- 5.1.5.3. Aluminum
- 5.1.6. Gallium
- 5.1.6.1. Integrated Circuits
- 5.1.6.2. Laser diodes
- 5.1.6.3. Photodetectors
- 5.1.6.4. Solar Cells
- 5.1.7. Germanium
- 5.1.7.1. Fiber Optics
- 5.1.7.2. Infrared Optics
- 5.1.7.3. Electrical and Solar Equipment
- 5.1.8. Indium
- 5.1.8.1. Flat-Panel Display Screens and Touchscreens
- 5.1.8.2. Low Melting Alloys and Solders
- 5.1.8.3. Semiconductors
- 5.1.8.4. Transparent Heat Reflectors
- 5.1.9. Manganese
- 5.1.9.1. Casting Alloys
- 5.1.9.2. Packaging
- 5.1.9.3. Transportation
- 5.1.9.4. Construction
- 5.1.10. Niobium
- 5.1.10.1. Super Alloys
- 5.1.10.2. Superconducting Magnets
- 5.1.10.3. Capacitors
- 5.1.11. Platinum Group Elements
- 5.1.11.1. Autocatalyst
- 5.1.11.2. Jewelry
- 5.1.11.3. Electrical & Electronics
- 5.1.12. Rare Earth Elements
- 5.1.12.1. Magnetic Alloys
- 5.1.12.2. Metallurgy
- 5.1.13. Tantalum
- 5.1.13.1. Medical
- 5.1.1. Antimony
- 5.2. Market Analysis, Insights and Forecast - by Region
- 5.2.1. Asia Pacific
- 5.2.2. North America
- 5.2.3. Europe
- 5.2.4. South America
- 5.2.5. Middle East and Africa
- 5.1. Market Analysis, Insights and Forecast - by Mineral
- 6. Global Strategic Mineral Materials Industry Analysis, Insights and Forecast, 2021-2033
- 6.1. Market Analysis, Insights and Forecast - by Mineral
- 6.1.1. Antimony
- 6.1.1.1. Flame Retardants
- 6.1.1.2. Batteries
- 6.1.1.3. Ceramics and Glass
- 6.1.1.4. Catalyst
- 6.1.1.5. Alloys
- 6.1.2. Barite
- 6.1.2.1. Oil and Gas
- 6.1.2.2. Other Ap
- 6.1.3. Beryllium
- 6.1.3.1. Electronics
- 6.1.3.2. Aerospace
- 6.1.3.3. Automotive
- 6.1.3.4. Energy
- 6.1.4. Cobalt
- 6.1.4.1. Superalloys
- 6.1.4.2. Cemented Carbides and Diamond Tools
- 6.1.4.3. Catalysts
- 6.1.5. Fluorspar
- 6.1.5.1. Chemicals
- 6.1.5.2. Steel
- 6.1.5.3. Aluminum
- 6.1.6. Gallium
- 6.1.6.1. Integrated Circuits
- 6.1.6.2. Laser diodes
- 6.1.6.3. Photodetectors
- 6.1.6.4. Solar Cells
- 6.1.7. Germanium
- 6.1.7.1. Fiber Optics
- 6.1.7.2. Infrared Optics
- 6.1.7.3. Electrical and Solar Equipment
- 6.1.8. Indium
- 6.1.8.1. Flat-Panel Display Screens and Touchscreens
- 6.1.8.2. Low Melting Alloys and Solders
- 6.1.8.3. Semiconductors
- 6.1.8.4. Transparent Heat Reflectors
- 6.1.9. Manganese
- 6.1.9.1. Casting Alloys
- 6.1.9.2. Packaging
- 6.1.9.3. Transportation
- 6.1.9.4. Construction
- 6.1.10. Niobium
- 6.1.10.1. Super Alloys
- 6.1.10.2. Superconducting Magnets
- 6.1.10.3. Capacitors
- 6.1.11. Platinum Group Elements
- 6.1.11.1. Autocatalyst
- 6.1.11.2. Jewelry
- 6.1.11.3. Electrical & Electronics
- 6.1.12. Rare Earth Elements
- 6.1.12.1. Magnetic Alloys
- 6.1.12.2. Metallurgy
- 6.1.13. Tantalum
- 6.1.13.1. Medical
- 6.1.1. Antimony
- 6.1. Market Analysis, Insights and Forecast - by Mineral
- 7. Asia Pacific Strategic Mineral Materials Industry Analysis, Insights and Forecast, 2020-2032
- 7.1. Market Analysis, Insights and Forecast - by Mineral
- 7.1.1. Antimony
- 7.1.1.1. Flame Retardants
- 7.1.1.2. Batteries
- 7.1.1.3. Ceramics and Glass
- 7.1.1.4. Catalyst
- 7.1.1.5. Alloys
- 7.1.2. Barite
- 7.1.2.1. Oil and Gas
- 7.1.2.2. Other Ap
- 7.1.3. Beryllium
- 7.1.3.1. Electronics
- 7.1.3.2. Aerospace
- 7.1.3.3. Automotive
- 7.1.3.4. Energy
- 7.1.4. Cobalt
- 7.1.4.1. Superalloys
- 7.1.4.2. Cemented Carbides and Diamond Tools
- 7.1.4.3. Catalysts
- 7.1.5. Fluorspar
- 7.1.5.1. Chemicals
- 7.1.5.2. Steel
- 7.1.5.3. Aluminum
- 7.1.6. Gallium
- 7.1.6.1. Integrated Circuits
- 7.1.6.2. Laser diodes
- 7.1.6.3. Photodetectors
- 7.1.6.4. Solar Cells
- 7.1.7. Germanium
- 7.1.7.1. Fiber Optics
- 7.1.7.2. Infrared Optics
- 7.1.7.3. Electrical and Solar Equipment
- 7.1.8. Indium
- 7.1.8.1. Flat-Panel Display Screens and Touchscreens
- 7.1.8.2. Low Melting Alloys and Solders
- 7.1.8.3. Semiconductors
- 7.1.8.4. Transparent Heat Reflectors
- 7.1.9. Manganese
- 7.1.9.1. Casting Alloys
- 7.1.9.2. Packaging
- 7.1.9.3. Transportation
- 7.1.9.4. Construction
- 7.1.10. Niobium
- 7.1.10.1. Super Alloys
- 7.1.10.2. Superconducting Magnets
- 7.1.10.3. Capacitors
- 7.1.11. Platinum Group Elements
- 7.1.11.1. Autocatalyst
- 7.1.11.2. Jewelry
- 7.1.11.3. Electrical & Electronics
- 7.1.12. Rare Earth Elements
- 7.1.12.1. Magnetic Alloys
- 7.1.12.2. Metallurgy
- 7.1.13. Tantalum
- 7.1.13.1. Medical
- 7.1.1. Antimony
- 7.1. Market Analysis, Insights and Forecast - by Mineral
- 8. North America Strategic Mineral Materials Industry Analysis, Insights and Forecast, 2020-2032
- 8.1. Market Analysis, Insights and Forecast - by Mineral
- 8.1.1. Antimony
- 8.1.1.1. Flame Retardants
- 8.1.1.2. Batteries
- 8.1.1.3. Ceramics and Glass
- 8.1.1.4. Catalyst
- 8.1.1.5. Alloys
- 8.1.2. Barite
- 8.1.2.1. Oil and Gas
- 8.1.2.2. Other Ap
- 8.1.3. Beryllium
- 8.1.3.1. Electronics
- 8.1.3.2. Aerospace
- 8.1.3.3. Automotive
- 8.1.3.4. Energy
- 8.1.4. Cobalt
- 8.1.4.1. Superalloys
- 8.1.4.2. Cemented Carbides and Diamond Tools
- 8.1.4.3. Catalysts
- 8.1.5. Fluorspar
- 8.1.5.1. Chemicals
- 8.1.5.2. Steel
- 8.1.5.3. Aluminum
- 8.1.6. Gallium
- 8.1.6.1. Integrated Circuits
- 8.1.6.2. Laser diodes
- 8.1.6.3. Photodetectors
- 8.1.6.4. Solar Cells
- 8.1.7. Germanium
- 8.1.7.1. Fiber Optics
- 8.1.7.2. Infrared Optics
- 8.1.7.3. Electrical and Solar Equipment
- 8.1.8. Indium
- 8.1.8.1. Flat-Panel Display Screens and Touchscreens
- 8.1.8.2. Low Melting Alloys and Solders
- 8.1.8.3. Semiconductors
- 8.1.8.4. Transparent Heat Reflectors
- 8.1.9. Manganese
- 8.1.9.1. Casting Alloys
- 8.1.9.2. Packaging
- 8.1.9.3. Transportation
- 8.1.9.4. Construction
- 8.1.10. Niobium
- 8.1.10.1. Super Alloys
- 8.1.10.2. Superconducting Magnets
- 8.1.10.3. Capacitors
- 8.1.11. Platinum Group Elements
- 8.1.11.1. Autocatalyst
- 8.1.11.2. Jewelry
- 8.1.11.3. Electrical & Electronics
- 8.1.12. Rare Earth Elements
- 8.1.12.1. Magnetic Alloys
- 8.1.12.2. Metallurgy
- 8.1.13. Tantalum
- 8.1.13.1. Medical
- 8.1.1. Antimony
- 8.1. Market Analysis, Insights and Forecast - by Mineral
- 9. Europe Strategic Mineral Materials Industry Analysis, Insights and Forecast, 2020-2032
- 9.1. Market Analysis, Insights and Forecast - by Mineral
- 9.1.1. Antimony
- 9.1.1.1. Flame Retardants
- 9.1.1.2. Batteries
- 9.1.1.3. Ceramics and Glass
- 9.1.1.4. Catalyst
- 9.1.1.5. Alloys
- 9.1.2. Barite
- 9.1.2.1. Oil and Gas
- 9.1.2.2. Other Ap
- 9.1.3. Beryllium
- 9.1.3.1. Electronics
- 9.1.3.2. Aerospace
- 9.1.3.3. Automotive
- 9.1.3.4. Energy
- 9.1.4. Cobalt
- 9.1.4.1. Superalloys
- 9.1.4.2. Cemented Carbides and Diamond Tools
- 9.1.4.3. Catalysts
- 9.1.5. Fluorspar
- 9.1.5.1. Chemicals
- 9.1.5.2. Steel
- 9.1.5.3. Aluminum
- 9.1.6. Gallium
- 9.1.6.1. Integrated Circuits
- 9.1.6.2. Laser diodes
- 9.1.6.3. Photodetectors
- 9.1.6.4. Solar Cells
- 9.1.7. Germanium
- 9.1.7.1. Fiber Optics
- 9.1.7.2. Infrared Optics
- 9.1.7.3. Electrical and Solar Equipment
- 9.1.8. Indium
- 9.1.8.1. Flat-Panel Display Screens and Touchscreens
- 9.1.8.2. Low Melting Alloys and Solders
- 9.1.8.3. Semiconductors
- 9.1.8.4. Transparent Heat Reflectors
- 9.1.9. Manganese
- 9.1.9.1. Casting Alloys
- 9.1.9.2. Packaging
- 9.1.9.3. Transportation
- 9.1.9.4. Construction
- 9.1.10. Niobium
- 9.1.10.1. Super Alloys
- 9.1.10.2. Superconducting Magnets
- 9.1.10.3. Capacitors
- 9.1.11. Platinum Group Elements
- 9.1.11.1. Autocatalyst
- 9.1.11.2. Jewelry
- 9.1.11.3. Electrical & Electronics
- 9.1.12. Rare Earth Elements
- 9.1.12.1. Magnetic Alloys
- 9.1.12.2. Metallurgy
- 9.1.13. Tantalum
- 9.1.13.1. Medical
- 9.1.1. Antimony
- 9.1. Market Analysis, Insights and Forecast - by Mineral
- 10. South America Strategic Mineral Materials Industry Analysis, Insights and Forecast, 2020-2032
- 10.1. Market Analysis, Insights and Forecast - by Mineral
- 10.1.1. Antimony
- 10.1.1.1. Flame Retardants
- 10.1.1.2. Batteries
- 10.1.1.3. Ceramics and Glass
- 10.1.1.4. Catalyst
- 10.1.1.5. Alloys
- 10.1.2. Barite
- 10.1.2.1. Oil and Gas
- 10.1.2.2. Other Ap
- 10.1.3. Beryllium
- 10.1.3.1. Electronics
- 10.1.3.2. Aerospace
- 10.1.3.3. Automotive
- 10.1.3.4. Energy
- 10.1.4. Cobalt
- 10.1.4.1. Superalloys
- 10.1.4.2. Cemented Carbides and Diamond Tools
- 10.1.4.3. Catalysts
- 10.1.5. Fluorspar
- 10.1.5.1. Chemicals
- 10.1.5.2. Steel
- 10.1.5.3. Aluminum
- 10.1.6. Gallium
- 10.1.6.1. Integrated Circuits
- 10.1.6.2. Laser diodes
- 10.1.6.3. Photodetectors
- 10.1.6.4. Solar Cells
- 10.1.7. Germanium
- 10.1.7.1. Fiber Optics
- 10.1.7.2. Infrared Optics
- 10.1.7.3. Electrical and Solar Equipment
- 10.1.8. Indium
- 10.1.8.1. Flat-Panel Display Screens and Touchscreens
- 10.1.8.2. Low Melting Alloys and Solders
- 10.1.8.3. Semiconductors
- 10.1.8.4. Transparent Heat Reflectors
- 10.1.9. Manganese
- 10.1.9.1. Casting Alloys
- 10.1.9.2. Packaging
- 10.1.9.3. Transportation
- 10.1.9.4. Construction
- 10.1.10. Niobium
- 10.1.10.1. Super Alloys
- 10.1.10.2. Superconducting Magnets
- 10.1.10.3. Capacitors
- 10.1.11. Platinum Group Elements
- 10.1.11.1. Autocatalyst
- 10.1.11.2. Jewelry
- 10.1.11.3. Electrical & Electronics
- 10.1.12. Rare Earth Elements
- 10.1.12.1. Magnetic Alloys
- 10.1.12.2. Metallurgy
- 10.1.13. Tantalum
- 10.1.13.1. Medical
- 10.1.1. Antimony
- 10.1. Market Analysis, Insights and Forecast - by Mineral
- 11. Middle East and Africa Strategic Mineral Materials Industry Analysis, Insights and Forecast, 2020-2032
- 11.1. Market Analysis, Insights and Forecast - by Mineral
- 11.1.1. Antimony
- 11.1.1.1. Flame Retardants
- 11.1.1.2. Batteries
- 11.1.1.3. Ceramics and Glass
- 11.1.1.4. Catalyst
- 11.1.1.5. Alloys
- 11.1.2. Barite
- 11.1.2.1. Oil and Gas
- 11.1.2.2. Other Ap
- 11.1.3. Beryllium
- 11.1.3.1. Electronics
- 11.1.3.2. Aerospace
- 11.1.3.3. Automotive
- 11.1.3.4. Energy
- 11.1.4. Cobalt
- 11.1.4.1. Superalloys
- 11.1.4.2. Cemented Carbides and Diamond Tools
- 11.1.4.3. Catalysts
- 11.1.5. Fluorspar
- 11.1.5.1. Chemicals
- 11.1.5.2. Steel
- 11.1.5.3. Aluminum
- 11.1.6. Gallium
- 11.1.6.1. Integrated Circuits
- 11.1.6.2. Laser diodes
- 11.1.6.3. Photodetectors
- 11.1.6.4. Solar Cells
- 11.1.7. Germanium
- 11.1.7.1. Fiber Optics
- 11.1.7.2. Infrared Optics
- 11.1.7.3. Electrical and Solar Equipment
- 11.1.8. Indium
- 11.1.8.1. Flat-Panel Display Screens and Touchscreens
- 11.1.8.2. Low Melting Alloys and Solders
- 11.1.8.3. Semiconductors
- 11.1.8.4. Transparent Heat Reflectors
- 11.1.9. Manganese
- 11.1.9.1. Casting Alloys
- 11.1.9.2. Packaging
- 11.1.9.3. Transportation
- 11.1.9.4. Construction
- 11.1.10. Niobium
- 11.1.10.1. Super Alloys
- 11.1.10.2. Superconducting Magnets
- 11.1.10.3. Capacitors
- 11.1.11. Platinum Group Elements
- 11.1.11.1. Autocatalyst
- 11.1.11.2. Jewelry
- 11.1.11.3. Electrical & Electronics
- 11.1.12. Rare Earth Elements
- 11.1.12.1. Magnetic Alloys
- 11.1.12.2. Metallurgy
- 11.1.13. Tantalum
- 11.1.13.1. Medical
- 11.1.1. Antimony
- 11.1. Market Analysis, Insights and Forecast - by Mineral
- 12. Competitive Analysis
- 12.1. Company Profiles
- 12.1.1 CBMM
- 12.1.1.1. Company Overview
- 12.1.1.2. Products
- 12.1.1.3. Company Financials
- 12.1.1.4. SWOT Analysis
- 12.1.2 South32
- 12.1.2.1. Company Overview
- 12.1.2.2. Products
- 12.1.2.3. Company Financials
- 12.1.2.4. SWOT Analysis
- 12.1.3 Intercontinental Mining
- 12.1.3.1. Company Overview
- 12.1.3.2. Products
- 12.1.3.3. Company Financials
- 12.1.3.4. SWOT Analysis
- 12.1.4 Indium Corporation
- 12.1.4.1. Company Overview
- 12.1.4.2. Products
- 12.1.4.3. Company Financials
- 12.1.4.4. SWOT Analysis
- 12.1.5 WARRIOR GOLD INC
- 12.1.5.1. Company Overview
- 12.1.5.2. Products
- 12.1.5.3. Company Financials
- 12.1.5.4. SWOT Analysis
- 12.1.6 Anglo American plc
- 12.1.6.1. Company Overview
- 12.1.6.2. Products
- 12.1.6.3. Company Financials
- 12.1.6.4. SWOT Analysis
- 12.1.7 Glencore
- 12.1.7.1. Company Overview
- 12.1.7.2. Products
- 12.1.7.3. Company Financials
- 12.1.7.4. SWOT Analysis
- 12.1.8 Vale
- 12.1.8.1. Company Overview
- 12.1.8.2. Products
- 12.1.8.3. Company Financials
- 12.1.8.4. SWOT Analysis
- 12.1.9 Materion Corporation
- 12.1.9.1. Company Overview
- 12.1.9.2. Products
- 12.1.9.3. Company Financials
- 12.1.9.4. SWOT Analysis
- 12.1.1 CBMM
- 12.2. Market Entropy
- 12.2.1 Company's Key Areas Served
- 12.2.2 Recent Developments
- 12.3. Company Market Share Analysis 2025
- 12.3.1 Top 5 Companies Market Share Analysis
- 12.3.2 Top 3 Companies Market Share Analysis
- 12.4. List of Potential Customers
- 13. Research Methodology
List of Figures
- Figure 1: Global Strategic Mineral Materials Industry Revenue Breakdown (billion, %) by Region 2025 & 2033
- Figure 2: Global Strategic Mineral Materials Industry Volume Breakdown (K Tons, %) by Region 2025 & 2033
- Figure 3: Asia Pacific Strategic Mineral Materials Industry Revenue (billion), by Mineral 2025 & 2033
- Figure 4: Asia Pacific Strategic Mineral Materials Industry Volume (K Tons), by Mineral 2025 & 2033
- Figure 5: Asia Pacific Strategic Mineral Materials Industry Revenue Share (%), by Mineral 2025 & 2033
- Figure 6: Asia Pacific Strategic Mineral Materials Industry Volume Share (%), by Mineral 2025 & 2033
- Figure 7: Asia Pacific Strategic Mineral Materials Industry Revenue (billion), by Country 2025 & 2033
- Figure 8: Asia Pacific Strategic Mineral Materials Industry Volume (K Tons), by Country 2025 & 2033
- Figure 9: Asia Pacific Strategic Mineral Materials Industry Revenue Share (%), by Country 2025 & 2033
- Figure 10: Asia Pacific Strategic Mineral Materials Industry Volume Share (%), by Country 2025 & 2033
- Figure 11: North America Strategic Mineral Materials Industry Revenue (billion), by Mineral 2025 & 2033
- Figure 12: North America Strategic Mineral Materials Industry Volume (K Tons), by Mineral 2025 & 2033
- Figure 13: North America Strategic Mineral Materials Industry Revenue Share (%), by Mineral 2025 & 2033
- Figure 14: North America Strategic Mineral Materials Industry Volume Share (%), by Mineral 2025 & 2033
- Figure 15: North America Strategic Mineral Materials Industry Revenue (billion), by Country 2025 & 2033
- Figure 16: North America Strategic Mineral Materials Industry Volume (K Tons), by Country 2025 & 2033
- Figure 17: North America Strategic Mineral Materials Industry Revenue Share (%), by Country 2025 & 2033
- Figure 18: North America Strategic Mineral Materials Industry Volume Share (%), by Country 2025 & 2033
- Figure 19: Europe Strategic Mineral Materials Industry Revenue (billion), by Mineral 2025 & 2033
- Figure 20: Europe Strategic Mineral Materials Industry Volume (K Tons), by Mineral 2025 & 2033
- Figure 21: Europe Strategic Mineral Materials Industry Revenue Share (%), by Mineral 2025 & 2033
- Figure 22: Europe Strategic Mineral Materials Industry Volume Share (%), by Mineral 2025 & 2033
- Figure 23: Europe Strategic Mineral Materials Industry Revenue (billion), by Country 2025 & 2033
- Figure 24: Europe Strategic Mineral Materials Industry Volume (K Tons), by Country 2025 & 2033
- Figure 25: Europe Strategic Mineral Materials Industry Revenue Share (%), by Country 2025 & 2033
- Figure 26: Europe Strategic Mineral Materials Industry Volume Share (%), by Country 2025 & 2033
- Figure 27: South America Strategic Mineral Materials Industry Revenue (billion), by Mineral 2025 & 2033
- Figure 28: South America Strategic Mineral Materials Industry Volume (K Tons), by Mineral 2025 & 2033
- Figure 29: South America Strategic Mineral Materials Industry Revenue Share (%), by Mineral 2025 & 2033
- Figure 30: South America Strategic Mineral Materials Industry Volume Share (%), by Mineral 2025 & 2033
- Figure 31: South America Strategic Mineral Materials Industry Revenue (billion), by Country 2025 & 2033
- Figure 32: South America Strategic Mineral Materials Industry Volume (K Tons), by Country 2025 & 2033
- Figure 33: South America Strategic Mineral Materials Industry Revenue Share (%), by Country 2025 & 2033
- Figure 34: South America Strategic Mineral Materials Industry Volume Share (%), by Country 2025 & 2033
- Figure 35: Middle East and Africa Strategic Mineral Materials Industry Revenue (billion), by Mineral 2025 & 2033
- Figure 36: Middle East and Africa Strategic Mineral Materials Industry Volume (K Tons), by Mineral 2025 & 2033
- Figure 37: Middle East and Africa Strategic Mineral Materials Industry Revenue Share (%), by Mineral 2025 & 2033
- Figure 38: Middle East and Africa Strategic Mineral Materials Industry Volume Share (%), by Mineral 2025 & 2033
- Figure 39: Middle East and Africa Strategic Mineral Materials Industry Revenue (billion), by Country 2025 & 2033
- Figure 40: Middle East and Africa Strategic Mineral Materials Industry Volume (K Tons), by Country 2025 & 2033
- Figure 41: Middle East and Africa Strategic Mineral Materials Industry Revenue Share (%), by Country 2025 & 2033
- Figure 42: Middle East and Africa Strategic Mineral Materials Industry Volume Share (%), by Country 2025 & 2033
List of Tables
- Table 1: Global Strategic Mineral Materials Industry Revenue billion Forecast, by Mineral 2020 & 2033
- Table 2: Global Strategic Mineral Materials Industry Volume K Tons Forecast, by Mineral 2020 & 2033
- Table 3: Global Strategic Mineral Materials Industry Revenue billion Forecast, by Region 2020 & 2033
- Table 4: Global Strategic Mineral Materials Industry Volume K Tons Forecast, by Region 2020 & 2033
- Table 5: Global Strategic Mineral Materials Industry Revenue billion Forecast, by Mineral 2020 & 2033
- Table 6: Global Strategic Mineral Materials Industry Volume K Tons Forecast, by Mineral 2020 & 2033
- Table 7: Global Strategic Mineral Materials Industry Revenue billion Forecast, by Country 2020 & 2033
- Table 8: Global Strategic Mineral Materials Industry Volume K Tons Forecast, by Country 2020 & 2033
- Table 9: China Strategic Mineral Materials Industry Revenue (billion) Forecast, by Application 2020 & 2033
- Table 10: China Strategic Mineral Materials Industry Volume (K Tons) Forecast, by Application 2020 & 2033
- Table 11: India Strategic Mineral Materials Industry Revenue (billion) Forecast, by Application 2020 & 2033
- Table 12: India Strategic Mineral Materials Industry Volume (K Tons) Forecast, by Application 2020 & 2033
- Table 13: Japan Strategic Mineral Materials Industry Revenue (billion) Forecast, by Application 2020 & 2033
- Table 14: Japan Strategic Mineral Materials Industry Volume (K Tons) Forecast, by Application 2020 & 2033
- Table 15: South Korea Strategic Mineral Materials Industry Revenue (billion) Forecast, by Application 2020 & 2033
- Table 16: South Korea Strategic Mineral Materials Industry Volume (K Tons) Forecast, by Application 2020 & 2033
- Table 17: ASEAN Countries Strategic Mineral Materials Industry Revenue (billion) Forecast, by Application 2020 & 2033
- Table 18: ASEAN Countries Strategic Mineral Materials Industry Volume (K Tons) Forecast, by Application 2020 & 2033
- Table 19: Rest of Asia Pacific Strategic Mineral Materials Industry Revenue (billion) Forecast, by Application 2020 & 2033
- Table 20: Rest of Asia Pacific Strategic Mineral Materials Industry Volume (K Tons) Forecast, by Application 2020 & 2033
- Table 21: Global Strategic Mineral Materials Industry Revenue billion Forecast, by Mineral 2020 & 2033
- Table 22: Global Strategic Mineral Materials Industry Volume K Tons Forecast, by Mineral 2020 & 2033
- Table 23: Global Strategic Mineral Materials Industry Revenue billion Forecast, by Country 2020 & 2033
- Table 24: Global Strategic Mineral Materials Industry Volume K Tons Forecast, by Country 2020 & 2033
- Table 25: United States Strategic Mineral Materials Industry Revenue (billion) Forecast, by Application 2020 & 2033
- Table 26: United States Strategic Mineral Materials Industry Volume (K Tons) Forecast, by Application 2020 & 2033
- Table 27: Canada Strategic Mineral Materials Industry Revenue (billion) Forecast, by Application 2020 & 2033
- Table 28: Canada Strategic Mineral Materials Industry Volume (K Tons) Forecast, by Application 2020 & 2033
- Table 29: Mexico Strategic Mineral Materials Industry Revenue (billion) Forecast, by Application 2020 & 2033
- Table 30: Mexico Strategic Mineral Materials Industry Volume (K Tons) Forecast, by Application 2020 & 2033
- Table 31: Global Strategic Mineral Materials Industry Revenue billion Forecast, by Mineral 2020 & 2033
- Table 32: Global Strategic Mineral Materials Industry Volume K Tons Forecast, by Mineral 2020 & 2033
- Table 33: Global Strategic Mineral Materials Industry Revenue billion Forecast, by Country 2020 & 2033
- Table 34: Global Strategic Mineral Materials Industry Volume K Tons Forecast, by Country 2020 & 2033
- Table 35: Germany Strategic Mineral Materials Industry Revenue (billion) Forecast, by Application 2020 & 2033
- Table 36: Germany Strategic Mineral Materials Industry Volume (K Tons) Forecast, by Application 2020 & 2033
- Table 37: United Kingdom Strategic Mineral Materials Industry Revenue (billion) Forecast, by Application 2020 & 2033
- Table 38: United Kingdom Strategic Mineral Materials Industry Volume (K Tons) Forecast, by Application 2020 & 2033
- Table 39: Italy Strategic Mineral Materials Industry Revenue (billion) Forecast, by Application 2020 & 2033
- Table 40: Italy Strategic Mineral Materials Industry Volume (K Tons) Forecast, by Application 2020 & 2033
- Table 41: France Strategic Mineral Materials Industry Revenue (billion) Forecast, by Application 2020 & 2033
- Table 42: France Strategic Mineral Materials Industry Volume (K Tons) Forecast, by Application 2020 & 2033
- Table 43: Spain Strategic Mineral Materials Industry Revenue (billion) Forecast, by Application 2020 & 2033
- Table 44: Spain Strategic Mineral Materials Industry Volume (K Tons) Forecast, by Application 2020 & 2033
- Table 45: Rest of Europe Strategic Mineral Materials Industry Revenue (billion) Forecast, by Application 2020 & 2033
- Table 46: Rest of Europe Strategic Mineral Materials Industry Volume (K Tons) Forecast, by Application 2020 & 2033
- Table 47: Global Strategic Mineral Materials Industry Revenue billion Forecast, by Mineral 2020 & 2033
- Table 48: Global Strategic Mineral Materials Industry Volume K Tons Forecast, by Mineral 2020 & 2033
- Table 49: Global Strategic Mineral Materials Industry Revenue billion Forecast, by Country 2020 & 2033
- Table 50: Global Strategic Mineral Materials Industry Volume K Tons Forecast, by Country 2020 & 2033
- Table 51: Brazil Strategic Mineral Materials Industry Revenue (billion) Forecast, by Application 2020 & 2033
- Table 52: Brazil Strategic Mineral Materials Industry Volume (K Tons) Forecast, by Application 2020 & 2033
- Table 53: Argentina Strategic Mineral Materials Industry Revenue (billion) Forecast, by Application 2020 & 2033
- Table 54: Argentina Strategic Mineral Materials Industry Volume (K Tons) Forecast, by Application 2020 & 2033
- Table 55: Rest of South America Strategic Mineral Materials Industry Revenue (billion) Forecast, by Application 2020 & 2033
- Table 56: Rest of South America Strategic Mineral Materials Industry Volume (K Tons) Forecast, by Application 2020 & 2033
- Table 57: Global Strategic Mineral Materials Industry Revenue billion Forecast, by Mineral 2020 & 2033
- Table 58: Global Strategic Mineral Materials Industry Volume K Tons Forecast, by Mineral 2020 & 2033
- Table 59: Global Strategic Mineral Materials Industry Revenue billion Forecast, by Country 2020 & 2033
- Table 60: Global Strategic Mineral Materials Industry Volume K Tons Forecast, by Country 2020 & 2033
- Table 61: Saudi Arabia Strategic Mineral Materials Industry Revenue (billion) Forecast, by Application 2020 & 2033
- Table 62: Saudi Arabia Strategic Mineral Materials Industry Volume (K Tons) Forecast, by Application 2020 & 2033
- Table 63: South Africa Strategic Mineral Materials Industry Revenue (billion) Forecast, by Application 2020 & 2033
- Table 64: South Africa Strategic Mineral Materials Industry Volume (K Tons) Forecast, by Application 2020 & 2033
- Table 65: Rest of Middle East and Africa Strategic Mineral Materials Industry Revenue (billion) Forecast, by Application 2020 & 2033
- Table 66: Rest of Middle East and Africa Strategic Mineral Materials Industry Volume (K Tons) Forecast, by Application 2020 & 2033
Frequently Asked Questions
1. What is the projected Compound Annual Growth Rate (CAGR) of the Strategic Mineral Materials Industry?
The projected CAGR is approximately 6.3%.
2. Which companies are prominent players in the Strategic Mineral Materials Industry?
Key companies in the market include CBMM, South32, Intercontinental Mining, Indium Corporation, WARRIOR GOLD INC , Anglo American plc, Glencore, Vale, Materion Corporation.
3. What are the main segments of the Strategic Mineral Materials Industry?
The market segments include Mineral.
4. Can you provide details about the market size?
The market size is estimated to be USD 8.9 billion as of 2022.
5. What are some drivers contributing to market growth?
; Growing Demand from Various End-user Industries; Other Drivers.
6. What are the notable trends driving market growth?
Steel Application to Dominate the Niobium Segment.
7. Are there any restraints impacting market growth?
; Impact of COVID-19 Pandemic; Growing Environmental Concerns over Mining Operations.
8. Can you provide examples of recent developments in the market?
N/A
9. What pricing options are available for accessing the report?
Pricing options include single-user, multi-user, and enterprise licenses priced at USD 4750, USD 5250, and USD 8750 respectively.
10. Is the market size provided in terms of value or volume?
The market size is provided in terms of value, measured in billion and volume, measured in K Tons.
11. Are there any specific market keywords associated with the report?
Yes, the market keyword associated with the report is "Strategic Mineral Materials Industry," which aids in identifying and referencing the specific market segment covered.
12. How do I determine which pricing option suits my needs best?
The pricing options vary based on user requirements and access needs. Individual users may opt for single-user licenses, while businesses requiring broader access may choose multi-user or enterprise licenses for cost-effective access to the report.
13. Are there any additional resources or data provided in the Strategic Mineral Materials Industry report?
While the report offers comprehensive insights, it's advisable to review the specific contents or supplementary materials provided to ascertain if additional resources or data are available.
14. How can I stay updated on further developments or reports in the Strategic Mineral Materials Industry?
To stay informed about further developments, trends, and reports in the Strategic Mineral Materials Industry, consider subscribing to industry newsletters, following relevant companies and organizations, or regularly checking reputable industry news sources and publications.
Methodology
Step 1 - Identification of Relevant Samples Size from Population Database


Step 2 - Approaches for Defining Global Market Size (Value, Volume* & Price*)

Note*: In applicable scenarios
Step 3 - Data Sources
Primary Research
- Web Analytics
- Survey Reports
- Research Institute
- Latest Research Reports
- Opinion Leaders
Secondary Research
- Annual Reports
- White Paper
- Latest Press Release
- Industry Association
- Paid Database
- Investor Presentations

Step 4 - Data Triangulation
Involves using different sources of information in order to increase the validity of a study
These sources are likely to be stakeholders in a program - participants, other researchers, program staff, other community members, and so on.
Then we put all data in single framework & apply various statistical tools to find out the dynamic on the market.
During the analysis stage, feedback from the stakeholder groups would be compared to determine areas of agreement as well as areas of divergence