

Key Insights
The global stroller market is a dynamic sector characterized by continuous innovation and evolving parental preferences. While precise market size figures are unavailable, a reasonable estimation based on industry reports and publicly available data from leading companies like Goodbaby and Bugaboo suggests a current market value in the billions of dollars. The Compound Annual Growth Rate (CAGR) is likely to hover around 5-7%, driven by several key factors. Increasing urbanization and the rising number of nuclear families contribute to higher stroller demand. Furthermore, technological advancements resulting in lightweight, maneuverable, and feature-rich designs (e.g., all-terrain strollers, travel systems) are fueling market expansion. Parents are increasingly willing to invest in premium strollers offering enhanced comfort and safety features for their children, reflecting a growing focus on child well-being.
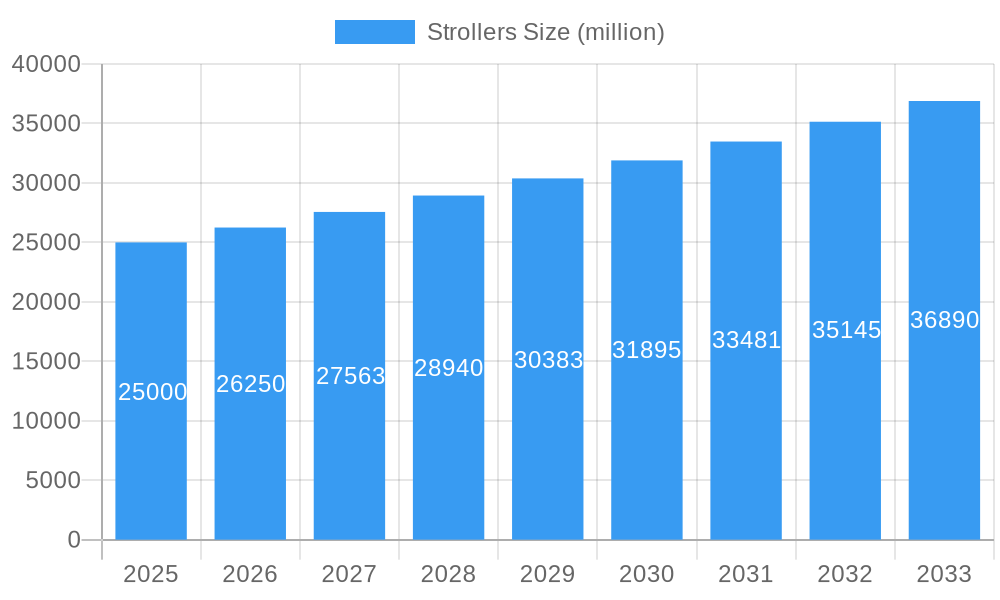
Strollers Market Size (In Billion)
However, economic downturns and fluctuations in disposable income can act as significant restraints, particularly impacting sales of higher-priced models. Competitive pricing strategies from established players and the entry of new brands also influence market dynamics. The market is segmented by stroller type (e.g., full-size, jogging, travel systems, umbrella strollers), price range, material, and region. Key geographic regions showing strong growth include North America, Europe, and Asia-Pacific, fueled by rising disposable incomes and changing lifestyles in these areas. The presence of both global giants like Goodbaby and niche players specializing in innovative designs creates a competitive landscape where continuous product development and effective marketing are crucial for success.
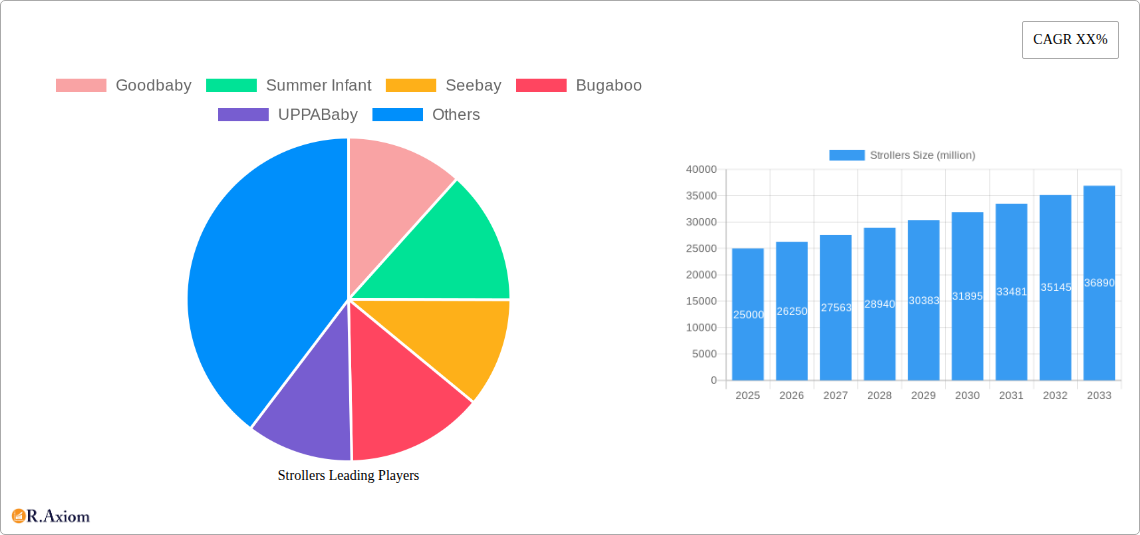
Strollers Company Market Share
Strollers Market Report: A Comprehensive Analysis (2019-2033)
This comprehensive report provides an in-depth analysis of the global strollers market, encompassing market size, growth drivers, competitive landscape, and future outlook. The study period spans from 2019 to 2033, with 2025 serving as both the base and estimated year. The forecast period covers 2025-2033, and the historical period encompasses 2019-2024. This report is invaluable for industry stakeholders, investors, and businesses seeking to understand the dynamics of this multi-million dollar market.
Strollers Market Concentration & Innovation
This section analyzes the competitive landscape of the stroller market, examining market concentration, innovation drivers, regulatory frameworks, product substitutes, end-user trends, and M&A activities. Key players such as Goodbaby, Summer Infant, Bugaboo, and UPPABaby hold significant market share, though the exact figures fluctuate year to year. The market is characterized by a mix of large, established players and smaller, niche brands. Innovation is driven by factors such as enhanced safety features, lightweight designs, improved maneuverability, and technological integrations (e.g., smart features and connectivity). Regulatory frameworks related to product safety and standards vary across regions, influencing product design and manufacturing. The stroller market faces competition from alternative baby transport solutions such as slings and carriers.
- Market Concentration: The top 5 players collectively hold an estimated xx% of the global market share in 2025.
- Innovation Drivers: Lightweight materials, improved suspension systems, and integration of smart technology are key innovation drivers.
- M&A Activity: The past five years have witnessed approximately xx million USD in M&A deals within the stroller market, with a notable increase in consolidation among smaller players.
- End-User Trends: Growing preference for lightweight and compact strollers, particularly in urban areas, is shaping market demand.
Strollers Industry Trends & Insights
The global stroller market is expected to experience robust growth over the forecast period, driven by several factors. The rising global birth rate, increasing disposable incomes in developing economies, and growing preference for convenient and safe baby transportation solutions contribute significantly to market expansion. Technological advancements, such as the incorporation of advanced materials and smart features, are further enhancing market growth. Consumer preferences are evolving towards strollers with improved maneuverability, compact designs, and specialized functionalities catering to different lifestyles. Competitive dynamics are characterized by both price competition and innovation-driven differentiation. The Compound Annual Growth Rate (CAGR) for the global stroller market is projected to be xx% from 2025 to 2033, with market penetration expected to increase significantly in emerging markets. xx million strollers were sold globally in 2024.
Dominant Markets & Segments in Strollers
The stroller market displays regional variations in dominance. North America and Europe currently hold significant market shares, driven by factors such as high disposable incomes, a well-established retail infrastructure, and strong consumer awareness of premium stroller brands. However, Asia Pacific is showing significant growth potential. The single stroller segment maintains the largest market share, driven by its affordability and wide availability. However, the double and travel stroller segments are expected to experience strong growth.
- Key Drivers in North America: Strong consumer preference for premium brands, high disposable incomes.
- Key Drivers in Asia Pacific: Rapid urbanization, rising disposable incomes, increasing birth rates.
- Key Drivers in Europe: Stringent safety regulations, well-established distribution networks.
- Segment Analysis: Single strollers command the largest share, followed by double strollers and then travel systems.
Strollers Product Developments
Recent product innovations include lightweight materials like aluminum and carbon fiber, enhanced suspension systems for smoother rides, improved maneuverability with all-terrain wheels, and the incorporation of smart features like GPS tracking and app integration. These developments cater to evolving consumer preferences for convenience, safety, and technological integration.
Report Scope & Segmentation Analysis
This report segments the stroller market by type (single, double, tandem, jogging, travel system), by material (aluminum, plastic, fabric), by price range (budget, mid-range, premium), and by distribution channel (online, offline). Each segment’s growth projections, market sizes, and competitive dynamics are analyzed. The premium segment is expected to demonstrate higher growth rates due to increased disposable income and consumer demand for advanced features.
Key Drivers of Strollers Growth
The primary growth drivers include rising birth rates globally, increasing disposable incomes, particularly in emerging economies, changing lifestyles and preferences toward convenient and safe baby transportation solutions, and technological advancements. Favorable government policies promoting family-friendly initiatives in some countries are further stimulating market growth.
Challenges in the Strollers Sector
Challenges faced by the industry include increasing raw material costs, fluctuating currency exchange rates impacting international trade, stringent safety regulations, and intense competition among established players and new entrants. Supply chain disruptions can significantly impact product availability and pricing.
Emerging Opportunities in Strollers
Emerging opportunities lie in the development of eco-friendly materials, personalized stroller customization, and the expansion into emerging markets with growing birth rates and rising disposable incomes. The integration of smart features and enhanced connectivity holds considerable potential for future growth.
Leading Players in the Strollers Market
- Goodbaby
- Summer Infant
- Seebay
- Bugaboo
- UPPABaby
- Stokke
- 4moms
- Aprica
- Baby Jogger
- ABC Design
- Peg Perego
- Shenma Group
- Combi
- Britax
- Quinny
- Valco Baby
- Phil & Teds
- Zooper
- Thule
- Emmaljunga
- Bumbleride
Key Developments in Strollers Industry
- 2022 Q4: Goodbaby launched a new line of lightweight strollers incorporating smart technology.
- 2023 Q1: Summer Infant acquired a smaller competitor, expanding its market share.
- 2023 Q2: New safety regulations were implemented in the EU, impacting stroller designs. (Further details on key developments will be added in the full report)
Strategic Outlook for Strollers Market
The global stroller market is poised for sustained growth, driven by evolving consumer preferences and technological advancements. Opportunities exist in developing innovative products that address unmet needs, expanding into underserved markets, and leveraging digital platforms to enhance customer engagement. Focusing on sustainability and incorporating eco-friendly materials will also appeal to environmentally conscious consumers. The market is expected to reach xx million USD by 2033, presenting significant potential for growth and investment.
Strollers Segmentation
-
1. Application
- 1.1. 0 - 1 Year Old
- 1.2. 1 - 2.5 Years Old
- 1.3. Older than 2.5 years
-
2. Types
- 2.1. Single Strollers
- 2.2. Multi Strollers (2 or more)
Strollers Segmentation By Geography
-
1. North America
- 1.1. United States
- 1.2. Canada
- 1.3. Mexico
-
2. South America
- 2.1. Brazil
- 2.2. Argentina
- 2.3. Rest of South America
-
3. Europe
- 3.1. United Kingdom
- 3.2. Germany
- 3.3. France
- 3.4. Italy
- 3.5. Spain
- 3.6. Russia
- 3.7. Benelux
- 3.8. Nordics
- 3.9. Rest of Europe
-
4. Middle East & Africa
- 4.1. Turkey
- 4.2. Israel
- 4.3. GCC
- 4.4. North Africa
- 4.5. South Africa
- 4.6. Rest of Middle East & Africa
-
5. Asia Pacific
- 5.1. China
- 5.2. India
- 5.3. Japan
- 5.4. South Korea
- 5.5. ASEAN
- 5.6. Oceania
- 5.7. Rest of Asia Pacific

Strollers Regional Market Share
Geographic Coverage of Strollers
Strollers REPORT HIGHLIGHTS
| Aspects | Details |
|---|---|
| Study Period | 2020-2034 |
| Base Year | 2025 |
| Estimated Year | 2026 |
| Forecast Period | 2026-2034 |
| Historical Period | 2020-2025 |
| Growth Rate | CAGR of 5.82% from 2020-2034 |
| Segmentation |
|
Table of Contents
- 1. Introduction
- 1.1. Research Scope
- 1.2. Market Segmentation
- 1.3. Research Objective
- 1.4. Definitions and Assumptions
- 2. Executive Summary
- 2.1. Market Snapshot
- 3. Market Dynamics
- 3.1. Market Drivers
- 3.2. Market Restrains
- 3.3. Market Trends
- 3.4. Market Opportunities
- 4. Market Factor Analysis
- 4.1. Porters Five Forces
- 4.1.1. Bargaining Power of Suppliers
- 4.1.2. Bargaining Power of Buyers
- 4.1.3. Threat of New Entrants
- 4.1.4. Threat of Substitutes
- 4.1.5. Competitive Rivalry
- 4.2. PESTEL analysis
- 4.3. BCG Analysis
- 4.3.1. Stars (High Growth, High Market Share)
- 4.3.2. Cash Cows (Low Growth, High Market Share)
- 4.3.3. Question Mark (High Growth, Low Market Share)
- 4.3.4. Dogs (Low Growth, Low Market Share)
- 4.4. Ansoff Matrix Analysis
- 4.5. Supply Chain Analysis
- 4.6. Regulatory Landscape
- 4.7. Current Market Potential and Opportunity Assessment (TAM–SAM–SOM Framework)
- 4.8. RAX Analyst Note
- 4.1. Porters Five Forces
- 5. Market Analysis, Insights and Forecast 2021-2033
- 5.1. Market Analysis, Insights and Forecast - by Application
- 5.1.1. 0 - 1 Year Old
- 5.1.2. 1 - 2.5 Years Old
- 5.1.3. Older than 2.5 years
- 5.2. Market Analysis, Insights and Forecast - by Types
- 5.2.1. Single Strollers
- 5.2.2. Multi Strollers (2 or more)
- 5.3. Market Analysis, Insights and Forecast - by Region
- 5.3.1. North America
- 5.3.2. South America
- 5.3.3. Europe
- 5.3.4. Middle East & Africa
- 5.3.5. Asia Pacific
- 5.1. Market Analysis, Insights and Forecast - by Application
- 6. Global Strollers Analysis, Insights and Forecast, 2021-2033
- 6.1. Market Analysis, Insights and Forecast - by Application
- 6.1.1. 0 - 1 Year Old
- 6.1.2. 1 - 2.5 Years Old
- 6.1.3. Older than 2.5 years
- 6.2. Market Analysis, Insights and Forecast - by Types
- 6.2.1. Single Strollers
- 6.2.2. Multi Strollers (2 or more)
- 6.1. Market Analysis, Insights and Forecast - by Application
- 7. North America Strollers Analysis, Insights and Forecast, 2020-2032
- 7.1. Market Analysis, Insights and Forecast - by Application
- 7.1.1. 0 - 1 Year Old
- 7.1.2. 1 - 2.5 Years Old
- 7.1.3. Older than 2.5 years
- 7.2. Market Analysis, Insights and Forecast - by Types
- 7.2.1. Single Strollers
- 7.2.2. Multi Strollers (2 or more)
- 7.1. Market Analysis, Insights and Forecast - by Application
- 8. South America Strollers Analysis, Insights and Forecast, 2020-2032
- 8.1. Market Analysis, Insights and Forecast - by Application
- 8.1.1. 0 - 1 Year Old
- 8.1.2. 1 - 2.5 Years Old
- 8.1.3. Older than 2.5 years
- 8.2. Market Analysis, Insights and Forecast - by Types
- 8.2.1. Single Strollers
- 8.2.2. Multi Strollers (2 or more)
- 8.1. Market Analysis, Insights and Forecast - by Application
- 9. Europe Strollers Analysis, Insights and Forecast, 2020-2032
- 9.1. Market Analysis, Insights and Forecast - by Application
- 9.1.1. 0 - 1 Year Old
- 9.1.2. 1 - 2.5 Years Old
- 9.1.3. Older than 2.5 years
- 9.2. Market Analysis, Insights and Forecast - by Types
- 9.2.1. Single Strollers
- 9.2.2. Multi Strollers (2 or more)
- 9.1. Market Analysis, Insights and Forecast - by Application
- 10. Middle East & Africa Strollers Analysis, Insights and Forecast, 2020-2032
- 10.1. Market Analysis, Insights and Forecast - by Application
- 10.1.1. 0 - 1 Year Old
- 10.1.2. 1 - 2.5 Years Old
- 10.1.3. Older than 2.5 years
- 10.2. Market Analysis, Insights and Forecast - by Types
- 10.2.1. Single Strollers
- 10.2.2. Multi Strollers (2 or more)
- 10.1. Market Analysis, Insights and Forecast - by Application
- 11. Asia Pacific Strollers Analysis, Insights and Forecast, 2020-2032
- 11.1. Market Analysis, Insights and Forecast - by Application
- 11.1.1. 0 - 1 Year Old
- 11.1.2. 1 - 2.5 Years Old
- 11.1.3. Older than 2.5 years
- 11.2. Market Analysis, Insights and Forecast - by Types
- 11.2.1. Single Strollers
- 11.2.2. Multi Strollers (2 or more)
- 11.1. Market Analysis, Insights and Forecast - by Application
- 12. Competitive Analysis
- 12.1. Company Profiles
- 12.1.1 Goodbaby
- 12.1.1.1. Company Overview
- 12.1.1.2. Products
- 12.1.1.3. Company Financials
- 12.1.1.4. SWOT Analysis
- 12.1.2 Summer Infant
- 12.1.2.1. Company Overview
- 12.1.2.2. Products
- 12.1.2.3. Company Financials
- 12.1.2.4. SWOT Analysis
- 12.1.3 Seebay
- 12.1.3.1. Company Overview
- 12.1.3.2. Products
- 12.1.3.3. Company Financials
- 12.1.3.4. SWOT Analysis
- 12.1.4 Bugaboo
- 12.1.4.1. Company Overview
- 12.1.4.2. Products
- 12.1.4.3. Company Financials
- 12.1.4.4. SWOT Analysis
- 12.1.5 UPPABaby
- 12.1.5.1. Company Overview
- 12.1.5.2. Products
- 12.1.5.3. Company Financials
- 12.1.5.4. SWOT Analysis
- 12.1.6 Stokke
- 12.1.6.1. Company Overview
- 12.1.6.2. Products
- 12.1.6.3. Company Financials
- 12.1.6.4. SWOT Analysis
- 12.1.7 4moms
- 12.1.7.1. Company Overview
- 12.1.7.2. Products
- 12.1.7.3. Company Financials
- 12.1.7.4. SWOT Analysis
- 12.1.8 Aprica
- 12.1.8.1. Company Overview
- 12.1.8.2. Products
- 12.1.8.3. Company Financials
- 12.1.8.4. SWOT Analysis
- 12.1.9 Baby Jogger
- 12.1.9.1. Company Overview
- 12.1.9.2. Products
- 12.1.9.3. Company Financials
- 12.1.9.4. SWOT Analysis
- 12.1.10 ABC Design
- 12.1.10.1. Company Overview
- 12.1.10.2. Products
- 12.1.10.3. Company Financials
- 12.1.10.4. SWOT Analysis
- 12.1.11 Peg Perego
- 12.1.11.1. Company Overview
- 12.1.11.2. Products
- 12.1.11.3. Company Financials
- 12.1.11.4. SWOT Analysis
- 12.1.12 Shenma Group
- 12.1.12.1. Company Overview
- 12.1.12.2. Products
- 12.1.12.3. Company Financials
- 12.1.12.4. SWOT Analysis
- 12.1.13 Combi
- 12.1.13.1. Company Overview
- 12.1.13.2. Products
- 12.1.13.3. Company Financials
- 12.1.13.4. SWOT Analysis
- 12.1.14 Britax
- 12.1.14.1. Company Overview
- 12.1.14.2. Products
- 12.1.14.3. Company Financials
- 12.1.14.4. SWOT Analysis
- 12.1.15 Quinny
- 12.1.15.1. Company Overview
- 12.1.15.2. Products
- 12.1.15.3. Company Financials
- 12.1.15.4. SWOT Analysis
- 12.1.16 Valco Baby
- 12.1.16.1. Company Overview
- 12.1.16.2. Products
- 12.1.16.3. Company Financials
- 12.1.16.4. SWOT Analysis
- 12.1.17 Phil & Teds
- 12.1.17.1. Company Overview
- 12.1.17.2. Products
- 12.1.17.3. Company Financials
- 12.1.17.4. SWOT Analysis
- 12.1.18 Zooper
- 12.1.18.1. Company Overview
- 12.1.18.2. Products
- 12.1.18.3. Company Financials
- 12.1.18.4. SWOT Analysis
- 12.1.19 Thule
- 12.1.19.1. Company Overview
- 12.1.19.2. Products
- 12.1.19.3. Company Financials
- 12.1.19.4. SWOT Analysis
- 12.1.20 Emmaljunga
- 12.1.20.1. Company Overview
- 12.1.20.2. Products
- 12.1.20.3. Company Financials
- 12.1.20.4. SWOT Analysis
- 12.1.21 Bumbleride
- 12.1.21.1. Company Overview
- 12.1.21.2. Products
- 12.1.21.3. Company Financials
- 12.1.21.4. SWOT Analysis
- 12.1.1 Goodbaby
- 12.2. Market Entropy
- 12.2.1 Company's Key Areas Served
- 12.2.2 Recent Developments
- 12.3. Company Market Share Analysis 2025
- 12.3.1 Top 5 Companies Market Share Analysis
- 12.3.2 Top 3 Companies Market Share Analysis
- 12.4. List of Potential Customers
- 13. Research Methodology
List of Figures
- Figure 1: Global Strollers Revenue Breakdown (undefined, %) by Region 2025 & 2033
- Figure 2: Global Strollers Volume Breakdown (K, %) by Region 2025 & 2033
- Figure 3: North America Strollers Revenue (undefined), by Application 2025 & 2033
- Figure 4: North America Strollers Volume (K), by Application 2025 & 2033
- Figure 5: North America Strollers Revenue Share (%), by Application 2025 & 2033
- Figure 6: North America Strollers Volume Share (%), by Application 2025 & 2033
- Figure 7: North America Strollers Revenue (undefined), by Types 2025 & 2033
- Figure 8: North America Strollers Volume (K), by Types 2025 & 2033
- Figure 9: North America Strollers Revenue Share (%), by Types 2025 & 2033
- Figure 10: North America Strollers Volume Share (%), by Types 2025 & 2033
- Figure 11: North America Strollers Revenue (undefined), by Country 2025 & 2033
- Figure 12: North America Strollers Volume (K), by Country 2025 & 2033
- Figure 13: North America Strollers Revenue Share (%), by Country 2025 & 2033
- Figure 14: North America Strollers Volume Share (%), by Country 2025 & 2033
- Figure 15: South America Strollers Revenue (undefined), by Application 2025 & 2033
- Figure 16: South America Strollers Volume (K), by Application 2025 & 2033
- Figure 17: South America Strollers Revenue Share (%), by Application 2025 & 2033
- Figure 18: South America Strollers Volume Share (%), by Application 2025 & 2033
- Figure 19: South America Strollers Revenue (undefined), by Types 2025 & 2033
- Figure 20: South America Strollers Volume (K), by Types 2025 & 2033
- Figure 21: South America Strollers Revenue Share (%), by Types 2025 & 2033
- Figure 22: South America Strollers Volume Share (%), by Types 2025 & 2033
- Figure 23: South America Strollers Revenue (undefined), by Country 2025 & 2033
- Figure 24: South America Strollers Volume (K), by Country 2025 & 2033
- Figure 25: South America Strollers Revenue Share (%), by Country 2025 & 2033
- Figure 26: South America Strollers Volume Share (%), by Country 2025 & 2033
- Figure 27: Europe Strollers Revenue (undefined), by Application 2025 & 2033
- Figure 28: Europe Strollers Volume (K), by Application 2025 & 2033
- Figure 29: Europe Strollers Revenue Share (%), by Application 2025 & 2033
- Figure 30: Europe Strollers Volume Share (%), by Application 2025 & 2033
- Figure 31: Europe Strollers Revenue (undefined), by Types 2025 & 2033
- Figure 32: Europe Strollers Volume (K), by Types 2025 & 2033
- Figure 33: Europe Strollers Revenue Share (%), by Types 2025 & 2033
- Figure 34: Europe Strollers Volume Share (%), by Types 2025 & 2033
- Figure 35: Europe Strollers Revenue (undefined), by Country 2025 & 2033
- Figure 36: Europe Strollers Volume (K), by Country 2025 & 2033
- Figure 37: Europe Strollers Revenue Share (%), by Country 2025 & 2033
- Figure 38: Europe Strollers Volume Share (%), by Country 2025 & 2033
- Figure 39: Middle East & Africa Strollers Revenue (undefined), by Application 2025 & 2033
- Figure 40: Middle East & Africa Strollers Volume (K), by Application 2025 & 2033
- Figure 41: Middle East & Africa Strollers Revenue Share (%), by Application 2025 & 2033
- Figure 42: Middle East & Africa Strollers Volume Share (%), by Application 2025 & 2033
- Figure 43: Middle East & Africa Strollers Revenue (undefined), by Types 2025 & 2033
- Figure 44: Middle East & Africa Strollers Volume (K), by Types 2025 & 2033
- Figure 45: Middle East & Africa Strollers Revenue Share (%), by Types 2025 & 2033
- Figure 46: Middle East & Africa Strollers Volume Share (%), by Types 2025 & 2033
- Figure 47: Middle East & Africa Strollers Revenue (undefined), by Country 2025 & 2033
- Figure 48: Middle East & Africa Strollers Volume (K), by Country 2025 & 2033
- Figure 49: Middle East & Africa Strollers Revenue Share (%), by Country 2025 & 2033
- Figure 50: Middle East & Africa Strollers Volume Share (%), by Country 2025 & 2033
- Figure 51: Asia Pacific Strollers Revenue (undefined), by Application 2025 & 2033
- Figure 52: Asia Pacific Strollers Volume (K), by Application 2025 & 2033
- Figure 53: Asia Pacific Strollers Revenue Share (%), by Application 2025 & 2033
- Figure 54: Asia Pacific Strollers Volume Share (%), by Application 2025 & 2033
- Figure 55: Asia Pacific Strollers Revenue (undefined), by Types 2025 & 2033
- Figure 56: Asia Pacific Strollers Volume (K), by Types 2025 & 2033
- Figure 57: Asia Pacific Strollers Revenue Share (%), by Types 2025 & 2033
- Figure 58: Asia Pacific Strollers Volume Share (%), by Types 2025 & 2033
- Figure 59: Asia Pacific Strollers Revenue (undefined), by Country 2025 & 2033
- Figure 60: Asia Pacific Strollers Volume (K), by Country 2025 & 2033
- Figure 61: Asia Pacific Strollers Revenue Share (%), by Country 2025 & 2033
- Figure 62: Asia Pacific Strollers Volume Share (%), by Country 2025 & 2033
List of Tables
- Table 1: Global Strollers Revenue undefined Forecast, by Application 2020 & 2033
- Table 2: Global Strollers Volume K Forecast, by Application 2020 & 2033
- Table 3: Global Strollers Revenue undefined Forecast, by Types 2020 & 2033
- Table 4: Global Strollers Volume K Forecast, by Types 2020 & 2033
- Table 5: Global Strollers Revenue undefined Forecast, by Region 2020 & 2033
- Table 6: Global Strollers Volume K Forecast, by Region 2020 & 2033
- Table 7: Global Strollers Revenue undefined Forecast, by Application 2020 & 2033
- Table 8: Global Strollers Volume K Forecast, by Application 2020 & 2033
- Table 9: Global Strollers Revenue undefined Forecast, by Types 2020 & 2033
- Table 10: Global Strollers Volume K Forecast, by Types 2020 & 2033
- Table 11: Global Strollers Revenue undefined Forecast, by Country 2020 & 2033
- Table 12: Global Strollers Volume K Forecast, by Country 2020 & 2033
- Table 13: United States Strollers Revenue (undefined) Forecast, by Application 2020 & 2033
- Table 14: United States Strollers Volume (K) Forecast, by Application 2020 & 2033
- Table 15: Canada Strollers Revenue (undefined) Forecast, by Application 2020 & 2033
- Table 16: Canada Strollers Volume (K) Forecast, by Application 2020 & 2033
- Table 17: Mexico Strollers Revenue (undefined) Forecast, by Application 2020 & 2033
- Table 18: Mexico Strollers Volume (K) Forecast, by Application 2020 & 2033
- Table 19: Global Strollers Revenue undefined Forecast, by Application 2020 & 2033
- Table 20: Global Strollers Volume K Forecast, by Application 2020 & 2033
- Table 21: Global Strollers Revenue undefined Forecast, by Types 2020 & 2033
- Table 22: Global Strollers Volume K Forecast, by Types 2020 & 2033
- Table 23: Global Strollers Revenue undefined Forecast, by Country 2020 & 2033
- Table 24: Global Strollers Volume K Forecast, by Country 2020 & 2033
- Table 25: Brazil Strollers Revenue (undefined) Forecast, by Application 2020 & 2033
- Table 26: Brazil Strollers Volume (K) Forecast, by Application 2020 & 2033
- Table 27: Argentina Strollers Revenue (undefined) Forecast, by Application 2020 & 2033
- Table 28: Argentina Strollers Volume (K) Forecast, by Application 2020 & 2033
- Table 29: Rest of South America Strollers Revenue (undefined) Forecast, by Application 2020 & 2033
- Table 30: Rest of South America Strollers Volume (K) Forecast, by Application 2020 & 2033
- Table 31: Global Strollers Revenue undefined Forecast, by Application 2020 & 2033
- Table 32: Global Strollers Volume K Forecast, by Application 2020 & 2033
- Table 33: Global Strollers Revenue undefined Forecast, by Types 2020 & 2033
- Table 34: Global Strollers Volume K Forecast, by Types 2020 & 2033
- Table 35: Global Strollers Revenue undefined Forecast, by Country 2020 & 2033
- Table 36: Global Strollers Volume K Forecast, by Country 2020 & 2033
- Table 37: United Kingdom Strollers Revenue (undefined) Forecast, by Application 2020 & 2033
- Table 38: United Kingdom Strollers Volume (K) Forecast, by Application 2020 & 2033
- Table 39: Germany Strollers Revenue (undefined) Forecast, by Application 2020 & 2033
- Table 40: Germany Strollers Volume (K) Forecast, by Application 2020 & 2033
- Table 41: France Strollers Revenue (undefined) Forecast, by Application 2020 & 2033
- Table 42: France Strollers Volume (K) Forecast, by Application 2020 & 2033
- Table 43: Italy Strollers Revenue (undefined) Forecast, by Application 2020 & 2033
- Table 44: Italy Strollers Volume (K) Forecast, by Application 2020 & 2033
- Table 45: Spain Strollers Revenue (undefined) Forecast, by Application 2020 & 2033
- Table 46: Spain Strollers Volume (K) Forecast, by Application 2020 & 2033
- Table 47: Russia Strollers Revenue (undefined) Forecast, by Application 2020 & 2033
- Table 48: Russia Strollers Volume (K) Forecast, by Application 2020 & 2033
- Table 49: Benelux Strollers Revenue (undefined) Forecast, by Application 2020 & 2033
- Table 50: Benelux Strollers Volume (K) Forecast, by Application 2020 & 2033
- Table 51: Nordics Strollers Revenue (undefined) Forecast, by Application 2020 & 2033
- Table 52: Nordics Strollers Volume (K) Forecast, by Application 2020 & 2033
- Table 53: Rest of Europe Strollers Revenue (undefined) Forecast, by Application 2020 & 2033
- Table 54: Rest of Europe Strollers Volume (K) Forecast, by Application 2020 & 2033
- Table 55: Global Strollers Revenue undefined Forecast, by Application 2020 & 2033
- Table 56: Global Strollers Volume K Forecast, by Application 2020 & 2033
- Table 57: Global Strollers Revenue undefined Forecast, by Types 2020 & 2033
- Table 58: Global Strollers Volume K Forecast, by Types 2020 & 2033
- Table 59: Global Strollers Revenue undefined Forecast, by Country 2020 & 2033
- Table 60: Global Strollers Volume K Forecast, by Country 2020 & 2033
- Table 61: Turkey Strollers Revenue (undefined) Forecast, by Application 2020 & 2033
- Table 62: Turkey Strollers Volume (K) Forecast, by Application 2020 & 2033
- Table 63: Israel Strollers Revenue (undefined) Forecast, by Application 2020 & 2033
- Table 64: Israel Strollers Volume (K) Forecast, by Application 2020 & 2033
- Table 65: GCC Strollers Revenue (undefined) Forecast, by Application 2020 & 2033
- Table 66: GCC Strollers Volume (K) Forecast, by Application 2020 & 2033
- Table 67: North Africa Strollers Revenue (undefined) Forecast, by Application 2020 & 2033
- Table 68: North Africa Strollers Volume (K) Forecast, by Application 2020 & 2033
- Table 69: South Africa Strollers Revenue (undefined) Forecast, by Application 2020 & 2033
- Table 70: South Africa Strollers Volume (K) Forecast, by Application 2020 & 2033
- Table 71: Rest of Middle East & Africa Strollers Revenue (undefined) Forecast, by Application 2020 & 2033
- Table 72: Rest of Middle East & Africa Strollers Volume (K) Forecast, by Application 2020 & 2033
- Table 73: Global Strollers Revenue undefined Forecast, by Application 2020 & 2033
- Table 74: Global Strollers Volume K Forecast, by Application 2020 & 2033
- Table 75: Global Strollers Revenue undefined Forecast, by Types 2020 & 2033
- Table 76: Global Strollers Volume K Forecast, by Types 2020 & 2033
- Table 77: Global Strollers Revenue undefined Forecast, by Country 2020 & 2033
- Table 78: Global Strollers Volume K Forecast, by Country 2020 & 2033
- Table 79: China Strollers Revenue (undefined) Forecast, by Application 2020 & 2033
- Table 80: China Strollers Volume (K) Forecast, by Application 2020 & 2033
- Table 81: India Strollers Revenue (undefined) Forecast, by Application 2020 & 2033
- Table 82: India Strollers Volume (K) Forecast, by Application 2020 & 2033
- Table 83: Japan Strollers Revenue (undefined) Forecast, by Application 2020 & 2033
- Table 84: Japan Strollers Volume (K) Forecast, by Application 2020 & 2033
- Table 85: South Korea Strollers Revenue (undefined) Forecast, by Application 2020 & 2033
- Table 86: South Korea Strollers Volume (K) Forecast, by Application 2020 & 2033
- Table 87: ASEAN Strollers Revenue (undefined) Forecast, by Application 2020 & 2033
- Table 88: ASEAN Strollers Volume (K) Forecast, by Application 2020 & 2033
- Table 89: Oceania Strollers Revenue (undefined) Forecast, by Application 2020 & 2033
- Table 90: Oceania Strollers Volume (K) Forecast, by Application 2020 & 2033
- Table 91: Rest of Asia Pacific Strollers Revenue (undefined) Forecast, by Application 2020 & 2033
- Table 92: Rest of Asia Pacific Strollers Volume (K) Forecast, by Application 2020 & 2033
Frequently Asked Questions
1. What is the projected Compound Annual Growth Rate (CAGR) of the Strollers?
The projected CAGR is approximately 5.82%.
2. Which companies are prominent players in the Strollers?
Key companies in the market include Goodbaby, Summer Infant, Seebay, Bugaboo, UPPABaby, Stokke, 4moms, Aprica, Baby Jogger, ABC Design, Peg Perego, Shenma Group, Combi, Britax, Quinny, Valco Baby, Phil & Teds, Zooper, Thule, Emmaljunga, Bumbleride.
3. What are the main segments of the Strollers?
The market segments include Application, Types.
4. Can you provide details about the market size?
The market size is estimated to be USD XXX N/A as of 2022.
5. What are some drivers contributing to market growth?
N/A
6. What are the notable trends driving market growth?
N/A
7. Are there any restraints impacting market growth?
N/A
8. Can you provide examples of recent developments in the market?
N/A
9. What pricing options are available for accessing the report?
Pricing options include single-user, multi-user, and enterprise licenses priced at USD 3350.00, USD 5025.00, and USD 6700.00 respectively.
10. Is the market size provided in terms of value or volume?
The market size is provided in terms of value, measured in N/A and volume, measured in K.
11. Are there any specific market keywords associated with the report?
Yes, the market keyword associated with the report is "Strollers," which aids in identifying and referencing the specific market segment covered.
12. How do I determine which pricing option suits my needs best?
The pricing options vary based on user requirements and access needs. Individual users may opt for single-user licenses, while businesses requiring broader access may choose multi-user or enterprise licenses for cost-effective access to the report.
13. Are there any additional resources or data provided in the Strollers report?
While the report offers comprehensive insights, it's advisable to review the specific contents or supplementary materials provided to ascertain if additional resources or data are available.
14. How can I stay updated on further developments or reports in the Strollers?
To stay informed about further developments, trends, and reports in the Strollers, consider subscribing to industry newsletters, following relevant companies and organizations, or regularly checking reputable industry news sources and publications.
Methodology
Step 1 - Identification of Relevant Samples Size from Population Database


Step 2 - Approaches for Defining Global Market Size (Value, Volume* & Price*)

Note*: In applicable scenarios
Step 3 - Data Sources
Primary Research
- Web Analytics
- Survey Reports
- Research Institute
- Latest Research Reports
- Opinion Leaders
Secondary Research
- Annual Reports
- White Paper
- Latest Press Release
- Industry Association
- Paid Database
- Investor Presentations

Step 4 - Data Triangulation
Involves using different sources of information in order to increase the validity of a study
These sources are likely to be stakeholders in a program - participants, other researchers, program staff, other community members, and so on.
Then we put all data in single framework & apply various statistical tools to find out the dynamic on the market.
During the analysis stage, feedback from the stakeholder groups would be compared to determine areas of agreement as well as areas of divergence