

Key Insights
The global Surface Vision & Inspection Equipment market is poised for significant expansion, driven by increasing industrial automation and the imperative for stringent quality control. Key growth catalysts include the escalating adoption of advanced vision systems across automotive, electronics, and pharmaceutical sectors. The integration of sophisticated AI and machine learning algorithms, coupled with the demand for enhanced production efficiency, are propelling market dynamism. The market is segmented by component and application, with automotive and electronics leading current adoption. Emerging opportunities are evident in the food & beverage and medical device industries. A competitive landscape characterized by innovation from established and new entrants, focusing on higher resolution, faster processing, and advanced analytics, is fostering market accessibility.
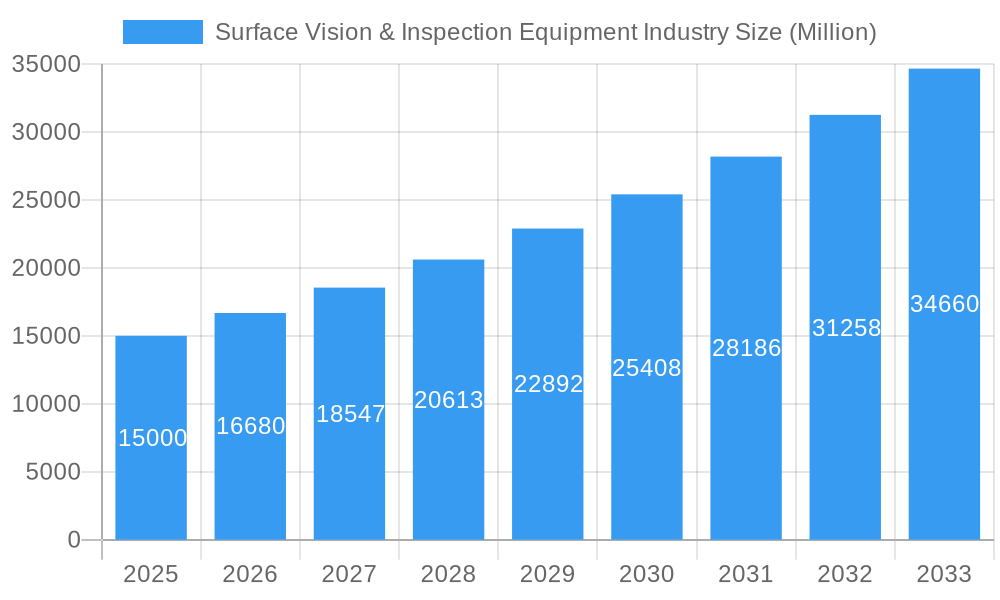
Surface Vision & Inspection Equipment Industry Market Size (In Billion)
The market is projected to witness a Compound Annual Growth Rate (CAGR) of 14.56%. By the base year 2025, the market size is anticipated to reach $14.86 billion. North America and Asia Pacific, with their strong manufacturing bases and technological leadership, are expected to hold substantial market shares, supported by Europe's established industrial infrastructure. While initial investment costs and the requirement for skilled personnel present challenges, ongoing technological advancements and decreasing costs are anticipated to overcome these restraints, ensuring sustained market growth through the forecast period ending in 2033. The continued integration of ML and AI will be instrumental in future market expansion.
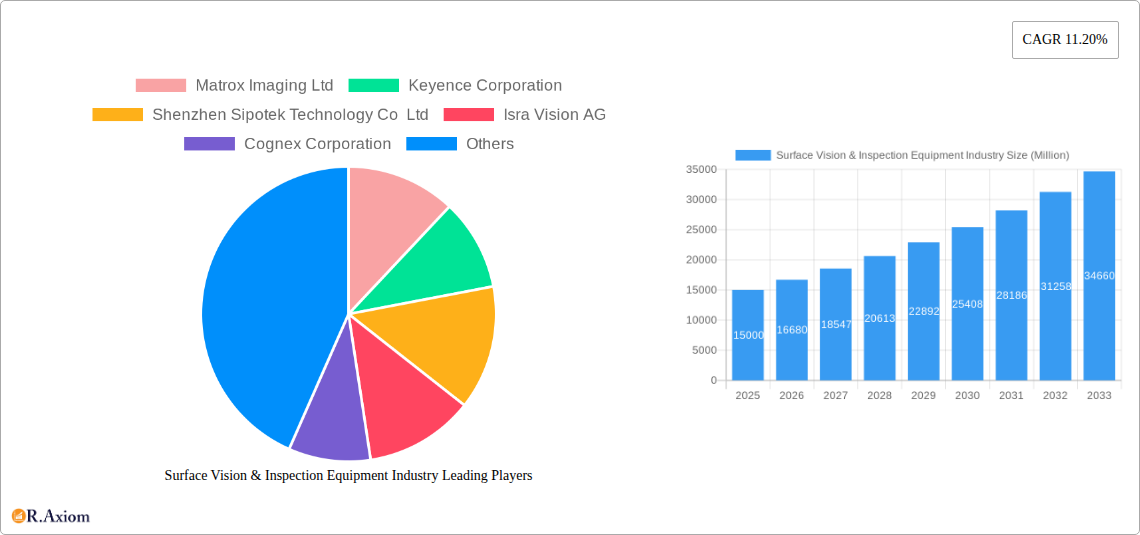
Surface Vision & Inspection Equipment Industry Company Market Share
Surface Vision & Inspection Equipment Industry: A Comprehensive Market Report (2019-2033)
This comprehensive report provides an in-depth analysis of the global Surface Vision & Inspection Equipment industry, offering invaluable insights for stakeholders seeking to understand market dynamics, competitive landscapes, and future growth potential. The report covers the period from 2019 to 2033, with a focus on the estimated year 2025 and a forecast period spanning 2025-2033. The study utilizes a robust methodology, incorporating historical data from 2019-2024 to build accurate projections.
Surface Vision & Inspection Equipment Industry Market Concentration & Innovation
The Surface Vision & Inspection Equipment market exhibits a moderately concentrated structure, with several major players commanding significant market share. Keyence Corporation, Cognex Corporation, and Matrox Imaging Ltd. are among the leading companies, each holding a substantial portion of the overall market share. However, the presence of numerous smaller, specialized companies indicates a dynamic competitive landscape. Estimates suggest that the top 5 players collectively hold approximately xx% of the global market share in 2025, indicating room for growth among smaller players.
Innovation in this sector is driven by several factors, including advancements in artificial intelligence (AI), machine learning (ML), and computer vision technologies. These advancements are leading to the development of more sophisticated inspection systems with higher accuracy and speed. The regulatory landscape, particularly concerning product safety and quality standards in various industries, is a key driver, pushing companies to adopt advanced inspection technologies. Furthermore, the rise of automation across manufacturing sectors fuels market growth.
Mergers and acquisitions (M&A) activity within the industry has been moderate but strategically significant. Several key acquisitions have focused on expanding technological capabilities and market reach. While specific M&A deal values are confidential, the overall trend suggests a growing consolidation within the higher-end segments of the market. Recent deals have focused on enhancing AI capabilities and geographic reach, highlighting these areas as central to growth strategy.
- Market Concentration: Top 5 players hold approximately xx% market share (2025 estimate).
- Innovation Drivers: AI, ML, computer vision, automation, regulatory compliance.
- M&A Activity: Moderate, with deals focused on technological expansion and market reach.
- Substitutes: Limited, due to specialized nature of equipment and software.
Surface Vision & Inspection Equipment Industry Industry Trends & Insights
The Surface Vision & Inspection Equipment market is experiencing robust growth, driven by increasing demand from various end-use industries. The compounded annual growth rate (CAGR) is projected to be xx% during the forecast period (2025-2033). This growth is fueled by several key factors including the rising adoption of automation and Industry 4.0 technologies across manufacturing processes. The demand for higher quality and consistency in products further strengthens the need for efficient and accurate surface inspection systems.
Technological disruptions, such as the integration of AI and machine learning, are revolutionizing the capabilities of surface vision systems. This trend has resulted in the development of more intelligent inspection systems, capable of identifying defects with greater precision and efficiency. Consumers in diverse industries now prioritize higher levels of precision and speed in their manufacturing processes, driving demand for more advanced technology.
Competitive dynamics are characterized by a mix of established players and emerging companies. Existing players are focusing on innovation and expanding their product portfolio to maintain a competitive edge, while smaller players focus on niche applications and cutting-edge technology. Market penetration is rising steadily, driven by increased automation within various industries. The market penetration rate is estimated to be xx% in 2025, with substantial further growth anticipated during the forecast period.
Dominant Markets & Segments in Surface Vision & Inspection Equipment Industry
The automotive industry represents a significant segment within the Surface Vision & Inspection Equipment market, followed by the electrical and electronics industry. These sectors are driving substantial demand due to rigorous quality control requirements and stringent standards. The Asia-Pacific region is currently the dominant market, experiencing higher growth rates than other regions due to rapid industrialization and extensive manufacturing activities. China and other Southeast Asian nations are key contributors to this regional dominance.
By Component:
- Camera: High demand due to advancements in resolution and image processing.
- Lighting Equipment: LED lighting is gaining popularity for its energy efficiency and superior illumination.
- Optics: High-quality lenses and imaging sensors are critical for precision inspection.
- Other Components: Software, control systems, and other accessories contribute to the market size.
By Application:
- Automotive: Stringent quality standards drive high adoption.
- Electrical & Electronics: Growing demand for precise component inspection.
- Medical & Pharmaceuticals: Critical for maintaining sterility and product quality.
- Food & Beverages: Ensuring product safety and quality control.
- Postal & Logistics: Automated sorting and inspection are growing rapidly.
Key Drivers:
- Automotive: Stringent quality control requirements and increasing automation.
- Electrical & Electronics: Miniaturization and increasing complexity of electronic components.
- Asia-Pacific: Rapid industrialization, rising manufacturing, and government initiatives.
Surface Vision & Inspection Equipment Industry Product Developments
Recent product innovations focus on enhancing speed, accuracy, and ease of use. AI-powered systems, capable of real-time defect detection and classification, are gaining significant traction. The integration of 3D imaging technologies allows for more comprehensive inspection capabilities. These advancements are significantly improving productivity and reducing human error, making these solutions attractive across diverse industries. This focus on enhanced efficiency and precision is key to capturing market share.
Report Scope & Segmentation Analysis
This report comprehensively analyzes the Surface Vision & Inspection Equipment market across various segments. The By Component segment includes cameras, lighting equipment, optics, and other components, each detailed with projected growth, market size, and competitive analysis. Similarly, the By Application segment delves into the automotive, electrical & electronics, medical & pharmaceuticals, food & beverages, postal & logistics, and other application sectors. Each segment's market size, growth trajectory, and competitive intensity are specifically analyzed. Growth projections are based on various factors, including technological advancements, economic conditions, and industry-specific trends.
Key Drivers of Surface Vision & Inspection Equipment Industry Growth
Technological advancements, particularly in AI, computer vision, and machine learning, are primary drivers. Increased automation across industries necessitates more efficient inspection processes. Stringent quality control standards in diverse sectors, such as automotive and pharmaceuticals, necessitate advanced inspection solutions. Government regulations related to product safety and quality are also fueling demand.
Challenges in the Surface Vision & Inspection Equipment Industry Sector
High initial investment costs can be a barrier for smaller companies. Supply chain disruptions, particularly regarding specialized components, can impact production and delivery timelines. Intense competition from established and emerging players creates pressure on pricing and innovation. These factors have an impact estimated to be in the range of xx Million annually (2025).
Emerging Opportunities in Surface Vision & Inspection Equipment Industry
The integration of advanced analytics and cloud computing for data analysis offers significant opportunities. The growing demand for quality control in emerging markets presents substantial growth potential. Expansion into niche applications, such as food safety and environmental monitoring, also provides lucrative avenues for growth.
Leading Players in the Surface Vision & Inspection Equipment Industry Market
- Matrox Imaging Ltd
- Keyence Corporation
- Shenzhen Sipotek Technology Co Ltd
- Isra Vision AG
- Cognex Corporation
- Stemmer Imaging AG
- AMETEK Surface Vision
- Omron Corporation
- Comvis AG
- Daitron Inc
- Flexfilm Ltd
- Edmund Scientific Corporation
- Panasonic Corporation
Key Developments in Surface Vision & Inspection Equipment Industry Industry
- 2023 Q4: Cognex Corporation launched a new 3D vision system with enhanced AI capabilities.
- 2022 Q3: Keyence Corporation acquired a smaller company specializing in high-resolution imaging technology.
- 2021 Q2: Matrox Imaging Ltd. released a new software platform for advanced image analysis.
- (Further updates to be added based on available data)
Strategic Outlook for Surface Vision & Inspection Equipment Industry Market
The future of the Surface Vision & Inspection Equipment market is bright, driven by continuous technological innovation and the growing need for automation across various industries. The increasing adoption of AI, machine learning, and 3D imaging technologies will further enhance the capabilities of inspection systems, creating substantial growth opportunities. The expansion into emerging markets and new applications will also fuel future growth. The market is poised for continued expansion, with strong potential for growth exceeding xx Million annually by 2033.
Surface Vision & Inspection Equipment Industry Segmentation
-
1. Component
- 1.1. Camera
- 1.2. Lighting Equipment
- 1.3. Optics
- 1.4. Other Components
-
2. Application
- 2.1. Automotive
- 2.2. Electrical & Electronics
- 2.3. Medical & Pharmaceuticals
- 2.4. Food & Beverages
- 2.5. Postal & Logistics
- 2.6. Other Applications
Surface Vision & Inspection Equipment Industry Segmentation By Geography
- 1. North America
- 2. Europe
- 3. Asia Pacific
- 4. Rest of the World
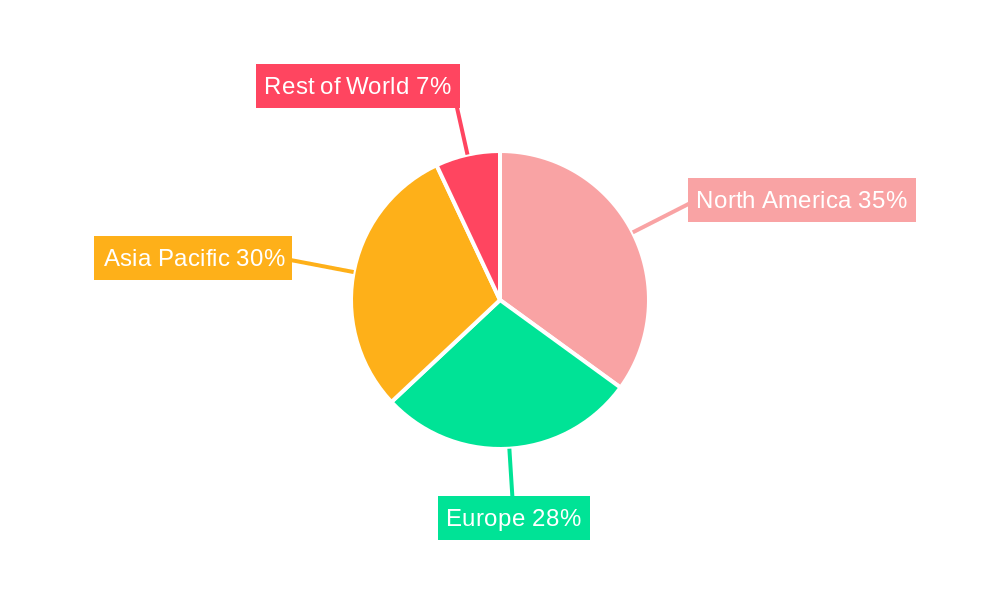
Surface Vision & Inspection Equipment Industry Regional Market Share
Geographic Coverage of Surface Vision & Inspection Equipment Industry
Surface Vision & Inspection Equipment Industry REPORT HIGHLIGHTS
| Aspects | Details |
|---|---|
| Study Period | 2020-2034 |
| Base Year | 2025 |
| Estimated Year | 2026 |
| Forecast Period | 2026-2034 |
| Historical Period | 2020-2025 |
| Growth Rate | CAGR of 14.56% from 2020-2034 |
| Segmentation |
|
Table of Contents
- 1. Introduction
- 1.1. Research Scope
- 1.2. Market Segmentation
- 1.3. Research Objective
- 1.4. Definitions and Assumptions
- 2. Executive Summary
- 2.1. Market Snapshot
- 3. Market Dynamics
- 3.1. Market Drivers
- 3.2. Market Restrains
- 3.3. Market Trends
- 3.4. Market Opportunities
- 4. Market Factor Analysis
- 4.1. Porters Five Forces
- 4.1.1. Bargaining Power of Suppliers
- 4.1.2. Bargaining Power of Buyers
- 4.1.3. Threat of New Entrants
- 4.1.4. Threat of Substitutes
- 4.1.5. Competitive Rivalry
- 4.2. PESTEL analysis
- 4.3. BCG Analysis
- 4.3.1. Stars (High Growth, High Market Share)
- 4.3.2. Cash Cows (Low Growth, High Market Share)
- 4.3.3. Question Mark (High Growth, Low Market Share)
- 4.3.4. Dogs (Low Growth, Low Market Share)
- 4.4. Ansoff Matrix Analysis
- 4.5. Supply Chain Analysis
- 4.6. Regulatory Landscape
- 4.7. Current Market Potential and Opportunity Assessment (TAM–SAM–SOM Framework)
- 4.8. RAX Analyst Note
- 4.1. Porters Five Forces
- 5. Market Analysis, Insights and Forecast 2021-2033
- 5.1. Market Analysis, Insights and Forecast - by Component
- 5.1.1. Camera
- 5.1.2. Lighting Equipment
- 5.1.3. Optics
- 5.1.4. Other Components
- 5.2. Market Analysis, Insights and Forecast - by Application
- 5.2.1. Automotive
- 5.2.2. Electrical & Electronics
- 5.2.3. Medical & Pharmaceuticals
- 5.2.4. Food & Beverages
- 5.2.5. Postal & Logistics
- 5.2.6. Other Applications
- 5.3. Market Analysis, Insights and Forecast - by Region
- 5.3.1. North America
- 5.3.2. Europe
- 5.3.3. Asia Pacific
- 5.3.4. Rest of the World
- 5.1. Market Analysis, Insights and Forecast - by Component
- 6. Global Surface Vision & Inspection Equipment Industry Analysis, Insights and Forecast, 2021-2033
- 6.1. Market Analysis, Insights and Forecast - by Component
- 6.1.1. Camera
- 6.1.2. Lighting Equipment
- 6.1.3. Optics
- 6.1.4. Other Components
- 6.2. Market Analysis, Insights and Forecast - by Application
- 6.2.1. Automotive
- 6.2.2. Electrical & Electronics
- 6.2.3. Medical & Pharmaceuticals
- 6.2.4. Food & Beverages
- 6.2.5. Postal & Logistics
- 6.2.6. Other Applications
- 6.1. Market Analysis, Insights and Forecast - by Component
- 7. North America Surface Vision & Inspection Equipment Industry Analysis, Insights and Forecast, 2020-2032
- 7.1. Market Analysis, Insights and Forecast - by Component
- 7.1.1. Camera
- 7.1.2. Lighting Equipment
- 7.1.3. Optics
- 7.1.4. Other Components
- 7.2. Market Analysis, Insights and Forecast - by Application
- 7.2.1. Automotive
- 7.2.2. Electrical & Electronics
- 7.2.3. Medical & Pharmaceuticals
- 7.2.4. Food & Beverages
- 7.2.5. Postal & Logistics
- 7.2.6. Other Applications
- 7.1. Market Analysis, Insights and Forecast - by Component
- 8. Europe Surface Vision & Inspection Equipment Industry Analysis, Insights and Forecast, 2020-2032
- 8.1. Market Analysis, Insights and Forecast - by Component
- 8.1.1. Camera
- 8.1.2. Lighting Equipment
- 8.1.3. Optics
- 8.1.4. Other Components
- 8.2. Market Analysis, Insights and Forecast - by Application
- 8.2.1. Automotive
- 8.2.2. Electrical & Electronics
- 8.2.3. Medical & Pharmaceuticals
- 8.2.4. Food & Beverages
- 8.2.5. Postal & Logistics
- 8.2.6. Other Applications
- 8.1. Market Analysis, Insights and Forecast - by Component
- 9. Asia Pacific Surface Vision & Inspection Equipment Industry Analysis, Insights and Forecast, 2020-2032
- 9.1. Market Analysis, Insights and Forecast - by Component
- 9.1.1. Camera
- 9.1.2. Lighting Equipment
- 9.1.3. Optics
- 9.1.4. Other Components
- 9.2. Market Analysis, Insights and Forecast - by Application
- 9.2.1. Automotive
- 9.2.2. Electrical & Electronics
- 9.2.3. Medical & Pharmaceuticals
- 9.2.4. Food & Beverages
- 9.2.5. Postal & Logistics
- 9.2.6. Other Applications
- 9.1. Market Analysis, Insights and Forecast - by Component
- 10. Rest of the World Surface Vision & Inspection Equipment Industry Analysis, Insights and Forecast, 2020-2032
- 10.1. Market Analysis, Insights and Forecast - by Component
- 10.1.1. Camera
- 10.1.2. Lighting Equipment
- 10.1.3. Optics
- 10.1.4. Other Components
- 10.2. Market Analysis, Insights and Forecast - by Application
- 10.2.1. Automotive
- 10.2.2. Electrical & Electronics
- 10.2.3. Medical & Pharmaceuticals
- 10.2.4. Food & Beverages
- 10.2.5. Postal & Logistics
- 10.2.6. Other Applications
- 10.1. Market Analysis, Insights and Forecast - by Component
- 11. Competitive Analysis
- 11.1. Company Profiles
- 11.1.1 Matrox Imaging Ltd
- 11.1.1.1. Company Overview
- 11.1.1.2. Products
- 11.1.1.3. Company Financials
- 11.1.1.4. SWOT Analysis
- 11.1.2 Keyence Corporation
- 11.1.2.1. Company Overview
- 11.1.2.2. Products
- 11.1.2.3. Company Financials
- 11.1.2.4. SWOT Analysis
- 11.1.3 Shenzhen Sipotek Technology Co Ltd
- 11.1.3.1. Company Overview
- 11.1.3.2. Products
- 11.1.3.3. Company Financials
- 11.1.3.4. SWOT Analysis
- 11.1.4 Isra Vision AG
- 11.1.4.1. Company Overview
- 11.1.4.2. Products
- 11.1.4.3. Company Financials
- 11.1.4.4. SWOT Analysis
- 11.1.5 Cognex Corporation
- 11.1.5.1. Company Overview
- 11.1.5.2. Products
- 11.1.5.3. Company Financials
- 11.1.5.4. SWOT Analysis
- 11.1.6 Stemmer Imaging AG
- 11.1.6.1. Company Overview
- 11.1.6.2. Products
- 11.1.6.3. Company Financials
- 11.1.6.4. SWOT Analysis
- 11.1.7 AMETEK Surface Vision
- 11.1.7.1. Company Overview
- 11.1.7.2. Products
- 11.1.7.3. Company Financials
- 11.1.7.4. SWOT Analysis
- 11.1.8 Omron Corporation
- 11.1.8.1. Company Overview
- 11.1.8.2. Products
- 11.1.8.3. Company Financials
- 11.1.8.4. SWOT Analysis
- 11.1.9 Comvis AG*List Not Exhaustive
- 11.1.9.1. Company Overview
- 11.1.9.2. Products
- 11.1.9.3. Company Financials
- 11.1.9.4. SWOT Analysis
- 11.1.10 Daitron Inc
- 11.1.10.1. Company Overview
- 11.1.10.2. Products
- 11.1.10.3. Company Financials
- 11.1.10.4. SWOT Analysis
- 11.1.11 Flexfilm Ltd
- 11.1.11.1. Company Overview
- 11.1.11.2. Products
- 11.1.11.3. Company Financials
- 11.1.11.4. SWOT Analysis
- 11.1.12 Edmund Scientific Corporation
- 11.1.12.1. Company Overview
- 11.1.12.2. Products
- 11.1.12.3. Company Financials
- 11.1.12.4. SWOT Analysis
- 11.1.13 Panasonic Corporation
- 11.1.13.1. Company Overview
- 11.1.13.2. Products
- 11.1.13.3. Company Financials
- 11.1.13.4. SWOT Analysis
- 11.1.1 Matrox Imaging Ltd
- 11.2. Market Entropy
- 11.2.1 Company's Key Areas Served
- 11.2.2 Recent Developments
- 11.3. Company Market Share Analysis 2025
- 11.3.1 Top 5 Companies Market Share Analysis
- 11.3.2 Top 3 Companies Market Share Analysis
- 11.4. List of Potential Customers
- 12. Research Methodology
List of Figures
- Figure 1: Global Surface Vision & Inspection Equipment Industry Revenue Breakdown (billion, %) by Region 2025 & 2033
- Figure 2: North America Surface Vision & Inspection Equipment Industry Revenue (billion), by Component 2025 & 2033
- Figure 3: North America Surface Vision & Inspection Equipment Industry Revenue Share (%), by Component 2025 & 2033
- Figure 4: North America Surface Vision & Inspection Equipment Industry Revenue (billion), by Application 2025 & 2033
- Figure 5: North America Surface Vision & Inspection Equipment Industry Revenue Share (%), by Application 2025 & 2033
- Figure 6: North America Surface Vision & Inspection Equipment Industry Revenue (billion), by Country 2025 & 2033
- Figure 7: North America Surface Vision & Inspection Equipment Industry Revenue Share (%), by Country 2025 & 2033
- Figure 8: Europe Surface Vision & Inspection Equipment Industry Revenue (billion), by Component 2025 & 2033
- Figure 9: Europe Surface Vision & Inspection Equipment Industry Revenue Share (%), by Component 2025 & 2033
- Figure 10: Europe Surface Vision & Inspection Equipment Industry Revenue (billion), by Application 2025 & 2033
- Figure 11: Europe Surface Vision & Inspection Equipment Industry Revenue Share (%), by Application 2025 & 2033
- Figure 12: Europe Surface Vision & Inspection Equipment Industry Revenue (billion), by Country 2025 & 2033
- Figure 13: Europe Surface Vision & Inspection Equipment Industry Revenue Share (%), by Country 2025 & 2033
- Figure 14: Asia Pacific Surface Vision & Inspection Equipment Industry Revenue (billion), by Component 2025 & 2033
- Figure 15: Asia Pacific Surface Vision & Inspection Equipment Industry Revenue Share (%), by Component 2025 & 2033
- Figure 16: Asia Pacific Surface Vision & Inspection Equipment Industry Revenue (billion), by Application 2025 & 2033
- Figure 17: Asia Pacific Surface Vision & Inspection Equipment Industry Revenue Share (%), by Application 2025 & 2033
- Figure 18: Asia Pacific Surface Vision & Inspection Equipment Industry Revenue (billion), by Country 2025 & 2033
- Figure 19: Asia Pacific Surface Vision & Inspection Equipment Industry Revenue Share (%), by Country 2025 & 2033
- Figure 20: Rest of the World Surface Vision & Inspection Equipment Industry Revenue (billion), by Component 2025 & 2033
- Figure 21: Rest of the World Surface Vision & Inspection Equipment Industry Revenue Share (%), by Component 2025 & 2033
- Figure 22: Rest of the World Surface Vision & Inspection Equipment Industry Revenue (billion), by Application 2025 & 2033
- Figure 23: Rest of the World Surface Vision & Inspection Equipment Industry Revenue Share (%), by Application 2025 & 2033
- Figure 24: Rest of the World Surface Vision & Inspection Equipment Industry Revenue (billion), by Country 2025 & 2033
- Figure 25: Rest of the World Surface Vision & Inspection Equipment Industry Revenue Share (%), by Country 2025 & 2033
List of Tables
- Table 1: Global Surface Vision & Inspection Equipment Industry Revenue billion Forecast, by Component 2020 & 2033
- Table 2: Global Surface Vision & Inspection Equipment Industry Revenue billion Forecast, by Application 2020 & 2033
- Table 3: Global Surface Vision & Inspection Equipment Industry Revenue billion Forecast, by Region 2020 & 2033
- Table 4: Global Surface Vision & Inspection Equipment Industry Revenue billion Forecast, by Component 2020 & 2033
- Table 5: Global Surface Vision & Inspection Equipment Industry Revenue billion Forecast, by Application 2020 & 2033
- Table 6: Global Surface Vision & Inspection Equipment Industry Revenue billion Forecast, by Country 2020 & 2033
- Table 7: Global Surface Vision & Inspection Equipment Industry Revenue billion Forecast, by Component 2020 & 2033
- Table 8: Global Surface Vision & Inspection Equipment Industry Revenue billion Forecast, by Application 2020 & 2033
- Table 9: Global Surface Vision & Inspection Equipment Industry Revenue billion Forecast, by Country 2020 & 2033
- Table 10: Global Surface Vision & Inspection Equipment Industry Revenue billion Forecast, by Component 2020 & 2033
- Table 11: Global Surface Vision & Inspection Equipment Industry Revenue billion Forecast, by Application 2020 & 2033
- Table 12: Global Surface Vision & Inspection Equipment Industry Revenue billion Forecast, by Country 2020 & 2033
- Table 13: Global Surface Vision & Inspection Equipment Industry Revenue billion Forecast, by Component 2020 & 2033
- Table 14: Global Surface Vision & Inspection Equipment Industry Revenue billion Forecast, by Application 2020 & 2033
- Table 15: Global Surface Vision & Inspection Equipment Industry Revenue billion Forecast, by Country 2020 & 2033
Frequently Asked Questions
1. What is the projected Compound Annual Growth Rate (CAGR) of the Surface Vision & Inspection Equipment Industry?
The projected CAGR is approximately 14.56%.
2. Which companies are prominent players in the Surface Vision & Inspection Equipment Industry?
Key companies in the market include Matrox Imaging Ltd, Keyence Corporation, Shenzhen Sipotek Technology Co Ltd, Isra Vision AG, Cognex Corporation, Stemmer Imaging AG, AMETEK Surface Vision, Omron Corporation, Comvis AG*List Not Exhaustive, Daitron Inc, Flexfilm Ltd, Edmund Scientific Corporation, Panasonic Corporation.
3. What are the main segments of the Surface Vision & Inspection Equipment Industry?
The market segments include Component, Application.
4. Can you provide details about the market size?
The market size is estimated to be USD 14.86 billion as of 2022.
5. What are some drivers contributing to market growth?
; Increasing Need for Better Manufacturing Production Capacity at Reduced Cost; Growing Demand for Qualitative Products; Increasing Adoption of Industrial 4.0 and IoT.
6. What are the notable trends driving market growth?
Camera Segment is expected to Hold the Largest Market Size during the Forecast Period.
7. Are there any restraints impacting market growth?
; Lack of Skilled Labor.
8. Can you provide examples of recent developments in the market?
N/A
9. What pricing options are available for accessing the report?
Pricing options include single-user, multi-user, and enterprise licenses priced at USD 4750, USD 5250, and USD 8750 respectively.
10. Is the market size provided in terms of value or volume?
The market size is provided in terms of value, measured in billion.
11. Are there any specific market keywords associated with the report?
Yes, the market keyword associated with the report is "Surface Vision & Inspection Equipment Industry," which aids in identifying and referencing the specific market segment covered.
12. How do I determine which pricing option suits my needs best?
The pricing options vary based on user requirements and access needs. Individual users may opt for single-user licenses, while businesses requiring broader access may choose multi-user or enterprise licenses for cost-effective access to the report.
13. Are there any additional resources or data provided in the Surface Vision & Inspection Equipment Industry report?
While the report offers comprehensive insights, it's advisable to review the specific contents or supplementary materials provided to ascertain if additional resources or data are available.
14. How can I stay updated on further developments or reports in the Surface Vision & Inspection Equipment Industry?
To stay informed about further developments, trends, and reports in the Surface Vision & Inspection Equipment Industry, consider subscribing to industry newsletters, following relevant companies and organizations, or regularly checking reputable industry news sources and publications.
Methodology
Step 1 - Identification of Relevant Samples Size from Population Database


Step 2 - Approaches for Defining Global Market Size (Value, Volume* & Price*)

Note*: In applicable scenarios
Step 3 - Data Sources
Primary Research
- Web Analytics
- Survey Reports
- Research Institute
- Latest Research Reports
- Opinion Leaders
Secondary Research
- Annual Reports
- White Paper
- Latest Press Release
- Industry Association
- Paid Database
- Investor Presentations

Step 4 - Data Triangulation
Involves using different sources of information in order to increase the validity of a study
These sources are likely to be stakeholders in a program - participants, other researchers, program staff, other community members, and so on.
Then we put all data in single framework & apply various statistical tools to find out the dynamic on the market.
During the analysis stage, feedback from the stakeholder groups would be compared to determine areas of agreement as well as areas of divergence