Key Insights
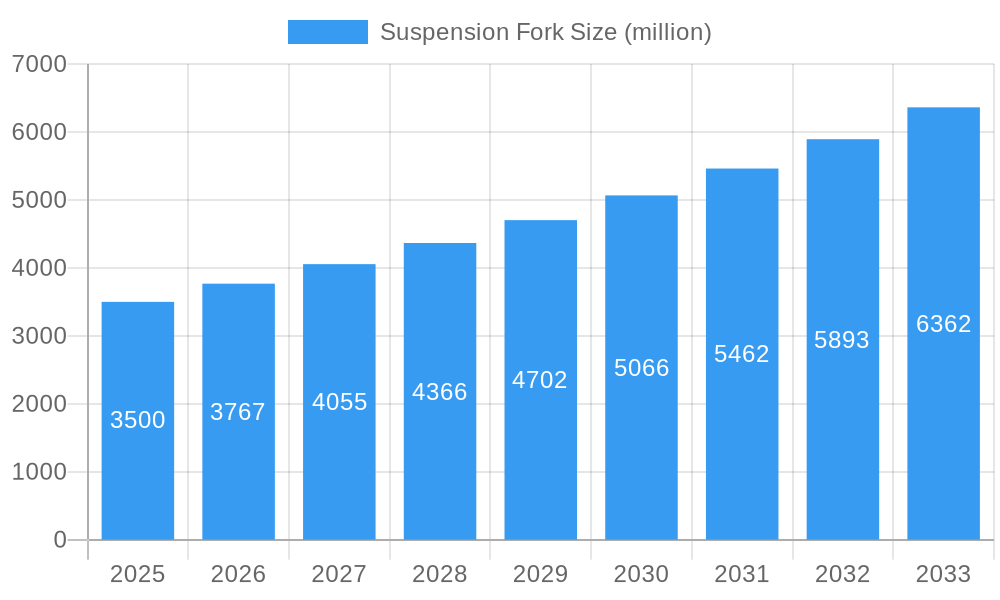
The global suspension fork market is poised for significant expansion, projected to reach an estimated value of $3,500 million by 2025, with a robust Compound Annual Growth Rate (CAGR) of 7.5% projected through 2033. This impressive growth is primarily fueled by the escalating popularity of cycling as a recreational activity and a mode of transportation, particularly within the mountain biking segment. Advancements in suspension technology, offering improved performance, comfort, and durability, are a major driver, encouraging both OEM manufacturers and aftermarket consumers to invest in premium components. The increasing disposable income and a growing health-conscious population worldwide are further contributing to the demand for bicycles equipped with sophisticated suspension systems. Innovations in materials like carbon fiber and advanced damping technologies are also shaping the market, pushing the boundaries of what’s possible in bike performance and appealing to a wider audience of cycling enthusiasts.
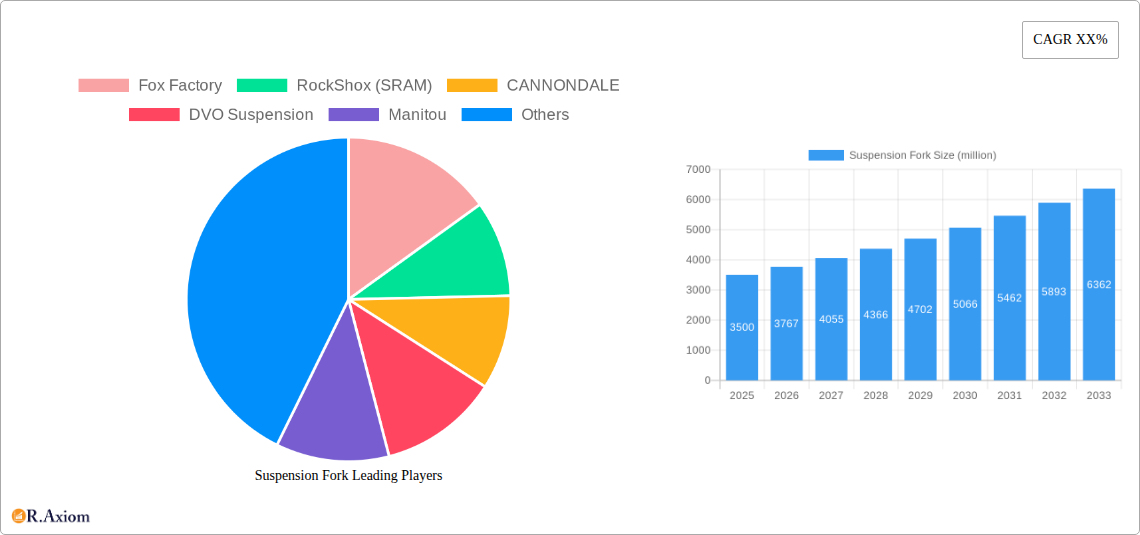
Suspension Fork Market Size (In Billion)
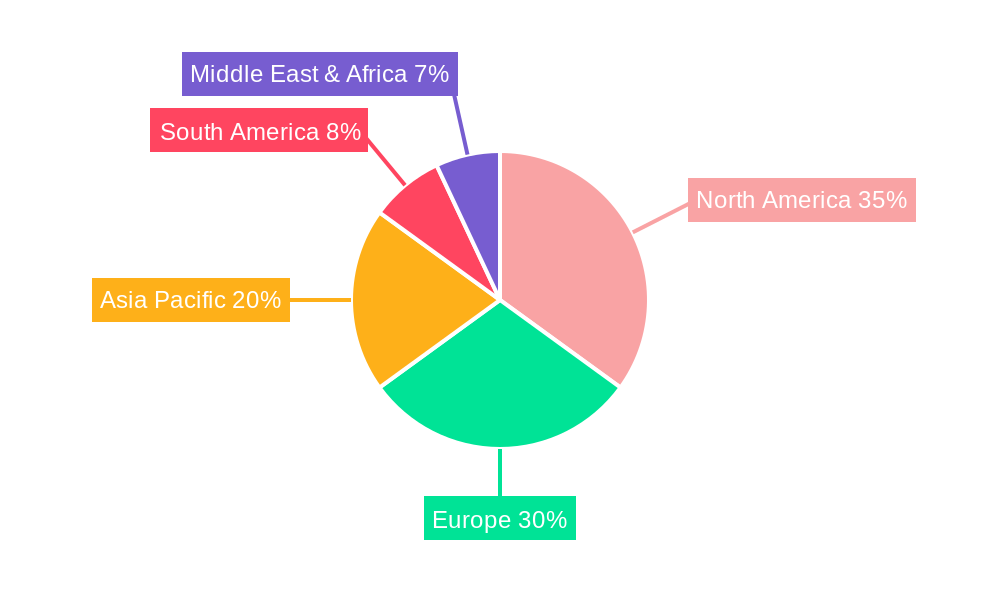
The market's trajectory is characterized by several key trends, including the rise of electric mountain bikes (e-MTBs) which necessitate specialized, robust suspension solutions, and a growing demand for customizable suspension setups tailored to specific riding styles and terrains. The aftermarket segment is experiencing substantial growth as riders seek to upgrade their existing bikes for enhanced performance and personalization. However, the market faces certain restraints, such as the high cost of premium suspension forks, which can be a barrier for budget-conscious consumers. Additionally, the complexity of suspension maintenance and the availability of counterfeits pose challenges. Geographically, North America and Europe currently dominate the market, driven by well-established cycling cultures and a high concentration of affluent consumers. The Asia Pacific region, however, is emerging as a high-growth area, propelled by increasing urbanization, a burgeoning middle class, and a growing adoption of cycling for both sport and leisure. Key players like Fox Factory, RockShox (SRAM), and SR Suntour are actively investing in research and development to introduce innovative products and capture market share in this dynamic landscape.
Suspension Fork Company Market Share
This in-depth report provides a detailed examination of the global Suspension Fork market, encompassing historical performance, current trends, and future projections. With a study period spanning from 2019 to 2033, and a base year of 2025, this report offers actionable intelligence for stakeholders across the entire value chain, from manufacturers to end-users. We delve into market concentration, key industry drivers, dominant segments, product innovations, and strategic opportunities, utilizing high-traffic keywords to ensure maximum search visibility for crucial terms such as "bicycle suspension," "MTB forks," "OEM suspension," "aftermarket bike parts," "cross country suspension," "downhill forks," and "electric bike suspension."
Suspension Fork Market Concentration & Innovation
The global Suspension Fork market exhibits a moderately concentrated landscape, with a few dominant players holding significant market share, estimated to be over 70 million units in 2025. Innovation remains a primary driver, fueled by advancements in materials science, damping technologies, and integration with e-bike systems. Regulatory frameworks, while generally supportive of sporting goods, may influence manufacturing standards and material sourcing. Product substitutes are limited, primarily consisting of rigid forks and basic suspension systems, but their appeal is largely confined to niche markets or entry-level bicycles. End-user trends are rapidly evolving, with a growing demand for lighter, more adjustable, and electronically controlled suspension systems across all cycling disciplines. Mergers and acquisitions (M&A) activity is expected to remain a key strategy for consolidating market share and acquiring innovative technologies. The estimated total M&A deal value is projected to reach over 150 million in the forecast period. Key companies leading innovation include Fox Factory, RockShox (SRAM), and SR Suntour, with an estimated combined market share of over 60 million units in 2025.
Suspension Fork Industry Trends & Insights
The Suspension Fork industry is experiencing robust growth, projected to achieve a Compound Annual Growth Rate (CAGR) of approximately 6.5% from 2025 to 2033. This expansion is primarily driven by the increasing popularity of cycling as a recreational activity and competitive sport worldwide. The proliferation of dedicated cycling infrastructure, such as mountain bike trails and urban cycle paths, further stimulates demand. Technological disruptions are at the forefront, with the integration of advanced materials like carbon fiber and titanium, leading to lighter and more durable forks. Furthermore, the adoption of electronic damping systems and app-controlled adjustability is transforming the user experience, offering unparalleled customization and performance optimization. Consumer preferences are leaning towards forks with enhanced shock absorption, improved handling, and greater versatility for diverse terrain. The aftermarket segment, valued at over 50 million units in 2025, plays a crucial role in enabling riders to upgrade their existing bicycles with high-performance suspension solutions. The competitive dynamics are characterized by continuous product development and a focus on catering to specialized riding styles. Market penetration for advanced suspension technologies is expected to exceed 40% by 2030, indicating a strong shift towards premium components. The overall market size for suspension forks is estimated to surpass 100 million units by 2033, driven by both OEM and aftermarket sales.
Dominant Markets & Segments in Suspension Fork
The Cross Country Bike segment, specifically within the OEM application, currently dominates the Suspension Fork market, accounting for an estimated 30 million units in 2025. This dominance is attributed to the widespread popularity of cross-country mountain biking as a recreational and competitive discipline, particularly in North America and Europe. Key drivers include substantial investments in cycling infrastructure, favorable government policies promoting outdoor recreation, and a large existing base of cross-country mountain bikes requiring original equipment suspension. The economic policies in developed nations encourage consumer spending on premium sporting goods, further bolstering this segment.
The Aftermarket segment, though smaller than OEM, is experiencing significant growth, with an estimated market size of over 20 million units in 2025. This growth is fueled by riders seeking to upgrade their existing bicycles with specialized suspension solutions that offer enhanced performance, durability, and adjustability. Consumer preference for personalized riding experiences and the availability of a wide range of aftermarket forks catering to specific disciplines, such as downhill and enduro, are major contributing factors.
In terms of Types, the Downhill Bike suspension forks represent another significant segment, with an estimated market of over 15 million units in 2025. This segment is driven by the adrenaline-seeking nature of downhill mountain biking and the need for robust, high-travel suspension systems capable of absorbing extreme impacts. The increasing number of professional and amateur downhill racing events worldwide also contributes to the demand.
The Dual Slalom Bike and Free Rider Bike segments, while smaller, are showing promising growth potential, particularly in emerging markets. These segments cater to specialized riding styles and are benefiting from the overall expansion of the mountain biking community and the diversification of cycling disciplines.
Suspension Fork Product Developments
Product innovations in the Suspension Fork market are primarily focused on enhancing performance, reducing weight, and improving adjustability. Developments include the integration of advanced damping technologies, such as intelligent electronic control systems that automatically adjust suspension based on terrain and rider input. Lightweight materials like carbon fiber composites and titanium alloys are increasingly being utilized to improve power-to-weight ratios. Furthermore, manufacturers are introducing forks with longer travel ranges and more sophisticated leverage ratios to cater to the demands of extreme riding disciplines. These advancements offer competitive advantages by providing riders with superior control, comfort, and efficiency across varied terrains.
Report Scope & Segmentation Analysis
This report segments the Suspension Fork market by Application, encompassing OEM and Aftermarket categories. The OEM segment, representing forks supplied directly to bicycle manufacturers, is projected to maintain a strong market share due to new bicycle production. The Aftermarket segment, catering to individual riders seeking replacements or upgrades, is expected to witness a higher CAGR, driven by the desire for performance enhancement and customization.
Further segmentation by Types includes Cross Country Bike, Downhill Bike, Dual Slalom Bike, and Free Rider Bike forks. The Cross Country Bike segment is anticipated to lead in terms of volume, driven by the popularity of this cycling discipline. The Downhill Bike segment is expected to show robust growth due to the increasing popularity of extreme sports. The Dual Slalom and Free Rider Bike segments, while niche, offer significant growth potential as these cycling disciplines gain traction.
Key Drivers of Suspension Fork Growth
The growth of the Suspension Fork market is propelled by several key factors. Technologically, advancements in materials science and damping systems are creating lighter, more durable, and more responsive forks, meeting the evolving demands of riders. Economically, rising disposable incomes and the increasing affordability of bicycles, especially e-bikes, are expanding the consumer base. Furthermore, a global surge in participation in cycling as a recreational activity and sport, supported by government initiatives promoting health and sustainable transportation, is a significant catalyst. The aftermarket segment also benefits from a strong desire among enthusiasts to upgrade and personalize their riding experience.
Challenges in the Suspension Fork Sector
Despite strong growth prospects, the Suspension Fork sector faces several challenges. Regulatory hurdles related to safety standards and material sourcing can impact production costs and timelines. Supply chain disruptions, as witnessed in recent years, can lead to component shortages and increased lead times. Intense competitive pressures among established players and emerging manufacturers necessitate continuous innovation and cost optimization. Furthermore, the high cost of advanced suspension technologies can be a barrier to entry for price-sensitive consumers, impacting market penetration in certain segments.
Emerging Opportunities in Suspension Fork
Emerging opportunities in the Suspension Fork market are centered around several key areas. The rapid growth of the electric bicycle (e-bike) segment presents a significant opportunity, as e-bikes often require more robust and specialized suspension systems to handle increased weight and speed. Furthermore, the development of smart suspension systems with integrated sensors and electronic controls offers a premium market segment with the potential for high-margin sales. Expansion into emerging economies with a growing middle class and increasing interest in outdoor activities also presents a substantial growth avenue. Collaboration with sports federations and event organizers can further enhance brand visibility and market penetration.
Leading Players in the Suspension Fork Market
- Fox Factory
- RockShox (SRAM)
- CANNONDALE
- DVO Suspension
- Manitou
- HL CORP(SHENZHEN)
- Lauf Forks
- Dah Ken Industrial
- Cane Creek
- A-PRO
- SR Suntour
- DT Swiss
Key Developments in Suspension Fork Industry
- 2023/07: Introduction of new lightweight carbon fiber stanchion technology by leading manufacturers, aiming to reduce overall fork weight by over 15%.
- 2022/11: Major players launch electronically controlled damping systems for MTB forks, offering real-time terrain adaptation and personalized rider settings.
- 2021/04: Increased adoption of e-bike specific suspension designs, featuring higher damping capabilities and reinforced structures to handle increased loads.
- 2020/09: Significant investment in R&D for integrated suspension and frame designs, particularly for performance-oriented bicycles.
- 2019/05: Focus on sustainability in manufacturing processes and material sourcing, with companies exploring recycled materials and reduced environmental impact.
Strategic Outlook for Suspension Fork Market
The strategic outlook for the Suspension Fork market is highly positive, driven by a confluence of escalating consumer interest in cycling, continuous technological advancements, and the expansion of the e-bike sector. Key growth catalysts include the development of more intelligent and adaptive suspension systems, catering to the evolving demands for performance and customization. Strategic partnerships with bicycle manufacturers for OEM integration and a robust aftermarket strategy will be crucial for sustained success. Furthermore, capitalizing on emerging markets and embracing sustainable manufacturing practices will be vital for long-term growth and brand competitiveness. The market is poised for continued innovation and expansion, offering significant opportunities for stakeholders willing to adapt to evolving trends.
Suspension Fork Segmentation
-
1. Application
- 1.1. OEM
- 1.2. Aftermarket
-
2. Types
- 2.1. Cross Country Bike
- 2.2. Downhill Bike
- 2.3. Dual Slalom Bike
- 2.4. Free Rider Bike
Suspension Fork Segmentation By Geography
-
1. North America
- 1.1. United States
- 1.2. Canada
- 1.3. Mexico
-
2. South America
- 2.1. Brazil
- 2.2. Argentina
- 2.3. Rest of South America
-
3. Europe
- 3.1. United Kingdom
- 3.2. Germany
- 3.3. France
- 3.4. Italy
- 3.5. Spain
- 3.6. Russia
- 3.7. Benelux
- 3.8. Nordics
- 3.9. Rest of Europe
-
4. Middle East & Africa
- 4.1. Turkey
- 4.2. Israel
- 4.3. GCC
- 4.4. North Africa
- 4.5. South Africa
- 4.6. Rest of Middle East & Africa
-
5. Asia Pacific
- 5.1. China
- 5.2. India
- 5.3. Japan
- 5.4. South Korea
- 5.5. ASEAN
- 5.6. Oceania
- 5.7. Rest of Asia Pacific
Suspension Fork Regional Market Share
Geographic Coverage of Suspension Fork
Suspension Fork REPORT HIGHLIGHTS
| Aspects | Details |
|---|---|
| Study Period | 2020-2034 |
| Base Year | 2025 |
| Estimated Year | 2026 |
| Forecast Period | 2026-2034 |
| Historical Period | 2020-2025 |
| Growth Rate | CAGR of 5.5% from 2020-2034 |
| Segmentation |
|
Table of Contents
- 1. Introduction
- 1.1. Research Scope
- 1.2. Market Segmentation
- 1.3. Research Methodology
- 1.4. Definitions and Assumptions
- 2. Executive Summary
- 2.1. Introduction
- 3. Market Dynamics
- 3.1. Introduction
- 3.2. Market Drivers
- 3.3. Market Restrains
- 3.4. Market Trends
- 4. Market Factor Analysis
- 4.1. Porters Five Forces
- 4.2. Supply/Value Chain
- 4.3. PESTEL analysis
- 4.4. Market Entropy
- 4.5. Patent/Trademark Analysis
- 5. Global Suspension Fork Analysis, Insights and Forecast, 2020-2032
- 5.1. Market Analysis, Insights and Forecast - by Application
- 5.1.1. OEM
- 5.1.2. Aftermarket
- 5.2. Market Analysis, Insights and Forecast - by Types
- 5.2.1. Cross Country Bike
- 5.2.2. Downhill Bike
- 5.2.3. Dual Slalom Bike
- 5.2.4. Free Rider Bike
- 5.3. Market Analysis, Insights and Forecast - by Region
- 5.3.1. North America
- 5.3.2. South America
- 5.3.3. Europe
- 5.3.4. Middle East & Africa
- 5.3.5. Asia Pacific
- 5.1. Market Analysis, Insights and Forecast - by Application
- 6. North America Suspension Fork Analysis, Insights and Forecast, 2020-2032
- 6.1. Market Analysis, Insights and Forecast - by Application
- 6.1.1. OEM
- 6.1.2. Aftermarket
- 6.2. Market Analysis, Insights and Forecast - by Types
- 6.2.1. Cross Country Bike
- 6.2.2. Downhill Bike
- 6.2.3. Dual Slalom Bike
- 6.2.4. Free Rider Bike
- 6.1. Market Analysis, Insights and Forecast - by Application
- 7. South America Suspension Fork Analysis, Insights and Forecast, 2020-2032
- 7.1. Market Analysis, Insights and Forecast - by Application
- 7.1.1. OEM
- 7.1.2. Aftermarket
- 7.2. Market Analysis, Insights and Forecast - by Types
- 7.2.1. Cross Country Bike
- 7.2.2. Downhill Bike
- 7.2.3. Dual Slalom Bike
- 7.2.4. Free Rider Bike
- 7.1. Market Analysis, Insights and Forecast - by Application
- 8. Europe Suspension Fork Analysis, Insights and Forecast, 2020-2032
- 8.1. Market Analysis, Insights and Forecast - by Application
- 8.1.1. OEM
- 8.1.2. Aftermarket
- 8.2. Market Analysis, Insights and Forecast - by Types
- 8.2.1. Cross Country Bike
- 8.2.2. Downhill Bike
- 8.2.3. Dual Slalom Bike
- 8.2.4. Free Rider Bike
- 8.1. Market Analysis, Insights and Forecast - by Application
- 9. Middle East & Africa Suspension Fork Analysis, Insights and Forecast, 2020-2032
- 9.1. Market Analysis, Insights and Forecast - by Application
- 9.1.1. OEM
- 9.1.2. Aftermarket
- 9.2. Market Analysis, Insights and Forecast - by Types
- 9.2.1. Cross Country Bike
- 9.2.2. Downhill Bike
- 9.2.3. Dual Slalom Bike
- 9.2.4. Free Rider Bike
- 9.1. Market Analysis, Insights and Forecast - by Application
- 10. Asia Pacific Suspension Fork Analysis, Insights and Forecast, 2020-2032
- 10.1. Market Analysis, Insights and Forecast - by Application
- 10.1.1. OEM
- 10.1.2. Aftermarket
- 10.2. Market Analysis, Insights and Forecast - by Types
- 10.2.1. Cross Country Bike
- 10.2.2. Downhill Bike
- 10.2.3. Dual Slalom Bike
- 10.2.4. Free Rider Bike
- 10.1. Market Analysis, Insights and Forecast - by Application
- 11. Competitive Analysis
- 11.1. Global Market Share Analysis 2025
- 11.2. Company Profiles
- 11.2.1 Fox Factory
- 11.2.1.1. Overview
- 11.2.1.2. Products
- 11.2.1.3. SWOT Analysis
- 11.2.1.4. Recent Developments
- 11.2.1.5. Financials (Based on Availability)
- 11.2.2 RockShox (SRAM)
- 11.2.2.1. Overview
- 11.2.2.2. Products
- 11.2.2.3. SWOT Analysis
- 11.2.2.4. Recent Developments
- 11.2.2.5. Financials (Based on Availability)
- 11.2.3 CANNONDALE
- 11.2.3.1. Overview
- 11.2.3.2. Products
- 11.2.3.3. SWOT Analysis
- 11.2.3.4. Recent Developments
- 11.2.3.5. Financials (Based on Availability)
- 11.2.4 DVO Suspension
- 11.2.4.1. Overview
- 11.2.4.2. Products
- 11.2.4.3. SWOT Analysis
- 11.2.4.4. Recent Developments
- 11.2.4.5. Financials (Based on Availability)
- 11.2.5 Manitou
- 11.2.5.1. Overview
- 11.2.5.2. Products
- 11.2.5.3. SWOT Analysis
- 11.2.5.4. Recent Developments
- 11.2.5.5. Financials (Based on Availability)
- 11.2.6 HL CORP(SHENZHEN)
- 11.2.6.1. Overview
- 11.2.6.2. Products
- 11.2.6.3. SWOT Analysis
- 11.2.6.4. Recent Developments
- 11.2.6.5. Financials (Based on Availability)
- 11.2.7 Lauf Forks
- 11.2.7.1. Overview
- 11.2.7.2. Products
- 11.2.7.3. SWOT Analysis
- 11.2.7.4. Recent Developments
- 11.2.7.5. Financials (Based on Availability)
- 11.2.8 Dah Ken Industrial
- 11.2.8.1. Overview
- 11.2.8.2. Products
- 11.2.8.3. SWOT Analysis
- 11.2.8.4. Recent Developments
- 11.2.8.5. Financials (Based on Availability)
- 11.2.9 Cane Creek
- 11.2.9.1. Overview
- 11.2.9.2. Products
- 11.2.9.3. SWOT Analysis
- 11.2.9.4. Recent Developments
- 11.2.9.5. Financials (Based on Availability)
- 11.2.10 A-PRO
- 11.2.10.1. Overview
- 11.2.10.2. Products
- 11.2.10.3. SWOT Analysis
- 11.2.10.4. Recent Developments
- 11.2.10.5. Financials (Based on Availability)
- 11.2.11 SR Suntour
- 11.2.11.1. Overview
- 11.2.11.2. Products
- 11.2.11.3. SWOT Analysis
- 11.2.11.4. Recent Developments
- 11.2.11.5. Financials (Based on Availability)
- 11.2.12 DT Swiss
- 11.2.12.1. Overview
- 11.2.12.2. Products
- 11.2.12.3. SWOT Analysis
- 11.2.12.4. Recent Developments
- 11.2.12.5. Financials (Based on Availability)
- 11.2.1 Fox Factory
List of Figures
- Figure 1: Global Suspension Fork Revenue Breakdown (undefined, %) by Region 2025 & 2033
- Figure 2: Global Suspension Fork Volume Breakdown (K, %) by Region 2025 & 2033
- Figure 3: North America Suspension Fork Revenue (undefined), by Application 2025 & 2033
- Figure 4: North America Suspension Fork Volume (K), by Application 2025 & 2033
- Figure 5: North America Suspension Fork Revenue Share (%), by Application 2025 & 2033
- Figure 6: North America Suspension Fork Volume Share (%), by Application 2025 & 2033
- Figure 7: North America Suspension Fork Revenue (undefined), by Types 2025 & 2033
- Figure 8: North America Suspension Fork Volume (K), by Types 2025 & 2033
- Figure 9: North America Suspension Fork Revenue Share (%), by Types 2025 & 2033
- Figure 10: North America Suspension Fork Volume Share (%), by Types 2025 & 2033
- Figure 11: North America Suspension Fork Revenue (undefined), by Country 2025 & 2033
- Figure 12: North America Suspension Fork Volume (K), by Country 2025 & 2033
- Figure 13: North America Suspension Fork Revenue Share (%), by Country 2025 & 2033
- Figure 14: North America Suspension Fork Volume Share (%), by Country 2025 & 2033
- Figure 15: South America Suspension Fork Revenue (undefined), by Application 2025 & 2033
- Figure 16: South America Suspension Fork Volume (K), by Application 2025 & 2033
- Figure 17: South America Suspension Fork Revenue Share (%), by Application 2025 & 2033
- Figure 18: South America Suspension Fork Volume Share (%), by Application 2025 & 2033
- Figure 19: South America Suspension Fork Revenue (undefined), by Types 2025 & 2033
- Figure 20: South America Suspension Fork Volume (K), by Types 2025 & 2033
- Figure 21: South America Suspension Fork Revenue Share (%), by Types 2025 & 2033
- Figure 22: South America Suspension Fork Volume Share (%), by Types 2025 & 2033
- Figure 23: South America Suspension Fork Revenue (undefined), by Country 2025 & 2033
- Figure 24: South America Suspension Fork Volume (K), by Country 2025 & 2033
- Figure 25: South America Suspension Fork Revenue Share (%), by Country 2025 & 2033
- Figure 26: South America Suspension Fork Volume Share (%), by Country 2025 & 2033
- Figure 27: Europe Suspension Fork Revenue (undefined), by Application 2025 & 2033
- Figure 28: Europe Suspension Fork Volume (K), by Application 2025 & 2033
- Figure 29: Europe Suspension Fork Revenue Share (%), by Application 2025 & 2033
- Figure 30: Europe Suspension Fork Volume Share (%), by Application 2025 & 2033
- Figure 31: Europe Suspension Fork Revenue (undefined), by Types 2025 & 2033
- Figure 32: Europe Suspension Fork Volume (K), by Types 2025 & 2033
- Figure 33: Europe Suspension Fork Revenue Share (%), by Types 2025 & 2033
- Figure 34: Europe Suspension Fork Volume Share (%), by Types 2025 & 2033
- Figure 35: Europe Suspension Fork Revenue (undefined), by Country 2025 & 2033
- Figure 36: Europe Suspension Fork Volume (K), by Country 2025 & 2033
- Figure 37: Europe Suspension Fork Revenue Share (%), by Country 2025 & 2033
- Figure 38: Europe Suspension Fork Volume Share (%), by Country 2025 & 2033
- Figure 39: Middle East & Africa Suspension Fork Revenue (undefined), by Application 2025 & 2033
- Figure 40: Middle East & Africa Suspension Fork Volume (K), by Application 2025 & 2033
- Figure 41: Middle East & Africa Suspension Fork Revenue Share (%), by Application 2025 & 2033
- Figure 42: Middle East & Africa Suspension Fork Volume Share (%), by Application 2025 & 2033
- Figure 43: Middle East & Africa Suspension Fork Revenue (undefined), by Types 2025 & 2033
- Figure 44: Middle East & Africa Suspension Fork Volume (K), by Types 2025 & 2033
- Figure 45: Middle East & Africa Suspension Fork Revenue Share (%), by Types 2025 & 2033
- Figure 46: Middle East & Africa Suspension Fork Volume Share (%), by Types 2025 & 2033
- Figure 47: Middle East & Africa Suspension Fork Revenue (undefined), by Country 2025 & 2033
- Figure 48: Middle East & Africa Suspension Fork Volume (K), by Country 2025 & 2033
- Figure 49: Middle East & Africa Suspension Fork Revenue Share (%), by Country 2025 & 2033
- Figure 50: Middle East & Africa Suspension Fork Volume Share (%), by Country 2025 & 2033
- Figure 51: Asia Pacific Suspension Fork Revenue (undefined), by Application 2025 & 2033
- Figure 52: Asia Pacific Suspension Fork Volume (K), by Application 2025 & 2033
- Figure 53: Asia Pacific Suspension Fork Revenue Share (%), by Application 2025 & 2033
- Figure 54: Asia Pacific Suspension Fork Volume Share (%), by Application 2025 & 2033
- Figure 55: Asia Pacific Suspension Fork Revenue (undefined), by Types 2025 & 2033
- Figure 56: Asia Pacific Suspension Fork Volume (K), by Types 2025 & 2033
- Figure 57: Asia Pacific Suspension Fork Revenue Share (%), by Types 2025 & 2033
- Figure 58: Asia Pacific Suspension Fork Volume Share (%), by Types 2025 & 2033
- Figure 59: Asia Pacific Suspension Fork Revenue (undefined), by Country 2025 & 2033
- Figure 60: Asia Pacific Suspension Fork Volume (K), by Country 2025 & 2033
- Figure 61: Asia Pacific Suspension Fork Revenue Share (%), by Country 2025 & 2033
- Figure 62: Asia Pacific Suspension Fork Volume Share (%), by Country 2025 & 2033
List of Tables
- Table 1: Global Suspension Fork Revenue undefined Forecast, by Application 2020 & 2033
- Table 2: Global Suspension Fork Volume K Forecast, by Application 2020 & 2033
- Table 3: Global Suspension Fork Revenue undefined Forecast, by Types 2020 & 2033
- Table 4: Global Suspension Fork Volume K Forecast, by Types 2020 & 2033
- Table 5: Global Suspension Fork Revenue undefined Forecast, by Region 2020 & 2033
- Table 6: Global Suspension Fork Volume K Forecast, by Region 2020 & 2033
- Table 7: Global Suspension Fork Revenue undefined Forecast, by Application 2020 & 2033
- Table 8: Global Suspension Fork Volume K Forecast, by Application 2020 & 2033
- Table 9: Global Suspension Fork Revenue undefined Forecast, by Types 2020 & 2033
- Table 10: Global Suspension Fork Volume K Forecast, by Types 2020 & 2033
- Table 11: Global Suspension Fork Revenue undefined Forecast, by Country 2020 & 2033
- Table 12: Global Suspension Fork Volume K Forecast, by Country 2020 & 2033
- Table 13: United States Suspension Fork Revenue (undefined) Forecast, by Application 2020 & 2033
- Table 14: United States Suspension Fork Volume (K) Forecast, by Application 2020 & 2033
- Table 15: Canada Suspension Fork Revenue (undefined) Forecast, by Application 2020 & 2033
- Table 16: Canada Suspension Fork Volume (K) Forecast, by Application 2020 & 2033
- Table 17: Mexico Suspension Fork Revenue (undefined) Forecast, by Application 2020 & 2033
- Table 18: Mexico Suspension Fork Volume (K) Forecast, by Application 2020 & 2033
- Table 19: Global Suspension Fork Revenue undefined Forecast, by Application 2020 & 2033
- Table 20: Global Suspension Fork Volume K Forecast, by Application 2020 & 2033
- Table 21: Global Suspension Fork Revenue undefined Forecast, by Types 2020 & 2033
- Table 22: Global Suspension Fork Volume K Forecast, by Types 2020 & 2033
- Table 23: Global Suspension Fork Revenue undefined Forecast, by Country 2020 & 2033
- Table 24: Global Suspension Fork Volume K Forecast, by Country 2020 & 2033
- Table 25: Brazil Suspension Fork Revenue (undefined) Forecast, by Application 2020 & 2033
- Table 26: Brazil Suspension Fork Volume (K) Forecast, by Application 2020 & 2033
- Table 27: Argentina Suspension Fork Revenue (undefined) Forecast, by Application 2020 & 2033
- Table 28: Argentina Suspension Fork Volume (K) Forecast, by Application 2020 & 2033
- Table 29: Rest of South America Suspension Fork Revenue (undefined) Forecast, by Application 2020 & 2033
- Table 30: Rest of South America Suspension Fork Volume (K) Forecast, by Application 2020 & 2033
- Table 31: Global Suspension Fork Revenue undefined Forecast, by Application 2020 & 2033
- Table 32: Global Suspension Fork Volume K Forecast, by Application 2020 & 2033
- Table 33: Global Suspension Fork Revenue undefined Forecast, by Types 2020 & 2033
- Table 34: Global Suspension Fork Volume K Forecast, by Types 2020 & 2033
- Table 35: Global Suspension Fork Revenue undefined Forecast, by Country 2020 & 2033
- Table 36: Global Suspension Fork Volume K Forecast, by Country 2020 & 2033
- Table 37: United Kingdom Suspension Fork Revenue (undefined) Forecast, by Application 2020 & 2033
- Table 38: United Kingdom Suspension Fork Volume (K) Forecast, by Application 2020 & 2033
- Table 39: Germany Suspension Fork Revenue (undefined) Forecast, by Application 2020 & 2033
- Table 40: Germany Suspension Fork Volume (K) Forecast, by Application 2020 & 2033
- Table 41: France Suspension Fork Revenue (undefined) Forecast, by Application 2020 & 2033
- Table 42: France Suspension Fork Volume (K) Forecast, by Application 2020 & 2033
- Table 43: Italy Suspension Fork Revenue (undefined) Forecast, by Application 2020 & 2033
- Table 44: Italy Suspension Fork Volume (K) Forecast, by Application 2020 & 2033
- Table 45: Spain Suspension Fork Revenue (undefined) Forecast, by Application 2020 & 2033
- Table 46: Spain Suspension Fork Volume (K) Forecast, by Application 2020 & 2033
- Table 47: Russia Suspension Fork Revenue (undefined) Forecast, by Application 2020 & 2033
- Table 48: Russia Suspension Fork Volume (K) Forecast, by Application 2020 & 2033
- Table 49: Benelux Suspension Fork Revenue (undefined) Forecast, by Application 2020 & 2033
- Table 50: Benelux Suspension Fork Volume (K) Forecast, by Application 2020 & 2033
- Table 51: Nordics Suspension Fork Revenue (undefined) Forecast, by Application 2020 & 2033
- Table 52: Nordics Suspension Fork Volume (K) Forecast, by Application 2020 & 2033
- Table 53: Rest of Europe Suspension Fork Revenue (undefined) Forecast, by Application 2020 & 2033
- Table 54: Rest of Europe Suspension Fork Volume (K) Forecast, by Application 2020 & 2033
- Table 55: Global Suspension Fork Revenue undefined Forecast, by Application 2020 & 2033
- Table 56: Global Suspension Fork Volume K Forecast, by Application 2020 & 2033
- Table 57: Global Suspension Fork Revenue undefined Forecast, by Types 2020 & 2033
- Table 58: Global Suspension Fork Volume K Forecast, by Types 2020 & 2033
- Table 59: Global Suspension Fork Revenue undefined Forecast, by Country 2020 & 2033
- Table 60: Global Suspension Fork Volume K Forecast, by Country 2020 & 2033
- Table 61: Turkey Suspension Fork Revenue (undefined) Forecast, by Application 2020 & 2033
- Table 62: Turkey Suspension Fork Volume (K) Forecast, by Application 2020 & 2033
- Table 63: Israel Suspension Fork Revenue (undefined) Forecast, by Application 2020 & 2033
- Table 64: Israel Suspension Fork Volume (K) Forecast, by Application 2020 & 2033
- Table 65: GCC Suspension Fork Revenue (undefined) Forecast, by Application 2020 & 2033
- Table 66: GCC Suspension Fork Volume (K) Forecast, by Application 2020 & 2033
- Table 67: North Africa Suspension Fork Revenue (undefined) Forecast, by Application 2020 & 2033
- Table 68: North Africa Suspension Fork Volume (K) Forecast, by Application 2020 & 2033
- Table 69: South Africa Suspension Fork Revenue (undefined) Forecast, by Application 2020 & 2033
- Table 70: South Africa Suspension Fork Volume (K) Forecast, by Application 2020 & 2033
- Table 71: Rest of Middle East & Africa Suspension Fork Revenue (undefined) Forecast, by Application 2020 & 2033
- Table 72: Rest of Middle East & Africa Suspension Fork Volume (K) Forecast, by Application 2020 & 2033
- Table 73: Global Suspension Fork Revenue undefined Forecast, by Application 2020 & 2033
- Table 74: Global Suspension Fork Volume K Forecast, by Application 2020 & 2033
- Table 75: Global Suspension Fork Revenue undefined Forecast, by Types 2020 & 2033
- Table 76: Global Suspension Fork Volume K Forecast, by Types 2020 & 2033
- Table 77: Global Suspension Fork Revenue undefined Forecast, by Country 2020 & 2033
- Table 78: Global Suspension Fork Volume K Forecast, by Country 2020 & 2033
- Table 79: China Suspension Fork Revenue (undefined) Forecast, by Application 2020 & 2033
- Table 80: China Suspension Fork Volume (K) Forecast, by Application 2020 & 2033
- Table 81: India Suspension Fork Revenue (undefined) Forecast, by Application 2020 & 2033
- Table 82: India Suspension Fork Volume (K) Forecast, by Application 2020 & 2033
- Table 83: Japan Suspension Fork Revenue (undefined) Forecast, by Application 2020 & 2033
- Table 84: Japan Suspension Fork Volume (K) Forecast, by Application 2020 & 2033
- Table 85: South Korea Suspension Fork Revenue (undefined) Forecast, by Application 2020 & 2033
- Table 86: South Korea Suspension Fork Volume (K) Forecast, by Application 2020 & 2033
- Table 87: ASEAN Suspension Fork Revenue (undefined) Forecast, by Application 2020 & 2033
- Table 88: ASEAN Suspension Fork Volume (K) Forecast, by Application 2020 & 2033
- Table 89: Oceania Suspension Fork Revenue (undefined) Forecast, by Application 2020 & 2033
- Table 90: Oceania Suspension Fork Volume (K) Forecast, by Application 2020 & 2033
- Table 91: Rest of Asia Pacific Suspension Fork Revenue (undefined) Forecast, by Application 2020 & 2033
- Table 92: Rest of Asia Pacific Suspension Fork Volume (K) Forecast, by Application 2020 & 2033
Frequently Asked Questions
1. What is the projected Compound Annual Growth Rate (CAGR) of the Suspension Fork?
The projected CAGR is approximately 5.5%.
2. Which companies are prominent players in the Suspension Fork?
Key companies in the market include Fox Factory, RockShox (SRAM), CANNONDALE, DVO Suspension, Manitou, HL CORP(SHENZHEN), Lauf Forks, Dah Ken Industrial, Cane Creek, A-PRO, SR Suntour, DT Swiss.
3. What are the main segments of the Suspension Fork?
The market segments include Application, Types.
4. Can you provide details about the market size?
The market size is estimated to be USD XXX N/A as of 2022.
5. What are some drivers contributing to market growth?
N/A
6. What are the notable trends driving market growth?
N/A
7. Are there any restraints impacting market growth?
N/A
8. Can you provide examples of recent developments in the market?
N/A
9. What pricing options are available for accessing the report?
Pricing options include single-user, multi-user, and enterprise licenses priced at USD 3350.00, USD 5025.00, and USD 6700.00 respectively.
10. Is the market size provided in terms of value or volume?
The market size is provided in terms of value, measured in N/A and volume, measured in K.
11. Are there any specific market keywords associated with the report?
Yes, the market keyword associated with the report is "Suspension Fork," which aids in identifying and referencing the specific market segment covered.
12. How do I determine which pricing option suits my needs best?
The pricing options vary based on user requirements and access needs. Individual users may opt for single-user licenses, while businesses requiring broader access may choose multi-user or enterprise licenses for cost-effective access to the report.
13. Are there any additional resources or data provided in the Suspension Fork report?
While the report offers comprehensive insights, it's advisable to review the specific contents or supplementary materials provided to ascertain if additional resources or data are available.
14. How can I stay updated on further developments or reports in the Suspension Fork?
To stay informed about further developments, trends, and reports in the Suspension Fork, consider subscribing to industry newsletters, following relevant companies and organizations, or regularly checking reputable industry news sources and publications.
Methodology
Step 1 - Identification of Relevant Samples Size from Population Database


Step 2 - Approaches for Defining Global Market Size (Value, Volume* & Price*)

Note*: In applicable scenarios
Step 3 - Data Sources
Primary Research
- Web Analytics
- Survey Reports
- Research Institute
- Latest Research Reports
- Opinion Leaders
Secondary Research
- Annual Reports
- White Paper
- Latest Press Release
- Industry Association
- Paid Database
- Investor Presentations

Step 4 - Data Triangulation
Involves using different sources of information in order to increase the validity of a study
These sources are likely to be stakeholders in a program - participants, other researchers, program staff, other community members, and so on.
Then we put all data in single framework & apply various statistical tools to find out the dynamic on the market.
During the analysis stage, feedback from the stakeholder groups would be compared to determine areas of agreement as well as areas of divergence

