

Key Insights
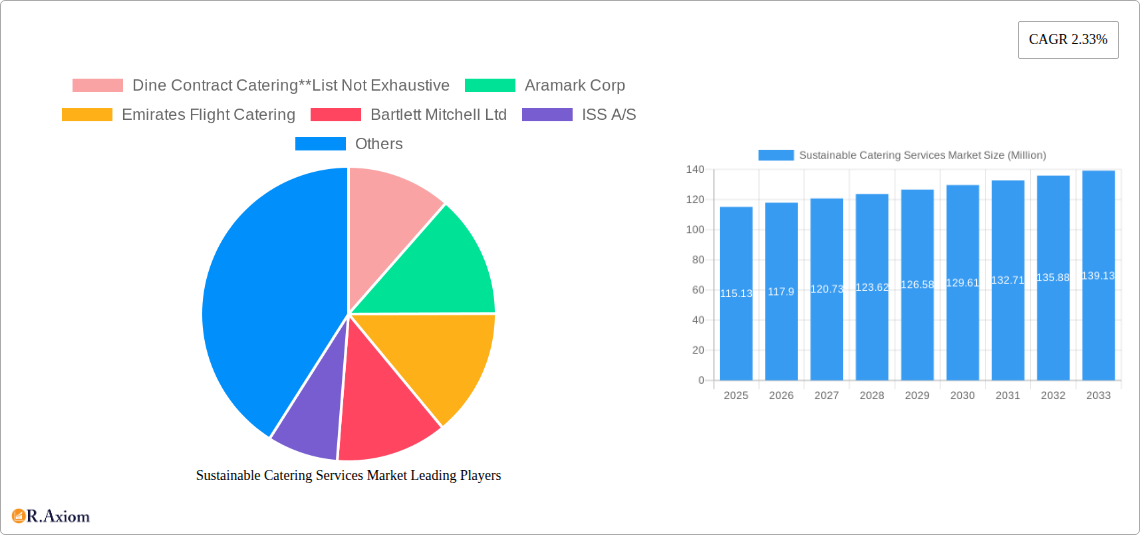
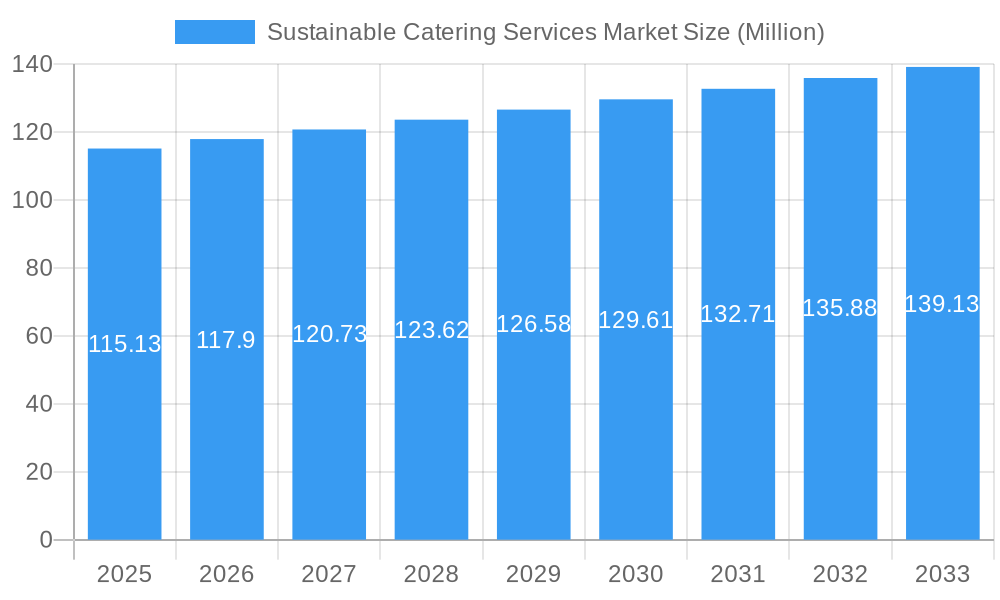
The global sustainable catering services market, valued at $115.13 million in 2025, is projected to experience steady growth, driven by increasing consumer awareness of environmental and social responsibility, coupled with a rising demand for ethically sourced and locally produced food. The market's Compound Annual Growth Rate (CAGR) of 2.33% from 2025 to 2033 indicates a consistent expansion, albeit at a moderate pace. This growth is fueled by several key market drivers: the burgeoning hospitality sector's adoption of sustainable practices, the growing popularity of plant-based and vegetarian catering options, and stringent government regulations promoting sustainable food systems. Contractual catering services, particularly within the corporate and educational sectors, represent a significant market segment, driven by long-term contracts and the need for consistent, sustainable food solutions. However, high initial investment costs associated with sustainable practices and the potential for fluctuating ingredient prices might pose challenges to market expansion. The increasing popularity of online food ordering and delivery platforms presents both an opportunity and a challenge, requiring sustainable catering businesses to adapt their operations and delivery models to meet evolving consumer preferences.
Sustainable Catering Services Market Market Size (In Million)
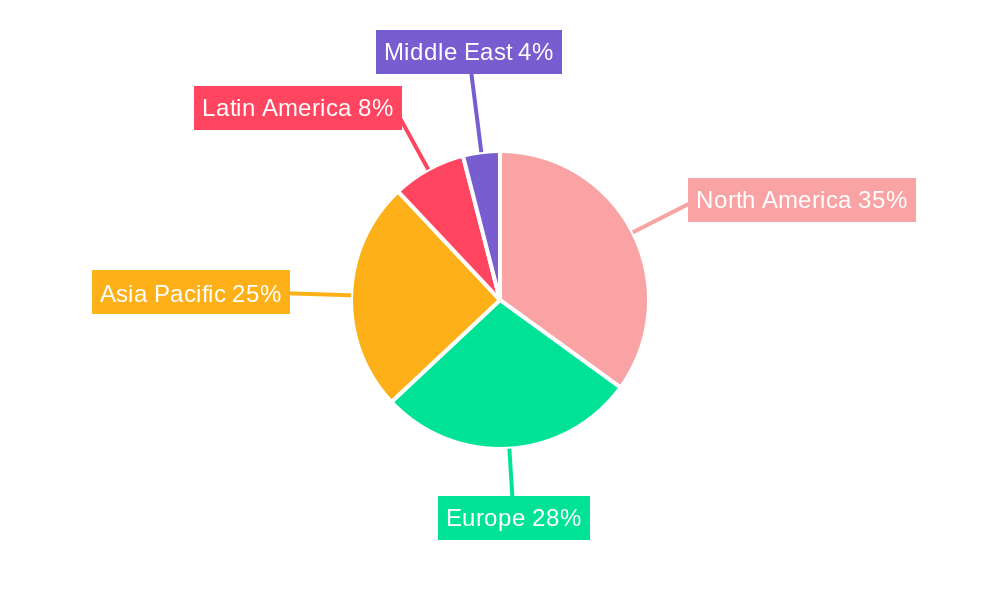
The market segmentation reveals valuable insights into consumer preferences and industry trends. The preference for corporate and wedding events in the event-type segment reflects the significance of these occasions in driving catering demand. The substantial share held by the hospitality end-user segment highlights the crucial role of sustainable practices within the hotel and restaurant industry. Key players like Compass Group PLC, Aramark Corp, and others are actively shaping the market through strategic partnerships, investments in sustainable sourcing, and innovative menu offerings. Geographic expansion into regions like Asia Pacific and Latin America, where demand for sustainable practices is steadily increasing, presents significant growth opportunities. Further research focusing on specific consumer preferences within different regions and event types will allow for refined market strategies and more effective resource allocation.
Sustainable Catering Services Market Company Market Share
Sustainable Catering Services Market: A Comprehensive Report, 2019-2033
This comprehensive report provides an in-depth analysis of the Sustainable Catering Services Market from 2019 to 2033, offering crucial insights for industry stakeholders, investors, and businesses seeking to navigate this rapidly evolving sector. The report covers market size, segmentation, key players, growth drivers, challenges, and future opportunities. With a base year of 2025 and a forecast period spanning 2025-2033, this report provides actionable intelligence for informed decision-making.
Sustainable Catering Services Market Concentration & Innovation
The sustainable catering services market exhibits a moderately concentrated landscape, with several large multinational corporations holding significant market share. However, a number of smaller, specialized companies are also thriving by focusing on niche segments and innovative sustainable practices. Market concentration is influenced by factors such as mergers and acquisitions (M&A), brand recognition, and geographical reach. Key metrics like market share are analyzed, revealing the dominance of players such as Compass Group PLC and Aramark Corp. The USD 600 Million acquisition of CH&CO by Compass Group PLC in January 2024 exemplifies the significant M&A activity within the industry, aiming to consolidate market share and expand service offerings. Innovation is a key driver, with companies increasingly focusing on reducing their carbon footprint through sustainable sourcing, waste reduction programs, and the adoption of eco-friendly packaging and technologies. Regulatory frameworks promoting sustainability, such as stricter waste management regulations and food sourcing guidelines, are also shaping market dynamics. The increasing consumer demand for ethical and environmentally conscious choices serves as a powerful catalyst for innovation within the sector. The availability of substitute services, particularly from independent, smaller catering businesses, creates competitive pressure, further driving innovation in efficiency and sustainability. End-user trends are also crucial, reflecting a growing preference for sustainable food choices, affecting the demand and business models across the industry.
Sustainable Catering Services Market Industry Trends & Insights
The sustainable catering services market is experiencing robust growth, driven by increasing consumer awareness of environmental and social responsibility, coupled with stringent government regulations pushing for sustainability. This report analyzes the market's Compound Annual Growth Rate (CAGR) during the historical period (2019-2024) and forecasts the CAGR for the projection period (2025-2033) at xx%. Technological disruptions, such as the introduction of innovative food waste reduction technologies and smart ordering systems, are streamlining operations and enhancing efficiency. Consumer preferences are leaning towards plant-based options, locally sourced ingredients, and reduced packaging, creating new opportunities for catering companies that can adapt to these demands. The competitive landscape is characterized by intense competition, with companies focusing on differentiation through service quality, sustainability initiatives, and technological advancements. Market penetration of sustainable catering services is increasing across various segments, fueled by growing consumer acceptance of premium pricing for ethical and environmentally conscious options.
Dominant Markets & Segments in Sustainable Catering Services Market
The report identifies key dominant markets and segments within the sustainable catering services sector, analyzing their market share and growth trajectory.
- By Service Type: Contractual catering services currently holds the largest market share, driven by consistent demand from corporations and educational institutions. Non-contractual catering services show strong growth potential, driven by increased demand for sustainable event catering.
- By Event Type: Corporate events and weddings represent the dominant segments. The growth of corporate social responsibility initiatives is significantly boosting demand for sustainable corporate catering. The wedding segment benefits from the rising preference for eco-friendly celebrations.
- By End-User: The hospitality sector and the educational sector are among the key end-users. The growth in these segments is fueled by a growing awareness of sustainability and a desire to reduce their overall environmental impact. While the healthcare sector's adoption of sustainable practices is growing, the segment remains relatively smaller due to its distinct needs in terms of food safety and regulatory compliance.
Several key factors drive the dominance of these segments. For example, economic policies promoting sustainable businesses and government incentives play a significant role in driving growth within specific segments and geographic locations. Furthermore, the existing infrastructure, such as reliable supply chains for sustainable ingredients and well-established waste management systems, plays an essential role in market growth.
Sustainable Catering Services Market Product Developments
The sustainable catering services market is witnessing a wave of product innovations, driven by the increasing demand for eco-friendly solutions. This includes the development of compostable and biodegradable packaging, the utilization of locally sourced and seasonal ingredients, and the adoption of innovative food waste management techniques. These developments enhance the environmental profile of catering services, contributing to increased market competitiveness and better aligning with the growing consumer preference for sustainability. The emphasis on technology has led to the development of smart catering management systems that optimize resource use and reduce waste generation. This combination of product innovation and technological integration is contributing to the sustainable catering sector's growth and profitability.
Report Scope & Segmentation Analysis
This report provides a comprehensive segmentation analysis of the sustainable catering services market, covering several key dimensions.
By Service Type: The market is segmented into Contractual Catering Services, Non-Contractual Catering Services, and Other Catering Services. Each segment's growth projection, market size, and competitive landscape are analyzed, revealing the dominant players and emerging trends.
By Event Type: The analysis encompasses Corporate, Wedding, Social Events, and Other Events. The varying growth rates and market sizes across these segments are explored, providing insights into market dynamics and customer preferences.
By End-User: The report dissects the market across Individuals, Hospitality, Educational, Healthcare, In-Flight, and Other End Users. Market size, growth projections, and the influence of individual sector dynamics are key aspects of this segment analysis. Competitive dynamics within each segment are also assessed.
Key Drivers of Sustainable Catering Services Market Growth
The growth of the sustainable catering services market is propelled by several key factors. The rising consumer awareness of environmental issues and the increasing demand for ethically sourced food are significant drivers. Government regulations promoting sustainability, such as carbon emission reduction targets and waste management policies, further accelerate market growth. Technological advancements, including food waste reduction technologies and sustainable packaging solutions, are playing a critical role in enhancing efficiency and reducing environmental impact. The expansion of the hospitality and corporate sectors, with their increasing adoption of sustainable practices, also contributes significantly to market growth.
Challenges in the Sustainable Catering Services Market Sector
The sustainable catering services market faces several challenges. The higher costs associated with sustainable ingredients and packaging can impact profitability, creating a challenge for price-sensitive customers. Maintaining a reliable supply chain for sustainable products presents logistical complexities, particularly for businesses operating across wider geographical areas. Regulatory compliance for sustainability standards, which vary across regions, can be complicated and costly to manage, impacting market efficiency and increasing compliance costs. Intense competition among catering companies also necessitates continuous innovation and efficiency improvements to remain competitive.
Emerging Opportunities in Sustainable Catering Services Market
The sustainable catering services market presents exciting opportunities for growth. Expanding into emerging markets with a rising middle class, increasing disposable income, and growing awareness of environmental issues represents a significant untapped market potential. The development and adoption of innovative technologies, like AI-driven food waste management systems and sustainable packaging solutions, will provide companies with competitive advantages. Catering to the increasing demand for plant-based and customized dietary options, responding to specific consumer health needs and preferences, presents lucrative market opportunities.
Leading Players in the Sustainable Catering Services Market Market
- Dine Contract Catering
- Aramark Corp [Aramark Corp]
- Emirates Flight Catering [Emirates Flight Catering]
- Bartlett Mitchell Ltd
- ISS A/S [ISS A/S]
- Elior Group [Elior Group]
- Entier Limited
- Compass Group PLC [Compass Group PLC]
- DO & CO Aktiengesellschaft [DO & CO Aktiengesellschaft]
- CH and Co Catering Group Ltd
Key Developments in Sustainable Catering Services Market Industry
- January 2024: Compass Group PLC acquired CH&CO for USD 600 Million, significantly impacting market consolidation.
- May 2023: Aramark partnered with Bean Sprouts, expanding its offerings in the healthy and child-focused food segment, indicating a trend toward specialized sustainable food solutions.
Strategic Outlook for Sustainable Catering Services Market Market
The future of the sustainable catering services market appears bright, driven by a confluence of factors. Growing consumer demand for environmentally friendly options, coupled with increasing regulatory pressure for sustainability, positions the sector for sustained growth. Technological advancements and innovative business models will continue to shape the market landscape, fostering greater efficiency and reducing environmental impact. Strategic partnerships and acquisitions will likely reshape market dynamics, with larger players consolidating their market share while smaller, specialized companies focus on niche segments and premium services. The overall market outlook anticipates consistent growth driven by an ever-increasing focus on sustainability.
Sustainable Catering Services Market Segmentation
-
1. Service Type
- 1.1. Contractual Catering Services
- 1.2. Non-Contractual Catering Services
- 1.3. Other Catering Services
-
2. Event Type
- 2.1. Corporate
- 2.2. Wedding
- 2.3. Social Events
- 2.4. Others
-
3. End-User
- 3.1. Individuals
- 3.2. Hospitality
- 3.3. Educational
- 3.4. Healthcare
- 3.5. In-Flight
- 3.6. Other End Users
- 4. Geography
-
5. North America
- 5.1. United States
- 5.2. Canada
- 5.3. Mexico
- 5.4. Rest of North America
-
6. Europe
- 6.1. United Kingdom
- 6.2. Germany
- 6.3. France
- 6.4. Russia
- 6.5. Italy
- 6.6. Spain
- 6.7. Rest of Europe
-
7. Asia-Pacific
- 7.1. India
- 7.2. China
- 7.3. Japan
- 7.4. Australia
- 7.5. Rest of Asia-Pacific
-
8. South America
- 8.1. Brazil
- 8.2. Argentina
- 8.3. Rest of South America
-
9. Middle-East and Africa
- 9.1. United Arab Emirates
- 9.2. South Africa
- 9.3. Rest of Middle-East and Africa
Sustainable Catering Services Market Segmentation By Geography
-
1. North America
- 1.1. United States
- 1.2. Canada
- 1.3. Mexico
-
2. South America
- 2.1. Brazil
- 2.2. Argentina
- 2.3. Rest of South America
-
3. Europe
- 3.1. United Kingdom
- 3.2. Germany
- 3.3. France
- 3.4. Italy
- 3.5. Spain
- 3.6. Russia
- 3.7. Benelux
- 3.8. Nordics
- 3.9. Rest of Europe
-
4. Middle East & Africa
- 4.1. Turkey
- 4.2. Israel
- 4.3. GCC
- 4.4. North Africa
- 4.5. South Africa
- 4.6. Rest of Middle East & Africa
-
5. Asia Pacific
- 5.1. China
- 5.2. India
- 5.3. Japan
- 5.4. South Korea
- 5.5. ASEAN
- 5.6. Oceania
- 5.7. Rest of Asia Pacific
Sustainable Catering Services Market Regional Market Share
Geographic Coverage of Sustainable Catering Services Market
Sustainable Catering Services Market REPORT HIGHLIGHTS
| Aspects | Details |
|---|---|
| Study Period | 2020-2034 |
| Base Year | 2025 |
| Estimated Year | 2026 |
| Forecast Period | 2026-2034 |
| Historical Period | 2020-2025 |
| Growth Rate | CAGR of 2.33% from 2020-2034 |
| Segmentation |
|
Table of Contents
- 1. Introduction
- 1.1. Research Scope
- 1.2. Market Segmentation
- 1.3. Research Objective
- 1.4. Definitions and Assumptions
- 2. Executive Summary
- 2.1. Market Snapshot
- 3. Market Dynamics
- 3.1. Market Drivers
- 3.2. Market Restrains
- 3.3. Market Trends
- 3.4. Market Opportunities
- 4. Market Factor Analysis
- 4.1. Porters Five Forces
- 4.1.1. Bargaining Power of Suppliers
- 4.1.2. Bargaining Power of Buyers
- 4.1.3. Threat of New Entrants
- 4.1.4. Threat of Substitutes
- 4.1.5. Competitive Rivalry
- 4.2. PESTEL analysis
- 4.3. BCG Analysis
- 4.3.1. Stars (High Growth, High Market Share)
- 4.3.2. Cash Cows (Low Growth, High Market Share)
- 4.3.3. Question Mark (High Growth, Low Market Share)
- 4.3.4. Dogs (Low Growth, Low Market Share)
- 4.4. Ansoff Matrix Analysis
- 4.5. Supply Chain Analysis
- 4.6. Regulatory Landscape
- 4.7. Current Market Potential and Opportunity Assessment (TAM–SAM–SOM Framework)
- 4.8. RAX Analyst Note
- 4.1. Porters Five Forces
- 5. Market Analysis, Insights and Forecast 2021-2033
- 5.1. Market Analysis, Insights and Forecast - by Service Type
- 5.1.1. Contractual Catering Services
- 5.1.2. Non-Contractual Catering Services
- 5.1.3. Other Catering Services
- 5.2. Market Analysis, Insights and Forecast - by Event Type
- 5.2.1. Corporate
- 5.2.2. Wedding
- 5.2.3. Social Events
- 5.2.4. Others
- 5.3. Market Analysis, Insights and Forecast - by End-User
- 5.3.1. Individuals
- 5.3.2. Hospitality
- 5.3.3. Educational
- 5.3.4. Healthcare
- 5.3.5. In-Flight
- 5.3.6. Other End Users
- 5.4. Market Analysis, Insights and Forecast - by Geography
- 5.5. Market Analysis, Insights and Forecast - by North America
- 5.5.1. United States
- 5.5.2. Canada
- 5.5.3. Mexico
- 5.5.4. Rest of North America
- 5.6. Market Analysis, Insights and Forecast - by Europe
- 5.6.1. United Kingdom
- 5.6.2. Germany
- 5.6.3. France
- 5.6.4. Russia
- 5.6.5. Italy
- 5.6.6. Spain
- 5.6.7. Rest of Europe
- 5.7. Market Analysis, Insights and Forecast - by Asia-Pacific
- 5.7.1. India
- 5.7.2. China
- 5.7.3. Japan
- 5.7.4. Australia
- 5.7.5. Rest of Asia-Pacific
- 5.8. Market Analysis, Insights and Forecast - by South America
- 5.8.1. Brazil
- 5.8.2. Argentina
- 5.8.3. Rest of South America
- 5.9. Market Analysis, Insights and Forecast - by Middle-East and Africa
- 5.9.1. United Arab Emirates
- 5.9.2. South Africa
- 5.9.3. Rest of Middle-East and Africa
- 5.10. Market Analysis, Insights and Forecast - by Region
- 5.10.1. North America
- 5.10.2. South America
- 5.10.3. Europe
- 5.10.4. Middle East & Africa
- 5.10.5. Asia Pacific
- 5.1. Market Analysis, Insights and Forecast - by Service Type
- 6. Global Sustainable Catering Services Market Analysis, Insights and Forecast, 2021-2033
- 6.1. Market Analysis, Insights and Forecast - by Service Type
- 6.1.1. Contractual Catering Services
- 6.1.2. Non-Contractual Catering Services
- 6.1.3. Other Catering Services
- 6.2. Market Analysis, Insights and Forecast - by Event Type
- 6.2.1. Corporate
- 6.2.2. Wedding
- 6.2.3. Social Events
- 6.2.4. Others
- 6.3. Market Analysis, Insights and Forecast - by End-User
- 6.3.1. Individuals
- 6.3.2. Hospitality
- 6.3.3. Educational
- 6.3.4. Healthcare
- 6.3.5. In-Flight
- 6.3.6. Other End Users
- 6.4. Market Analysis, Insights and Forecast - by Geography
- 6.5. Market Analysis, Insights and Forecast - by North America
- 6.5.1. United States
- 6.5.2. Canada
- 6.5.3. Mexico
- 6.5.4. Rest of North America
- 6.6. Market Analysis, Insights and Forecast - by Europe
- 6.6.1. United Kingdom
- 6.6.2. Germany
- 6.6.3. France
- 6.6.4. Russia
- 6.6.5. Italy
- 6.6.6. Spain
- 6.6.7. Rest of Europe
- 6.7. Market Analysis, Insights and Forecast - by Asia-Pacific
- 6.7.1. India
- 6.7.2. China
- 6.7.3. Japan
- 6.7.4. Australia
- 6.7.5. Rest of Asia-Pacific
- 6.8. Market Analysis, Insights and Forecast - by South America
- 6.8.1. Brazil
- 6.8.2. Argentina
- 6.8.3. Rest of South America
- 6.9. Market Analysis, Insights and Forecast - by Middle-East and Africa
- 6.9.1. United Arab Emirates
- 6.9.2. South Africa
- 6.9.3. Rest of Middle-East and Africa
- 6.1. Market Analysis, Insights and Forecast - by Service Type
- 7. North America Sustainable Catering Services Market Analysis, Insights and Forecast, 2020-2032
- 7.1. Market Analysis, Insights and Forecast - by Service Type
- 7.1.1. Contractual Catering Services
- 7.1.2. Non-Contractual Catering Services
- 7.1.3. Other Catering Services
- 7.2. Market Analysis, Insights and Forecast - by Event Type
- 7.2.1. Corporate
- 7.2.2. Wedding
- 7.2.3. Social Events
- 7.2.4. Others
- 7.3. Market Analysis, Insights and Forecast - by End-User
- 7.3.1. Individuals
- 7.3.2. Hospitality
- 7.3.3. Educational
- 7.3.4. Healthcare
- 7.3.5. In-Flight
- 7.3.6. Other End Users
- 7.4. Market Analysis, Insights and Forecast - by Geography
- 7.5. Market Analysis, Insights and Forecast - by North America
- 7.5.1. United States
- 7.5.2. Canada
- 7.5.3. Mexico
- 7.5.4. Rest of North America
- 7.6. Market Analysis, Insights and Forecast - by Europe
- 7.6.1. United Kingdom
- 7.6.2. Germany
- 7.6.3. France
- 7.6.4. Russia
- 7.6.5. Italy
- 7.6.6. Spain
- 7.6.7. Rest of Europe
- 7.7. Market Analysis, Insights and Forecast - by Asia-Pacific
- 7.7.1. India
- 7.7.2. China
- 7.7.3. Japan
- 7.7.4. Australia
- 7.7.5. Rest of Asia-Pacific
- 7.8. Market Analysis, Insights and Forecast - by South America
- 7.8.1. Brazil
- 7.8.2. Argentina
- 7.8.3. Rest of South America
- 7.9. Market Analysis, Insights and Forecast - by Middle-East and Africa
- 7.9.1. United Arab Emirates
- 7.9.2. South Africa
- 7.9.3. Rest of Middle-East and Africa
- 7.1. Market Analysis, Insights and Forecast - by Service Type
- 8. South America Sustainable Catering Services Market Analysis, Insights and Forecast, 2020-2032
- 8.1. Market Analysis, Insights and Forecast - by Service Type
- 8.1.1. Contractual Catering Services
- 8.1.2. Non-Contractual Catering Services
- 8.1.3. Other Catering Services
- 8.2. Market Analysis, Insights and Forecast - by Event Type
- 8.2.1. Corporate
- 8.2.2. Wedding
- 8.2.3. Social Events
- 8.2.4. Others
- 8.3. Market Analysis, Insights and Forecast - by End-User
- 8.3.1. Individuals
- 8.3.2. Hospitality
- 8.3.3. Educational
- 8.3.4. Healthcare
- 8.3.5. In-Flight
- 8.3.6. Other End Users
- 8.4. Market Analysis, Insights and Forecast - by Geography
- 8.5. Market Analysis, Insights and Forecast - by North America
- 8.5.1. United States
- 8.5.2. Canada
- 8.5.3. Mexico
- 8.5.4. Rest of North America
- 8.6. Market Analysis, Insights and Forecast - by Europe
- 8.6.1. United Kingdom
- 8.6.2. Germany
- 8.6.3. France
- 8.6.4. Russia
- 8.6.5. Italy
- 8.6.6. Spain
- 8.6.7. Rest of Europe
- 8.7. Market Analysis, Insights and Forecast - by Asia-Pacific
- 8.7.1. India
- 8.7.2. China
- 8.7.3. Japan
- 8.7.4. Australia
- 8.7.5. Rest of Asia-Pacific
- 8.8. Market Analysis, Insights and Forecast - by South America
- 8.8.1. Brazil
- 8.8.2. Argentina
- 8.8.3. Rest of South America
- 8.9. Market Analysis, Insights and Forecast - by Middle-East and Africa
- 8.9.1. United Arab Emirates
- 8.9.2. South Africa
- 8.9.3. Rest of Middle-East and Africa
- 8.1. Market Analysis, Insights and Forecast - by Service Type
- 9. Europe Sustainable Catering Services Market Analysis, Insights and Forecast, 2020-2032
- 9.1. Market Analysis, Insights and Forecast - by Service Type
- 9.1.1. Contractual Catering Services
- 9.1.2. Non-Contractual Catering Services
- 9.1.3. Other Catering Services
- 9.2. Market Analysis, Insights and Forecast - by Event Type
- 9.2.1. Corporate
- 9.2.2. Wedding
- 9.2.3. Social Events
- 9.2.4. Others
- 9.3. Market Analysis, Insights and Forecast - by End-User
- 9.3.1. Individuals
- 9.3.2. Hospitality
- 9.3.3. Educational
- 9.3.4. Healthcare
- 9.3.5. In-Flight
- 9.3.6. Other End Users
- 9.4. Market Analysis, Insights and Forecast - by Geography
- 9.5. Market Analysis, Insights and Forecast - by North America
- 9.5.1. United States
- 9.5.2. Canada
- 9.5.3. Mexico
- 9.5.4. Rest of North America
- 9.6. Market Analysis, Insights and Forecast - by Europe
- 9.6.1. United Kingdom
- 9.6.2. Germany
- 9.6.3. France
- 9.6.4. Russia
- 9.6.5. Italy
- 9.6.6. Spain
- 9.6.7. Rest of Europe
- 9.7. Market Analysis, Insights and Forecast - by Asia-Pacific
- 9.7.1. India
- 9.7.2. China
- 9.7.3. Japan
- 9.7.4. Australia
- 9.7.5. Rest of Asia-Pacific
- 9.8. Market Analysis, Insights and Forecast - by South America
- 9.8.1. Brazil
- 9.8.2. Argentina
- 9.8.3. Rest of South America
- 9.9. Market Analysis, Insights and Forecast - by Middle-East and Africa
- 9.9.1. United Arab Emirates
- 9.9.2. South Africa
- 9.9.3. Rest of Middle-East and Africa
- 9.1. Market Analysis, Insights and Forecast - by Service Type
- 10. Middle East & Africa Sustainable Catering Services Market Analysis, Insights and Forecast, 2020-2032
- 10.1. Market Analysis, Insights and Forecast - by Service Type
- 10.1.1. Contractual Catering Services
- 10.1.2. Non-Contractual Catering Services
- 10.1.3. Other Catering Services
- 10.2. Market Analysis, Insights and Forecast - by Event Type
- 10.2.1. Corporate
- 10.2.2. Wedding
- 10.2.3. Social Events
- 10.2.4. Others
- 10.3. Market Analysis, Insights and Forecast - by End-User
- 10.3.1. Individuals
- 10.3.2. Hospitality
- 10.3.3. Educational
- 10.3.4. Healthcare
- 10.3.5. In-Flight
- 10.3.6. Other End Users
- 10.4. Market Analysis, Insights and Forecast - by Geography
- 10.5. Market Analysis, Insights and Forecast - by North America
- 10.5.1. United States
- 10.5.2. Canada
- 10.5.3. Mexico
- 10.5.4. Rest of North America
- 10.6. Market Analysis, Insights and Forecast - by Europe
- 10.6.1. United Kingdom
- 10.6.2. Germany
- 10.6.3. France
- 10.6.4. Russia
- 10.6.5. Italy
- 10.6.6. Spain
- 10.6.7. Rest of Europe
- 10.7. Market Analysis, Insights and Forecast - by Asia-Pacific
- 10.7.1. India
- 10.7.2. China
- 10.7.3. Japan
- 10.7.4. Australia
- 10.7.5. Rest of Asia-Pacific
- 10.8. Market Analysis, Insights and Forecast - by South America
- 10.8.1. Brazil
- 10.8.2. Argentina
- 10.8.3. Rest of South America
- 10.9. Market Analysis, Insights and Forecast - by Middle-East and Africa
- 10.9.1. United Arab Emirates
- 10.9.2. South Africa
- 10.9.3. Rest of Middle-East and Africa
- 10.1. Market Analysis, Insights and Forecast - by Service Type
- 11. Asia Pacific Sustainable Catering Services Market Analysis, Insights and Forecast, 2020-2032
- 11.1. Market Analysis, Insights and Forecast - by Service Type
- 11.1.1. Contractual Catering Services
- 11.1.2. Non-Contractual Catering Services
- 11.1.3. Other Catering Services
- 11.2. Market Analysis, Insights and Forecast - by Event Type
- 11.2.1. Corporate
- 11.2.2. Wedding
- 11.2.3. Social Events
- 11.2.4. Others
- 11.3. Market Analysis, Insights and Forecast - by End-User
- 11.3.1. Individuals
- 11.3.2. Hospitality
- 11.3.3. Educational
- 11.3.4. Healthcare
- 11.3.5. In-Flight
- 11.3.6. Other End Users
- 11.4. Market Analysis, Insights and Forecast - by Geography
- 11.5. Market Analysis, Insights and Forecast - by North America
- 11.5.1. United States
- 11.5.2. Canada
- 11.5.3. Mexico
- 11.5.4. Rest of North America
- 11.6. Market Analysis, Insights and Forecast - by Europe
- 11.6.1. United Kingdom
- 11.6.2. Germany
- 11.6.3. France
- 11.6.4. Russia
- 11.6.5. Italy
- 11.6.6. Spain
- 11.6.7. Rest of Europe
- 11.7. Market Analysis, Insights and Forecast - by Asia-Pacific
- 11.7.1. India
- 11.7.2. China
- 11.7.3. Japan
- 11.7.4. Australia
- 11.7.5. Rest of Asia-Pacific
- 11.8. Market Analysis, Insights and Forecast - by South America
- 11.8.1. Brazil
- 11.8.2. Argentina
- 11.8.3. Rest of South America
- 11.9. Market Analysis, Insights and Forecast - by Middle-East and Africa
- 11.9.1. United Arab Emirates
- 11.9.2. South Africa
- 11.9.3. Rest of Middle-East and Africa
- 11.1. Market Analysis, Insights and Forecast - by Service Type
- 12. Competitive Analysis
- 12.1. Company Profiles
- 12.1.1 Dine Contract Catering**List Not Exhaustive
- 12.1.1.1. Company Overview
- 12.1.1.2. Products
- 12.1.1.3. Company Financials
- 12.1.1.4. SWOT Analysis
- 12.1.2 Aramark Corp
- 12.1.2.1. Company Overview
- 12.1.2.2. Products
- 12.1.2.3. Company Financials
- 12.1.2.4. SWOT Analysis
- 12.1.3 Emirates Flight Catering
- 12.1.3.1. Company Overview
- 12.1.3.2. Products
- 12.1.3.3. Company Financials
- 12.1.3.4. SWOT Analysis
- 12.1.4 Bartlett Mitchell Ltd
- 12.1.4.1. Company Overview
- 12.1.4.2. Products
- 12.1.4.3. Company Financials
- 12.1.4.4. SWOT Analysis
- 12.1.5 ISS A/S
- 12.1.5.1. Company Overview
- 12.1.5.2. Products
- 12.1.5.3. Company Financials
- 12.1.5.4. SWOT Analysis
- 12.1.6 Elior Group
- 12.1.6.1. Company Overview
- 12.1.6.2. Products
- 12.1.6.3. Company Financials
- 12.1.6.4. SWOT Analysis
- 12.1.7 Entier Limited
- 12.1.7.1. Company Overview
- 12.1.7.2. Products
- 12.1.7.3. Company Financials
- 12.1.7.4. SWOT Analysis
- 12.1.8 Compass Group PLC
- 12.1.8.1. Company Overview
- 12.1.8.2. Products
- 12.1.8.3. Company Financials
- 12.1.8.4. SWOT Analysis
- 12.1.9 DO & CO Aktiengesellschaft
- 12.1.9.1. Company Overview
- 12.1.9.2. Products
- 12.1.9.3. Company Financials
- 12.1.9.4. SWOT Analysis
- 12.1.10 CH and Co Catering Group Ltd
- 12.1.10.1. Company Overview
- 12.1.10.2. Products
- 12.1.10.3. Company Financials
- 12.1.10.4. SWOT Analysis
- 12.1.1 Dine Contract Catering**List Not Exhaustive
- 12.2. Market Entropy
- 12.2.1 Company's Key Areas Served
- 12.2.2 Recent Developments
- 12.3. Company Market Share Analysis 2025
- 12.3.1 Top 5 Companies Market Share Analysis
- 12.3.2 Top 3 Companies Market Share Analysis
- 12.4. List of Potential Customers
- 13. Research Methodology
List of Figures
- Figure 1: Global Sustainable Catering Services Market Revenue Breakdown (Million, %) by Region 2025 & 2033
- Figure 2: North America Sustainable Catering Services Market Revenue (Million), by Service Type 2025 & 2033
- Figure 3: North America Sustainable Catering Services Market Revenue Share (%), by Service Type 2025 & 2033
- Figure 4: North America Sustainable Catering Services Market Revenue (Million), by Event Type 2025 & 2033
- Figure 5: North America Sustainable Catering Services Market Revenue Share (%), by Event Type 2025 & 2033
- Figure 6: North America Sustainable Catering Services Market Revenue (Million), by End-User 2025 & 2033
- Figure 7: North America Sustainable Catering Services Market Revenue Share (%), by End-User 2025 & 2033
- Figure 8: North America Sustainable Catering Services Market Revenue (Million), by Geography 2025 & 2033
- Figure 9: North America Sustainable Catering Services Market Revenue Share (%), by Geography 2025 & 2033
- Figure 10: North America Sustainable Catering Services Market Revenue (Million), by North America 2025 & 2033
- Figure 11: North America Sustainable Catering Services Market Revenue Share (%), by North America 2025 & 2033
- Figure 12: North America Sustainable Catering Services Market Revenue (Million), by Europe 2025 & 2033
- Figure 13: North America Sustainable Catering Services Market Revenue Share (%), by Europe 2025 & 2033
- Figure 14: North America Sustainable Catering Services Market Revenue (Million), by Asia-Pacific 2025 & 2033
- Figure 15: North America Sustainable Catering Services Market Revenue Share (%), by Asia-Pacific 2025 & 2033
- Figure 16: North America Sustainable Catering Services Market Revenue (Million), by South America 2025 & 2033
- Figure 17: North America Sustainable Catering Services Market Revenue Share (%), by South America 2025 & 2033
- Figure 18: North America Sustainable Catering Services Market Revenue (Million), by Middle-East and Africa 2025 & 2033
- Figure 19: North America Sustainable Catering Services Market Revenue Share (%), by Middle-East and Africa 2025 & 2033
- Figure 20: North America Sustainable Catering Services Market Revenue (Million), by Country 2025 & 2033
- Figure 21: North America Sustainable Catering Services Market Revenue Share (%), by Country 2025 & 2033
- Figure 22: South America Sustainable Catering Services Market Revenue (Million), by Service Type 2025 & 2033
- Figure 23: South America Sustainable Catering Services Market Revenue Share (%), by Service Type 2025 & 2033
- Figure 24: South America Sustainable Catering Services Market Revenue (Million), by Event Type 2025 & 2033
- Figure 25: South America Sustainable Catering Services Market Revenue Share (%), by Event Type 2025 & 2033
- Figure 26: South America Sustainable Catering Services Market Revenue (Million), by End-User 2025 & 2033
- Figure 27: South America Sustainable Catering Services Market Revenue Share (%), by End-User 2025 & 2033
- Figure 28: South America Sustainable Catering Services Market Revenue (Million), by Geography 2025 & 2033
- Figure 29: South America Sustainable Catering Services Market Revenue Share (%), by Geography 2025 & 2033
- Figure 30: South America Sustainable Catering Services Market Revenue (Million), by North America 2025 & 2033
- Figure 31: South America Sustainable Catering Services Market Revenue Share (%), by North America 2025 & 2033
- Figure 32: South America Sustainable Catering Services Market Revenue (Million), by Europe 2025 & 2033
- Figure 33: South America Sustainable Catering Services Market Revenue Share (%), by Europe 2025 & 2033
- Figure 34: South America Sustainable Catering Services Market Revenue (Million), by Asia-Pacific 2025 & 2033
- Figure 35: South America Sustainable Catering Services Market Revenue Share (%), by Asia-Pacific 2025 & 2033
- Figure 36: South America Sustainable Catering Services Market Revenue (Million), by South America 2025 & 2033
- Figure 37: South America Sustainable Catering Services Market Revenue Share (%), by South America 2025 & 2033
- Figure 38: South America Sustainable Catering Services Market Revenue (Million), by Middle-East and Africa 2025 & 2033
- Figure 39: South America Sustainable Catering Services Market Revenue Share (%), by Middle-East and Africa 2025 & 2033
- Figure 40: South America Sustainable Catering Services Market Revenue (Million), by Country 2025 & 2033
- Figure 41: South America Sustainable Catering Services Market Revenue Share (%), by Country 2025 & 2033
- Figure 42: Europe Sustainable Catering Services Market Revenue (Million), by Service Type 2025 & 2033
- Figure 43: Europe Sustainable Catering Services Market Revenue Share (%), by Service Type 2025 & 2033
- Figure 44: Europe Sustainable Catering Services Market Revenue (Million), by Event Type 2025 & 2033
- Figure 45: Europe Sustainable Catering Services Market Revenue Share (%), by Event Type 2025 & 2033
- Figure 46: Europe Sustainable Catering Services Market Revenue (Million), by End-User 2025 & 2033
- Figure 47: Europe Sustainable Catering Services Market Revenue Share (%), by End-User 2025 & 2033
- Figure 48: Europe Sustainable Catering Services Market Revenue (Million), by Geography 2025 & 2033
- Figure 49: Europe Sustainable Catering Services Market Revenue Share (%), by Geography 2025 & 2033
- Figure 50: Europe Sustainable Catering Services Market Revenue (Million), by North America 2025 & 2033
- Figure 51: Europe Sustainable Catering Services Market Revenue Share (%), by North America 2025 & 2033
- Figure 52: Europe Sustainable Catering Services Market Revenue (Million), by Europe 2025 & 2033
- Figure 53: Europe Sustainable Catering Services Market Revenue Share (%), by Europe 2025 & 2033
- Figure 54: Europe Sustainable Catering Services Market Revenue (Million), by Asia-Pacific 2025 & 2033
- Figure 55: Europe Sustainable Catering Services Market Revenue Share (%), by Asia-Pacific 2025 & 2033
- Figure 56: Europe Sustainable Catering Services Market Revenue (Million), by South America 2025 & 2033
- Figure 57: Europe Sustainable Catering Services Market Revenue Share (%), by South America 2025 & 2033
- Figure 58: Europe Sustainable Catering Services Market Revenue (Million), by Middle-East and Africa 2025 & 2033
- Figure 59: Europe Sustainable Catering Services Market Revenue Share (%), by Middle-East and Africa 2025 & 2033
- Figure 60: Europe Sustainable Catering Services Market Revenue (Million), by Country 2025 & 2033
- Figure 61: Europe Sustainable Catering Services Market Revenue Share (%), by Country 2025 & 2033
- Figure 62: Middle East & Africa Sustainable Catering Services Market Revenue (Million), by Service Type 2025 & 2033
- Figure 63: Middle East & Africa Sustainable Catering Services Market Revenue Share (%), by Service Type 2025 & 2033
- Figure 64: Middle East & Africa Sustainable Catering Services Market Revenue (Million), by Event Type 2025 & 2033
- Figure 65: Middle East & Africa Sustainable Catering Services Market Revenue Share (%), by Event Type 2025 & 2033
- Figure 66: Middle East & Africa Sustainable Catering Services Market Revenue (Million), by End-User 2025 & 2033
- Figure 67: Middle East & Africa Sustainable Catering Services Market Revenue Share (%), by End-User 2025 & 2033
- Figure 68: Middle East & Africa Sustainable Catering Services Market Revenue (Million), by Geography 2025 & 2033
- Figure 69: Middle East & Africa Sustainable Catering Services Market Revenue Share (%), by Geography 2025 & 2033
- Figure 70: Middle East & Africa Sustainable Catering Services Market Revenue (Million), by North America 2025 & 2033
- Figure 71: Middle East & Africa Sustainable Catering Services Market Revenue Share (%), by North America 2025 & 2033
- Figure 72: Middle East & Africa Sustainable Catering Services Market Revenue (Million), by Europe 2025 & 2033
- Figure 73: Middle East & Africa Sustainable Catering Services Market Revenue Share (%), by Europe 2025 & 2033
- Figure 74: Middle East & Africa Sustainable Catering Services Market Revenue (Million), by Asia-Pacific 2025 & 2033
- Figure 75: Middle East & Africa Sustainable Catering Services Market Revenue Share (%), by Asia-Pacific 2025 & 2033
- Figure 76: Middle East & Africa Sustainable Catering Services Market Revenue (Million), by South America 2025 & 2033
- Figure 77: Middle East & Africa Sustainable Catering Services Market Revenue Share (%), by South America 2025 & 2033
- Figure 78: Middle East & Africa Sustainable Catering Services Market Revenue (Million), by Middle-East and Africa 2025 & 2033
- Figure 79: Middle East & Africa Sustainable Catering Services Market Revenue Share (%), by Middle-East and Africa 2025 & 2033
- Figure 80: Middle East & Africa Sustainable Catering Services Market Revenue (Million), by Country 2025 & 2033
- Figure 81: Middle East & Africa Sustainable Catering Services Market Revenue Share (%), by Country 2025 & 2033
- Figure 82: Asia Pacific Sustainable Catering Services Market Revenue (Million), by Service Type 2025 & 2033
- Figure 83: Asia Pacific Sustainable Catering Services Market Revenue Share (%), by Service Type 2025 & 2033
- Figure 84: Asia Pacific Sustainable Catering Services Market Revenue (Million), by Event Type 2025 & 2033
- Figure 85: Asia Pacific Sustainable Catering Services Market Revenue Share (%), by Event Type 2025 & 2033
- Figure 86: Asia Pacific Sustainable Catering Services Market Revenue (Million), by End-User 2025 & 2033
- Figure 87: Asia Pacific Sustainable Catering Services Market Revenue Share (%), by End-User 2025 & 2033
- Figure 88: Asia Pacific Sustainable Catering Services Market Revenue (Million), by Geography 2025 & 2033
- Figure 89: Asia Pacific Sustainable Catering Services Market Revenue Share (%), by Geography 2025 & 2033
- Figure 90: Asia Pacific Sustainable Catering Services Market Revenue (Million), by North America 2025 & 2033
- Figure 91: Asia Pacific Sustainable Catering Services Market Revenue Share (%), by North America 2025 & 2033
- Figure 92: Asia Pacific Sustainable Catering Services Market Revenue (Million), by Europe 2025 & 2033
- Figure 93: Asia Pacific Sustainable Catering Services Market Revenue Share (%), by Europe 2025 & 2033
- Figure 94: Asia Pacific Sustainable Catering Services Market Revenue (Million), by Asia-Pacific 2025 & 2033
- Figure 95: Asia Pacific Sustainable Catering Services Market Revenue Share (%), by Asia-Pacific 2025 & 2033
- Figure 96: Asia Pacific Sustainable Catering Services Market Revenue (Million), by South America 2025 & 2033
- Figure 97: Asia Pacific Sustainable Catering Services Market Revenue Share (%), by South America 2025 & 2033
- Figure 98: Asia Pacific Sustainable Catering Services Market Revenue (Million), by Middle-East and Africa 2025 & 2033
- Figure 99: Asia Pacific Sustainable Catering Services Market Revenue Share (%), by Middle-East and Africa 2025 & 2033
- Figure 100: Asia Pacific Sustainable Catering Services Market Revenue (Million), by Country 2025 & 2033
- Figure 101: Asia Pacific Sustainable Catering Services Market Revenue Share (%), by Country 2025 & 2033
List of Tables
- Table 1: Global Sustainable Catering Services Market Revenue Million Forecast, by Service Type 2020 & 2033
- Table 2: Global Sustainable Catering Services Market Revenue Million Forecast, by Event Type 2020 & 2033
- Table 3: Global Sustainable Catering Services Market Revenue Million Forecast, by End-User 2020 & 2033
- Table 4: Global Sustainable Catering Services Market Revenue Million Forecast, by Geography 2020 & 2033
- Table 5: Global Sustainable Catering Services Market Revenue Million Forecast, by North America 2020 & 2033
- Table 6: Global Sustainable Catering Services Market Revenue Million Forecast, by Europe 2020 & 2033
- Table 7: Global Sustainable Catering Services Market Revenue Million Forecast, by Asia-Pacific 2020 & 2033
- Table 8: Global Sustainable Catering Services Market Revenue Million Forecast, by South America 2020 & 2033
- Table 9: Global Sustainable Catering Services Market Revenue Million Forecast, by Middle-East and Africa 2020 & 2033
- Table 10: Global Sustainable Catering Services Market Revenue Million Forecast, by Region 2020 & 2033
- Table 11: Global Sustainable Catering Services Market Revenue Million Forecast, by Service Type 2020 & 2033
- Table 12: Global Sustainable Catering Services Market Revenue Million Forecast, by Event Type 2020 & 2033
- Table 13: Global Sustainable Catering Services Market Revenue Million Forecast, by End-User 2020 & 2033
- Table 14: Global Sustainable Catering Services Market Revenue Million Forecast, by Geography 2020 & 2033
- Table 15: Global Sustainable Catering Services Market Revenue Million Forecast, by North America 2020 & 2033
- Table 16: Global Sustainable Catering Services Market Revenue Million Forecast, by Europe 2020 & 2033
- Table 17: Global Sustainable Catering Services Market Revenue Million Forecast, by Asia-Pacific 2020 & 2033
- Table 18: Global Sustainable Catering Services Market Revenue Million Forecast, by South America 2020 & 2033
- Table 19: Global Sustainable Catering Services Market Revenue Million Forecast, by Middle-East and Africa 2020 & 2033
- Table 20: Global Sustainable Catering Services Market Revenue Million Forecast, by Country 2020 & 2033
- Table 21: United States Sustainable Catering Services Market Revenue (Million) Forecast, by Application 2020 & 2033
- Table 22: Canada Sustainable Catering Services Market Revenue (Million) Forecast, by Application 2020 & 2033
- Table 23: Mexico Sustainable Catering Services Market Revenue (Million) Forecast, by Application 2020 & 2033
- Table 24: Global Sustainable Catering Services Market Revenue Million Forecast, by Service Type 2020 & 2033
- Table 25: Global Sustainable Catering Services Market Revenue Million Forecast, by Event Type 2020 & 2033
- Table 26: Global Sustainable Catering Services Market Revenue Million Forecast, by End-User 2020 & 2033
- Table 27: Global Sustainable Catering Services Market Revenue Million Forecast, by Geography 2020 & 2033
- Table 28: Global Sustainable Catering Services Market Revenue Million Forecast, by North America 2020 & 2033
- Table 29: Global Sustainable Catering Services Market Revenue Million Forecast, by Europe 2020 & 2033
- Table 30: Global Sustainable Catering Services Market Revenue Million Forecast, by Asia-Pacific 2020 & 2033
- Table 31: Global Sustainable Catering Services Market Revenue Million Forecast, by South America 2020 & 2033
- Table 32: Global Sustainable Catering Services Market Revenue Million Forecast, by Middle-East and Africa 2020 & 2033
- Table 33: Global Sustainable Catering Services Market Revenue Million Forecast, by Country 2020 & 2033
- Table 34: Brazil Sustainable Catering Services Market Revenue (Million) Forecast, by Application 2020 & 2033
- Table 35: Argentina Sustainable Catering Services Market Revenue (Million) Forecast, by Application 2020 & 2033
- Table 36: Rest of South America Sustainable Catering Services Market Revenue (Million) Forecast, by Application 2020 & 2033
- Table 37: Global Sustainable Catering Services Market Revenue Million Forecast, by Service Type 2020 & 2033
- Table 38: Global Sustainable Catering Services Market Revenue Million Forecast, by Event Type 2020 & 2033
- Table 39: Global Sustainable Catering Services Market Revenue Million Forecast, by End-User 2020 & 2033
- Table 40: Global Sustainable Catering Services Market Revenue Million Forecast, by Geography 2020 & 2033
- Table 41: Global Sustainable Catering Services Market Revenue Million Forecast, by North America 2020 & 2033
- Table 42: Global Sustainable Catering Services Market Revenue Million Forecast, by Europe 2020 & 2033
- Table 43: Global Sustainable Catering Services Market Revenue Million Forecast, by Asia-Pacific 2020 & 2033
- Table 44: Global Sustainable Catering Services Market Revenue Million Forecast, by South America 2020 & 2033
- Table 45: Global Sustainable Catering Services Market Revenue Million Forecast, by Middle-East and Africa 2020 & 2033
- Table 46: Global Sustainable Catering Services Market Revenue Million Forecast, by Country 2020 & 2033
- Table 47: United Kingdom Sustainable Catering Services Market Revenue (Million) Forecast, by Application 2020 & 2033
- Table 48: Germany Sustainable Catering Services Market Revenue (Million) Forecast, by Application 2020 & 2033
- Table 49: France Sustainable Catering Services Market Revenue (Million) Forecast, by Application 2020 & 2033
- Table 50: Italy Sustainable Catering Services Market Revenue (Million) Forecast, by Application 2020 & 2033
- Table 51: Spain Sustainable Catering Services Market Revenue (Million) Forecast, by Application 2020 & 2033
- Table 52: Russia Sustainable Catering Services Market Revenue (Million) Forecast, by Application 2020 & 2033
- Table 53: Benelux Sustainable Catering Services Market Revenue (Million) Forecast, by Application 2020 & 2033
- Table 54: Nordics Sustainable Catering Services Market Revenue (Million) Forecast, by Application 2020 & 2033
- Table 55: Rest of Europe Sustainable Catering Services Market Revenue (Million) Forecast, by Application 2020 & 2033
- Table 56: Global Sustainable Catering Services Market Revenue Million Forecast, by Service Type 2020 & 2033
- Table 57: Global Sustainable Catering Services Market Revenue Million Forecast, by Event Type 2020 & 2033
- Table 58: Global Sustainable Catering Services Market Revenue Million Forecast, by End-User 2020 & 2033
- Table 59: Global Sustainable Catering Services Market Revenue Million Forecast, by Geography 2020 & 2033
- Table 60: Global Sustainable Catering Services Market Revenue Million Forecast, by North America 2020 & 2033
- Table 61: Global Sustainable Catering Services Market Revenue Million Forecast, by Europe 2020 & 2033
- Table 62: Global Sustainable Catering Services Market Revenue Million Forecast, by Asia-Pacific 2020 & 2033
- Table 63: Global Sustainable Catering Services Market Revenue Million Forecast, by South America 2020 & 2033
- Table 64: Global Sustainable Catering Services Market Revenue Million Forecast, by Middle-East and Africa 2020 & 2033
- Table 65: Global Sustainable Catering Services Market Revenue Million Forecast, by Country 2020 & 2033
- Table 66: Turkey Sustainable Catering Services Market Revenue (Million) Forecast, by Application 2020 & 2033
- Table 67: Israel Sustainable Catering Services Market Revenue (Million) Forecast, by Application 2020 & 2033
- Table 68: GCC Sustainable Catering Services Market Revenue (Million) Forecast, by Application 2020 & 2033
- Table 69: North Africa Sustainable Catering Services Market Revenue (Million) Forecast, by Application 2020 & 2033
- Table 70: South Africa Sustainable Catering Services Market Revenue (Million) Forecast, by Application 2020 & 2033
- Table 71: Rest of Middle East & Africa Sustainable Catering Services Market Revenue (Million) Forecast, by Application 2020 & 2033
- Table 72: Global Sustainable Catering Services Market Revenue Million Forecast, by Service Type 2020 & 2033
- Table 73: Global Sustainable Catering Services Market Revenue Million Forecast, by Event Type 2020 & 2033
- Table 74: Global Sustainable Catering Services Market Revenue Million Forecast, by End-User 2020 & 2033
- Table 75: Global Sustainable Catering Services Market Revenue Million Forecast, by Geography 2020 & 2033
- Table 76: Global Sustainable Catering Services Market Revenue Million Forecast, by North America 2020 & 2033
- Table 77: Global Sustainable Catering Services Market Revenue Million Forecast, by Europe 2020 & 2033
- Table 78: Global Sustainable Catering Services Market Revenue Million Forecast, by Asia-Pacific 2020 & 2033
- Table 79: Global Sustainable Catering Services Market Revenue Million Forecast, by South America 2020 & 2033
- Table 80: Global Sustainable Catering Services Market Revenue Million Forecast, by Middle-East and Africa 2020 & 2033
- Table 81: Global Sustainable Catering Services Market Revenue Million Forecast, by Country 2020 & 2033
- Table 82: China Sustainable Catering Services Market Revenue (Million) Forecast, by Application 2020 & 2033
- Table 83: India Sustainable Catering Services Market Revenue (Million) Forecast, by Application 2020 & 2033
- Table 84: Japan Sustainable Catering Services Market Revenue (Million) Forecast, by Application 2020 & 2033
- Table 85: South Korea Sustainable Catering Services Market Revenue (Million) Forecast, by Application 2020 & 2033
- Table 86: ASEAN Sustainable Catering Services Market Revenue (Million) Forecast, by Application 2020 & 2033
- Table 87: Oceania Sustainable Catering Services Market Revenue (Million) Forecast, by Application 2020 & 2033
- Table 88: Rest of Asia Pacific Sustainable Catering Services Market Revenue (Million) Forecast, by Application 2020 & 2033
Frequently Asked Questions
1. What is the projected Compound Annual Growth Rate (CAGR) of the Sustainable Catering Services Market?
The projected CAGR is approximately 2.33%.
2. Which companies are prominent players in the Sustainable Catering Services Market?
Key companies in the market include Dine Contract Catering**List Not Exhaustive, Aramark Corp, Emirates Flight Catering, Bartlett Mitchell Ltd, ISS A/S, Elior Group, Entier Limited, Compass Group PLC, DO & CO Aktiengesellschaft, CH and Co Catering Group Ltd.
3. What are the main segments of the Sustainable Catering Services Market?
The market segments include Service Type, Event Type, End-User, Geography, North America, Europe, Asia-Pacific, South America, Middle-East and Africa.
4. Can you provide details about the market size?
The market size is estimated to be USD 115.13 Million as of 2022.
5. What are some drivers contributing to market growth?
Increasing Trend of Outsourcing Food Services; Growing Popularity of Social Events.
6. What are the notable trends driving market growth?
Rise in Demand for Organic Food.
7. Are there any restraints impacting market growth?
Challenges in Sourcing Organic and Local Ingredients; Limited Consumer Awareness and Understanding of Sustainable Catering Practices.
8. Can you provide examples of recent developments in the market?
In January 2024, Compass Group PLC, a leading global food service company, acquired CH&CO, a premium contract and hospitality service provider in the UK and Ireland, for an initial enterprise value of GBP 475 Million (USD 600 Million).
9. What pricing options are available for accessing the report?
Pricing options include single-user, multi-user, and enterprise licenses priced at USD 3800, USD 4500, and USD 5800 respectively.
10. Is the market size provided in terms of value or volume?
The market size is provided in terms of value, measured in Million.
11. Are there any specific market keywords associated with the report?
Yes, the market keyword associated with the report is "Sustainable Catering Services Market," which aids in identifying and referencing the specific market segment covered.
12. How do I determine which pricing option suits my needs best?
The pricing options vary based on user requirements and access needs. Individual users may opt for single-user licenses, while businesses requiring broader access may choose multi-user or enterprise licenses for cost-effective access to the report.
13. Are there any additional resources or data provided in the Sustainable Catering Services Market report?
While the report offers comprehensive insights, it's advisable to review the specific contents or supplementary materials provided to ascertain if additional resources or data are available.
14. How can I stay updated on further developments or reports in the Sustainable Catering Services Market?
To stay informed about further developments, trends, and reports in the Sustainable Catering Services Market, consider subscribing to industry newsletters, following relevant companies and organizations, or regularly checking reputable industry news sources and publications.
Methodology
Step 1 - Identification of Relevant Samples Size from Population Database


Step 2 - Approaches for Defining Global Market Size (Value, Volume* & Price*)

Note*: In applicable scenarios
Step 3 - Data Sources
Primary Research
- Web Analytics
- Survey Reports
- Research Institute
- Latest Research Reports
- Opinion Leaders
Secondary Research
- Annual Reports
- White Paper
- Latest Press Release
- Industry Association
- Paid Database
- Investor Presentations

Step 4 - Data Triangulation
Involves using different sources of information in order to increase the validity of a study
These sources are likely to be stakeholders in a program - participants, other researchers, program staff, other community members, and so on.
Then we put all data in single framework & apply various statistical tools to find out the dynamic on the market.
During the analysis stage, feedback from the stakeholder groups would be compared to determine areas of agreement as well as areas of divergence