

Key Insights
The global table dishwasher market is experiencing robust growth, driven by increasing urbanization, rising disposable incomes, and a shift towards convenient and time-saving kitchen appliances. The market, estimated at $5 billion in 2025, is projected to grow at a Compound Annual Growth Rate (CAGR) of 8% from 2025 to 2033, reaching approximately $9 billion by 2033. This expansion is fueled by several key factors, including the increasing popularity of smaller, space-saving appliances among apartment dwellers and young professionals, coupled with heightened awareness of hygiene and sanitation. Technological advancements, such as improved water efficiency and quieter operation, are also contributing to market growth. The market is segmented by type (built-in vs. countertop), capacity, and features (e.g., drying technology, wash cycles). Leading brands such as Bosch, Panasonic, Haier, and Midea hold significant market share, employing aggressive marketing strategies and continuous product innovation to maintain competitiveness. However, challenges remain, including the relatively higher cost compared to traditional dishwashing methods and competition from other kitchen appliance segments.
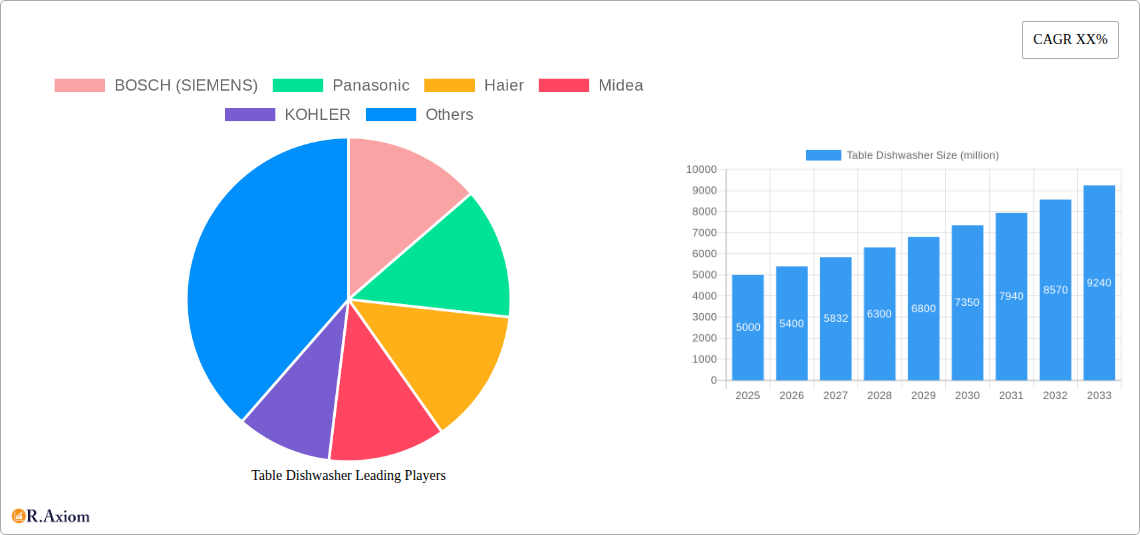
Table Dishwasher Market Size (In Billion)
Despite the growth trajectory, restraints such as the high initial investment cost for consumers and the comparatively smaller capacity compared to larger dishwashers pose challenges. The market is witnessing notable trends such as the integration of smart features (connectivity, remote control) and eco-friendly designs to enhance user experience and sustainability. Regional variations exist, with North America and Europe maintaining leading positions due to high adoption rates and strong consumer preferences for convenient appliances. Asia-Pacific, however, is demonstrating high growth potential driven by rising middle-class populations and increasing demand for modern kitchen appliances. The competitive landscape is dynamic, with both established players and emerging brands vying for market share through product differentiation and strategic partnerships. This creates opportunities for innovation and growth across the entire value chain.
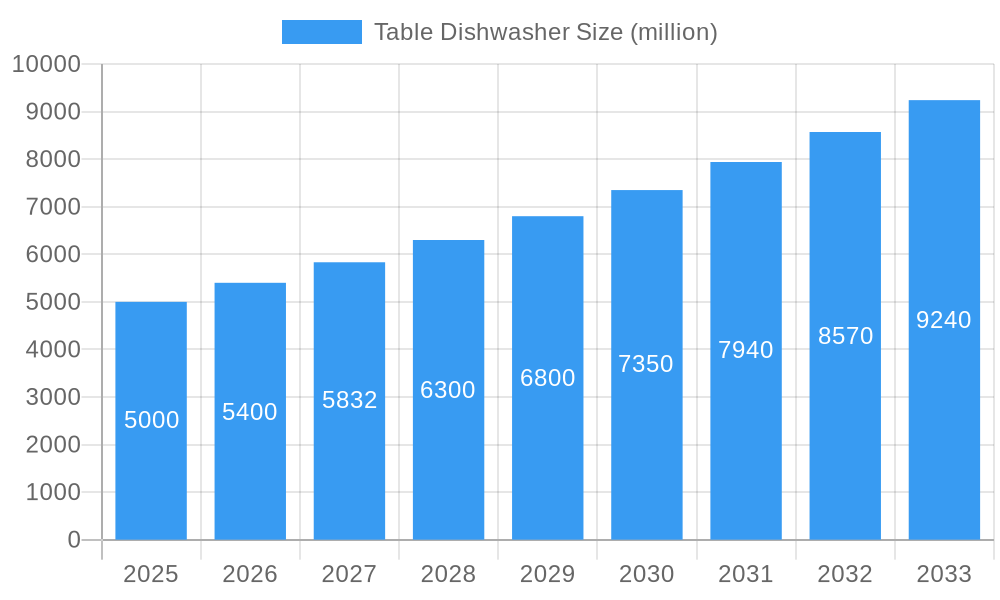
Table Dishwasher Company Market Share
This comprehensive report provides a detailed analysis of the global table dishwasher market, offering actionable insights for industry stakeholders. The study covers the period from 2019 to 2033, with a focus on the forecast period of 2025-2033. The base year for this analysis is 2025. The report is valued at $xx million and projects a market size of $xx million by 2033. The report incorporates data from multiple sources, including company financials, industry publications and market research databases to generate detailed forecasts and a holistic market overview. This report is designed for investors, manufacturers, distributors, and anyone seeking to understand the evolving table dishwasher landscape.
Table Dishwasher Market Concentration & Innovation
This section analyzes the competitive landscape of the table dishwasher market, focusing on market concentration, innovation drivers, regulatory frameworks, product substitutes, end-user trends, and mergers and acquisitions (M&A) activities. The market is moderately concentrated, with the top five players—BOSCH (SIEMENS), Panasonic, Haier, Midea, and KOHLER—holding an estimated 60% market share in 2025. Innovation is driven by factors such as increasing consumer demand for energy-efficient and space-saving appliances, as well as technological advancements in water filtration and drying systems. Stringent energy efficiency regulations in several regions are shaping product development and influencing the market. Major competitive pressures stem from the availability of affordable countertop dishwashers and other cleaning alternatives like manual dishwashing.
- Market Share (2025): BOSCH (SIEMENS) - 18%; Panasonic - 15%; Haier - 12%; Midea - 10%; KOHLER - 5%; Others - 40%
- M&A Activity (2019-2024): A total of xx M&A deals valued at $xx million were observed in the period, primarily focused on strengthening supply chains and expanding market reach.
- Key Innovation Drivers: Energy efficiency standards, smart home integration, advanced cleaning technologies, compact designs.
Table Dishwasher Industry Trends & Insights
The global table dishwasher market exhibits robust growth, driven by urbanization, rising disposable incomes, and changing lifestyles. The market is witnessing a CAGR of xx% during the forecast period (2025-2033). Technological disruptions, including the introduction of smart features and advanced cleaning technologies, are significantly impacting consumer preferences. The increasing popularity of compact and energy-efficient models caters to space-constrained urban households. Intense competition among established players and emerging brands is driving innovation and price reductions. Market penetration in developing economies remains relatively low, presenting significant growth opportunities.
- CAGR (2025-2033): xx%
- Market Penetration (2025): xx% in developed countries; xx% in developing countries
Dominant Markets & Segments in Table Dishwasher
The North American market holds a significant share of the global table dishwasher market. This dominance is driven by high levels of disposable income, robust infrastructure, and strong consumer preference for convenient home appliances. Europe also represents a considerable market, although growth is slightly slower due to the already high market penetration. Asia Pacific shows the fastest growth rate, fueled by rapidly rising middle-class incomes and urbanization.
Key Drivers of Market Dominance in North America:
- High disposable incomes
- Well-established retail infrastructure
- Strong consumer preference for convenience appliances
- Stringent energy efficiency regulations driving innovation
Dominance Analysis: North America's dominance is largely attributed to high consumer adoption and established distribution networks. While the Asia-Pacific region displays faster growth, it still lags in terms of overall market size due to factors such as lower average incomes in certain markets and less developed retail infrastructure in some areas.
Table Dishwasher Product Developments
Recent product innovations focus on enhancing cleaning performance, energy efficiency, and user experience. Manufacturers are incorporating advanced technologies like smart controls, improved water filtration systems, and quieter operation. The introduction of compact models targets space-constrained urban dwellings. Manufacturers are also emphasizing eco-friendly features to appeal to environmentally conscious consumers. These improvements enhance competitive advantages by attracting a wider range of customers.
Report Scope & Segmentation Analysis
This report segments the table dishwasher market based on capacity (e.g., 6-place, 8-place, 12-place), type (e.g., built-in, freestanding, portable), technology (e.g., spray arm, ultrasonic), and region (e.g., North America, Europe, Asia-Pacific, MEA, South America). Growth projections vary across segments, with the compact models showing especially rapid growth due to their suitability for small kitchens and apartments. Competitive intensity differs across regions, with more established markets in North America and Europe experiencing higher competition.
Key Drivers of Table Dishwasher Growth
Several factors drive the growth of the table dishwasher market:
- Rising disposable incomes: Increased purchasing power allows consumers in developing and developed markets to invest in more appliances.
- Technological advancements: Innovations like energy-efficient designs, smart features, and improved cleaning systems enhance product appeal.
- Urbanization: Growing urban populations increase demand for space-saving appliances, fostering the growth of compact table dishwashers.
- Changing lifestyles: Busier lifestyles emphasize convenience, making dishwashers increasingly attractive.
Challenges in the Table Dishwasher Sector
The table dishwasher sector faces several challenges:
- High initial cost: The relatively high price of table dishwashers can deter some consumers, especially in price-sensitive markets.
- Supply chain disruptions: Global supply chain uncertainties can affect the availability of components and impact production.
- Intense competition: The presence of many players results in price wars and pressure on profit margins.
Emerging Opportunities in Table Dishwasher
The table dishwasher market presents several exciting opportunities:
- Expansion into developing markets: Untapped potential exists in developing economies with rising middle classes.
- Smart home integration: Integrating table dishwashers with smart home ecosystems can broaden their appeal to tech-savvy consumers.
- Subscription models: Offering dishwasher services on a subscription basis can improve accessibility for consumers.
Leading Players in the Table Dishwasher Market
- BOSCH (SIEMENS)
- Panasonic
- Haier
- Midea
- KOHLER
- Westinghouse
- Hyundai
- ROBAM
- Xiaomi
- Vatti
- Human Touch
- Joyoung
- GREE
- Hisense
- Sacon
- Bear
Key Developments in Table Dishwasher Industry
- 2022 Q4: BOSCH (SIEMENS) launched a new range of energy-efficient table dishwashers.
- 2023 Q1: Panasonic introduced a smart table dishwasher with Wi-Fi connectivity.
- 2023 Q3: Haier acquired a smaller table dishwasher manufacturer, expanding its market share. (Further details on acquisition values would need to be added based on available data.)
Strategic Outlook for Table Dishwasher Market
The table dishwasher market is poised for continued growth, driven by ongoing technological advancements, expanding consumer demand, and penetration into new markets. Opportunities exist in developing innovative features, focusing on sustainability, and expanding distribution networks in emerging economies. Companies focusing on energy efficiency, smart features, and attractive designs will be well-positioned for success in this dynamic market.
Table Dishwasher Segmentation
-
1. Application
- 1.1. Store
- 1.2. Online
-
2. Types
- 2.1. 4 Sets
- 2.2. 5 Sets
- 2.3. 6 Sets
- 2.4. Others
Table Dishwasher Segmentation By Geography
-
1. North America
- 1.1. United States
- 1.2. Canada
- 1.3. Mexico
-
2. South America
- 2.1. Brazil
- 2.2. Argentina
- 2.3. Rest of South America
-
3. Europe
- 3.1. United Kingdom
- 3.2. Germany
- 3.3. France
- 3.4. Italy
- 3.5. Spain
- 3.6. Russia
- 3.7. Benelux
- 3.8. Nordics
- 3.9. Rest of Europe
-
4. Middle East & Africa
- 4.1. Turkey
- 4.2. Israel
- 4.3. GCC
- 4.4. North Africa
- 4.5. South Africa
- 4.6. Rest of Middle East & Africa
-
5. Asia Pacific
- 5.1. China
- 5.2. India
- 5.3. Japan
- 5.4. South Korea
- 5.5. ASEAN
- 5.6. Oceania
- 5.7. Rest of Asia Pacific

Table Dishwasher Regional Market Share
Geographic Coverage of Table Dishwasher
Table Dishwasher REPORT HIGHLIGHTS
| Aspects | Details |
|---|---|
| Study Period | 2020-2034 |
| Base Year | 2025 |
| Estimated Year | 2026 |
| Forecast Period | 2026-2034 |
| Historical Period | 2020-2025 |
| Growth Rate | CAGR of XX% from 2020-2034 |
| Segmentation |
|
Table of Contents
- 1. Introduction
- 1.1. Research Scope
- 1.2. Market Segmentation
- 1.3. Research Methodology
- 1.4. Definitions and Assumptions
- 2. Executive Summary
- 2.1. Introduction
- 3. Market Dynamics
- 3.1. Introduction
- 3.2. Market Drivers
- 3.3. Market Restrains
- 3.4. Market Trends
- 4. Market Factor Analysis
- 4.1. Porters Five Forces
- 4.2. Supply/Value Chain
- 4.3. PESTEL analysis
- 4.4. Market Entropy
- 4.5. Patent/Trademark Analysis
- 5. Global Table Dishwasher Analysis, Insights and Forecast, 2020-2032
- 5.1. Market Analysis, Insights and Forecast - by Application
- 5.1.1. Store
- 5.1.2. Online
- 5.2. Market Analysis, Insights and Forecast - by Types
- 5.2.1. 4 Sets
- 5.2.2. 5 Sets
- 5.2.3. 6 Sets
- 5.2.4. Others
- 5.3. Market Analysis, Insights and Forecast - by Region
- 5.3.1. North America
- 5.3.2. South America
- 5.3.3. Europe
- 5.3.4. Middle East & Africa
- 5.3.5. Asia Pacific
- 5.1. Market Analysis, Insights and Forecast - by Application
- 6. North America Table Dishwasher Analysis, Insights and Forecast, 2020-2032
- 6.1. Market Analysis, Insights and Forecast - by Application
- 6.1.1. Store
- 6.1.2. Online
- 6.2. Market Analysis, Insights and Forecast - by Types
- 6.2.1. 4 Sets
- 6.2.2. 5 Sets
- 6.2.3. 6 Sets
- 6.2.4. Others
- 6.1. Market Analysis, Insights and Forecast - by Application
- 7. South America Table Dishwasher Analysis, Insights and Forecast, 2020-2032
- 7.1. Market Analysis, Insights and Forecast - by Application
- 7.1.1. Store
- 7.1.2. Online
- 7.2. Market Analysis, Insights and Forecast - by Types
- 7.2.1. 4 Sets
- 7.2.2. 5 Sets
- 7.2.3. 6 Sets
- 7.2.4. Others
- 7.1. Market Analysis, Insights and Forecast - by Application
- 8. Europe Table Dishwasher Analysis, Insights and Forecast, 2020-2032
- 8.1. Market Analysis, Insights and Forecast - by Application
- 8.1.1. Store
- 8.1.2. Online
- 8.2. Market Analysis, Insights and Forecast - by Types
- 8.2.1. 4 Sets
- 8.2.2. 5 Sets
- 8.2.3. 6 Sets
- 8.2.4. Others
- 8.1. Market Analysis, Insights and Forecast - by Application
- 9. Middle East & Africa Table Dishwasher Analysis, Insights and Forecast, 2020-2032
- 9.1. Market Analysis, Insights and Forecast - by Application
- 9.1.1. Store
- 9.1.2. Online
- 9.2. Market Analysis, Insights and Forecast - by Types
- 9.2.1. 4 Sets
- 9.2.2. 5 Sets
- 9.2.3. 6 Sets
- 9.2.4. Others
- 9.1. Market Analysis, Insights and Forecast - by Application
- 10. Asia Pacific Table Dishwasher Analysis, Insights and Forecast, 2020-2032
- 10.1. Market Analysis, Insights and Forecast - by Application
- 10.1.1. Store
- 10.1.2. Online
- 10.2. Market Analysis, Insights and Forecast - by Types
- 10.2.1. 4 Sets
- 10.2.2. 5 Sets
- 10.2.3. 6 Sets
- 10.2.4. Others
- 10.1. Market Analysis, Insights and Forecast - by Application
- 11. Competitive Analysis
- 11.1. Global Market Share Analysis 2025
- 11.2. Company Profiles
- 11.2.1 BOSCH (SIEMENS)
- 11.2.1.1. Overview
- 11.2.1.2. Products
- 11.2.1.3. SWOT Analysis
- 11.2.1.4. Recent Developments
- 11.2.1.5. Financials (Based on Availability)
- 11.2.2 Panasonic
- 11.2.2.1. Overview
- 11.2.2.2. Products
- 11.2.2.3. SWOT Analysis
- 11.2.2.4. Recent Developments
- 11.2.2.5. Financials (Based on Availability)
- 11.2.3 Haier
- 11.2.3.1. Overview
- 11.2.3.2. Products
- 11.2.3.3. SWOT Analysis
- 11.2.3.4. Recent Developments
- 11.2.3.5. Financials (Based on Availability)
- 11.2.4 Midea
- 11.2.4.1. Overview
- 11.2.4.2. Products
- 11.2.4.3. SWOT Analysis
- 11.2.4.4. Recent Developments
- 11.2.4.5. Financials (Based on Availability)
- 11.2.5 KOHLER
- 11.2.5.1. Overview
- 11.2.5.2. Products
- 11.2.5.3. SWOT Analysis
- 11.2.5.4. Recent Developments
- 11.2.5.5. Financials (Based on Availability)
- 11.2.6 Westinghouse
- 11.2.6.1. Overview
- 11.2.6.2. Products
- 11.2.6.3. SWOT Analysis
- 11.2.6.4. Recent Developments
- 11.2.6.5. Financials (Based on Availability)
- 11.2.7 Hyundai
- 11.2.7.1. Overview
- 11.2.7.2. Products
- 11.2.7.3. SWOT Analysis
- 11.2.7.4. Recent Developments
- 11.2.7.5. Financials (Based on Availability)
- 11.2.8 ROBAM
- 11.2.8.1. Overview
- 11.2.8.2. Products
- 11.2.8.3. SWOT Analysis
- 11.2.8.4. Recent Developments
- 11.2.8.5. Financials (Based on Availability)
- 11.2.9 Xiaomi
- 11.2.9.1. Overview
- 11.2.9.2. Products
- 11.2.9.3. SWOT Analysis
- 11.2.9.4. Recent Developments
- 11.2.9.5. Financials (Based on Availability)
- 11.2.10 Vatti
- 11.2.10.1. Overview
- 11.2.10.2. Products
- 11.2.10.3. SWOT Analysis
- 11.2.10.4. Recent Developments
- 11.2.10.5. Financials (Based on Availability)
- 11.2.11 Human Touch
- 11.2.11.1. Overview
- 11.2.11.2. Products
- 11.2.11.3. SWOT Analysis
- 11.2.11.4. Recent Developments
- 11.2.11.5. Financials (Based on Availability)
- 11.2.12 Joyoung
- 11.2.12.1. Overview
- 11.2.12.2. Products
- 11.2.12.3. SWOT Analysis
- 11.2.12.4. Recent Developments
- 11.2.12.5. Financials (Based on Availability)
- 11.2.13 GREE
- 11.2.13.1. Overview
- 11.2.13.2. Products
- 11.2.13.3. SWOT Analysis
- 11.2.13.4. Recent Developments
- 11.2.13.5. Financials (Based on Availability)
- 11.2.14 Hisense
- 11.2.14.1. Overview
- 11.2.14.2. Products
- 11.2.14.3. SWOT Analysis
- 11.2.14.4. Recent Developments
- 11.2.14.5. Financials (Based on Availability)
- 11.2.15 Sacon
- 11.2.15.1. Overview
- 11.2.15.2. Products
- 11.2.15.3. SWOT Analysis
- 11.2.15.4. Recent Developments
- 11.2.15.5. Financials (Based on Availability)
- 11.2.16 Bear
- 11.2.16.1. Overview
- 11.2.16.2. Products
- 11.2.16.3. SWOT Analysis
- 11.2.16.4. Recent Developments
- 11.2.16.5. Financials (Based on Availability)
- 11.2.1 BOSCH (SIEMENS)
List of Figures
- Figure 1: Global Table Dishwasher Revenue Breakdown (million, %) by Region 2025 & 2033
- Figure 2: Global Table Dishwasher Volume Breakdown (K, %) by Region 2025 & 2033
- Figure 3: North America Table Dishwasher Revenue (million), by Application 2025 & 2033
- Figure 4: North America Table Dishwasher Volume (K), by Application 2025 & 2033
- Figure 5: North America Table Dishwasher Revenue Share (%), by Application 2025 & 2033
- Figure 6: North America Table Dishwasher Volume Share (%), by Application 2025 & 2033
- Figure 7: North America Table Dishwasher Revenue (million), by Types 2025 & 2033
- Figure 8: North America Table Dishwasher Volume (K), by Types 2025 & 2033
- Figure 9: North America Table Dishwasher Revenue Share (%), by Types 2025 & 2033
- Figure 10: North America Table Dishwasher Volume Share (%), by Types 2025 & 2033
- Figure 11: North America Table Dishwasher Revenue (million), by Country 2025 & 2033
- Figure 12: North America Table Dishwasher Volume (K), by Country 2025 & 2033
- Figure 13: North America Table Dishwasher Revenue Share (%), by Country 2025 & 2033
- Figure 14: North America Table Dishwasher Volume Share (%), by Country 2025 & 2033
- Figure 15: South America Table Dishwasher Revenue (million), by Application 2025 & 2033
- Figure 16: South America Table Dishwasher Volume (K), by Application 2025 & 2033
- Figure 17: South America Table Dishwasher Revenue Share (%), by Application 2025 & 2033
- Figure 18: South America Table Dishwasher Volume Share (%), by Application 2025 & 2033
- Figure 19: South America Table Dishwasher Revenue (million), by Types 2025 & 2033
- Figure 20: South America Table Dishwasher Volume (K), by Types 2025 & 2033
- Figure 21: South America Table Dishwasher Revenue Share (%), by Types 2025 & 2033
- Figure 22: South America Table Dishwasher Volume Share (%), by Types 2025 & 2033
- Figure 23: South America Table Dishwasher Revenue (million), by Country 2025 & 2033
- Figure 24: South America Table Dishwasher Volume (K), by Country 2025 & 2033
- Figure 25: South America Table Dishwasher Revenue Share (%), by Country 2025 & 2033
- Figure 26: South America Table Dishwasher Volume Share (%), by Country 2025 & 2033
- Figure 27: Europe Table Dishwasher Revenue (million), by Application 2025 & 2033
- Figure 28: Europe Table Dishwasher Volume (K), by Application 2025 & 2033
- Figure 29: Europe Table Dishwasher Revenue Share (%), by Application 2025 & 2033
- Figure 30: Europe Table Dishwasher Volume Share (%), by Application 2025 & 2033
- Figure 31: Europe Table Dishwasher Revenue (million), by Types 2025 & 2033
- Figure 32: Europe Table Dishwasher Volume (K), by Types 2025 & 2033
- Figure 33: Europe Table Dishwasher Revenue Share (%), by Types 2025 & 2033
- Figure 34: Europe Table Dishwasher Volume Share (%), by Types 2025 & 2033
- Figure 35: Europe Table Dishwasher Revenue (million), by Country 2025 & 2033
- Figure 36: Europe Table Dishwasher Volume (K), by Country 2025 & 2033
- Figure 37: Europe Table Dishwasher Revenue Share (%), by Country 2025 & 2033
- Figure 38: Europe Table Dishwasher Volume Share (%), by Country 2025 & 2033
- Figure 39: Middle East & Africa Table Dishwasher Revenue (million), by Application 2025 & 2033
- Figure 40: Middle East & Africa Table Dishwasher Volume (K), by Application 2025 & 2033
- Figure 41: Middle East & Africa Table Dishwasher Revenue Share (%), by Application 2025 & 2033
- Figure 42: Middle East & Africa Table Dishwasher Volume Share (%), by Application 2025 & 2033
- Figure 43: Middle East & Africa Table Dishwasher Revenue (million), by Types 2025 & 2033
- Figure 44: Middle East & Africa Table Dishwasher Volume (K), by Types 2025 & 2033
- Figure 45: Middle East & Africa Table Dishwasher Revenue Share (%), by Types 2025 & 2033
- Figure 46: Middle East & Africa Table Dishwasher Volume Share (%), by Types 2025 & 2033
- Figure 47: Middle East & Africa Table Dishwasher Revenue (million), by Country 2025 & 2033
- Figure 48: Middle East & Africa Table Dishwasher Volume (K), by Country 2025 & 2033
- Figure 49: Middle East & Africa Table Dishwasher Revenue Share (%), by Country 2025 & 2033
- Figure 50: Middle East & Africa Table Dishwasher Volume Share (%), by Country 2025 & 2033
- Figure 51: Asia Pacific Table Dishwasher Revenue (million), by Application 2025 & 2033
- Figure 52: Asia Pacific Table Dishwasher Volume (K), by Application 2025 & 2033
- Figure 53: Asia Pacific Table Dishwasher Revenue Share (%), by Application 2025 & 2033
- Figure 54: Asia Pacific Table Dishwasher Volume Share (%), by Application 2025 & 2033
- Figure 55: Asia Pacific Table Dishwasher Revenue (million), by Types 2025 & 2033
- Figure 56: Asia Pacific Table Dishwasher Volume (K), by Types 2025 & 2033
- Figure 57: Asia Pacific Table Dishwasher Revenue Share (%), by Types 2025 & 2033
- Figure 58: Asia Pacific Table Dishwasher Volume Share (%), by Types 2025 & 2033
- Figure 59: Asia Pacific Table Dishwasher Revenue (million), by Country 2025 & 2033
- Figure 60: Asia Pacific Table Dishwasher Volume (K), by Country 2025 & 2033
- Figure 61: Asia Pacific Table Dishwasher Revenue Share (%), by Country 2025 & 2033
- Figure 62: Asia Pacific Table Dishwasher Volume Share (%), by Country 2025 & 2033
List of Tables
- Table 1: Global Table Dishwasher Revenue million Forecast, by Application 2020 & 2033
- Table 2: Global Table Dishwasher Volume K Forecast, by Application 2020 & 2033
- Table 3: Global Table Dishwasher Revenue million Forecast, by Types 2020 & 2033
- Table 4: Global Table Dishwasher Volume K Forecast, by Types 2020 & 2033
- Table 5: Global Table Dishwasher Revenue million Forecast, by Region 2020 & 2033
- Table 6: Global Table Dishwasher Volume K Forecast, by Region 2020 & 2033
- Table 7: Global Table Dishwasher Revenue million Forecast, by Application 2020 & 2033
- Table 8: Global Table Dishwasher Volume K Forecast, by Application 2020 & 2033
- Table 9: Global Table Dishwasher Revenue million Forecast, by Types 2020 & 2033
- Table 10: Global Table Dishwasher Volume K Forecast, by Types 2020 & 2033
- Table 11: Global Table Dishwasher Revenue million Forecast, by Country 2020 & 2033
- Table 12: Global Table Dishwasher Volume K Forecast, by Country 2020 & 2033
- Table 13: United States Table Dishwasher Revenue (million) Forecast, by Application 2020 & 2033
- Table 14: United States Table Dishwasher Volume (K) Forecast, by Application 2020 & 2033
- Table 15: Canada Table Dishwasher Revenue (million) Forecast, by Application 2020 & 2033
- Table 16: Canada Table Dishwasher Volume (K) Forecast, by Application 2020 & 2033
- Table 17: Mexico Table Dishwasher Revenue (million) Forecast, by Application 2020 & 2033
- Table 18: Mexico Table Dishwasher Volume (K) Forecast, by Application 2020 & 2033
- Table 19: Global Table Dishwasher Revenue million Forecast, by Application 2020 & 2033
- Table 20: Global Table Dishwasher Volume K Forecast, by Application 2020 & 2033
- Table 21: Global Table Dishwasher Revenue million Forecast, by Types 2020 & 2033
- Table 22: Global Table Dishwasher Volume K Forecast, by Types 2020 & 2033
- Table 23: Global Table Dishwasher Revenue million Forecast, by Country 2020 & 2033
- Table 24: Global Table Dishwasher Volume K Forecast, by Country 2020 & 2033
- Table 25: Brazil Table Dishwasher Revenue (million) Forecast, by Application 2020 & 2033
- Table 26: Brazil Table Dishwasher Volume (K) Forecast, by Application 2020 & 2033
- Table 27: Argentina Table Dishwasher Revenue (million) Forecast, by Application 2020 & 2033
- Table 28: Argentina Table Dishwasher Volume (K) Forecast, by Application 2020 & 2033
- Table 29: Rest of South America Table Dishwasher Revenue (million) Forecast, by Application 2020 & 2033
- Table 30: Rest of South America Table Dishwasher Volume (K) Forecast, by Application 2020 & 2033
- Table 31: Global Table Dishwasher Revenue million Forecast, by Application 2020 & 2033
- Table 32: Global Table Dishwasher Volume K Forecast, by Application 2020 & 2033
- Table 33: Global Table Dishwasher Revenue million Forecast, by Types 2020 & 2033
- Table 34: Global Table Dishwasher Volume K Forecast, by Types 2020 & 2033
- Table 35: Global Table Dishwasher Revenue million Forecast, by Country 2020 & 2033
- Table 36: Global Table Dishwasher Volume K Forecast, by Country 2020 & 2033
- Table 37: United Kingdom Table Dishwasher Revenue (million) Forecast, by Application 2020 & 2033
- Table 38: United Kingdom Table Dishwasher Volume (K) Forecast, by Application 2020 & 2033
- Table 39: Germany Table Dishwasher Revenue (million) Forecast, by Application 2020 & 2033
- Table 40: Germany Table Dishwasher Volume (K) Forecast, by Application 2020 & 2033
- Table 41: France Table Dishwasher Revenue (million) Forecast, by Application 2020 & 2033
- Table 42: France Table Dishwasher Volume (K) Forecast, by Application 2020 & 2033
- Table 43: Italy Table Dishwasher Revenue (million) Forecast, by Application 2020 & 2033
- Table 44: Italy Table Dishwasher Volume (K) Forecast, by Application 2020 & 2033
- Table 45: Spain Table Dishwasher Revenue (million) Forecast, by Application 2020 & 2033
- Table 46: Spain Table Dishwasher Volume (K) Forecast, by Application 2020 & 2033
- Table 47: Russia Table Dishwasher Revenue (million) Forecast, by Application 2020 & 2033
- Table 48: Russia Table Dishwasher Volume (K) Forecast, by Application 2020 & 2033
- Table 49: Benelux Table Dishwasher Revenue (million) Forecast, by Application 2020 & 2033
- Table 50: Benelux Table Dishwasher Volume (K) Forecast, by Application 2020 & 2033
- Table 51: Nordics Table Dishwasher Revenue (million) Forecast, by Application 2020 & 2033
- Table 52: Nordics Table Dishwasher Volume (K) Forecast, by Application 2020 & 2033
- Table 53: Rest of Europe Table Dishwasher Revenue (million) Forecast, by Application 2020 & 2033
- Table 54: Rest of Europe Table Dishwasher Volume (K) Forecast, by Application 2020 & 2033
- Table 55: Global Table Dishwasher Revenue million Forecast, by Application 2020 & 2033
- Table 56: Global Table Dishwasher Volume K Forecast, by Application 2020 & 2033
- Table 57: Global Table Dishwasher Revenue million Forecast, by Types 2020 & 2033
- Table 58: Global Table Dishwasher Volume K Forecast, by Types 2020 & 2033
- Table 59: Global Table Dishwasher Revenue million Forecast, by Country 2020 & 2033
- Table 60: Global Table Dishwasher Volume K Forecast, by Country 2020 & 2033
- Table 61: Turkey Table Dishwasher Revenue (million) Forecast, by Application 2020 & 2033
- Table 62: Turkey Table Dishwasher Volume (K) Forecast, by Application 2020 & 2033
- Table 63: Israel Table Dishwasher Revenue (million) Forecast, by Application 2020 & 2033
- Table 64: Israel Table Dishwasher Volume (K) Forecast, by Application 2020 & 2033
- Table 65: GCC Table Dishwasher Revenue (million) Forecast, by Application 2020 & 2033
- Table 66: GCC Table Dishwasher Volume (K) Forecast, by Application 2020 & 2033
- Table 67: North Africa Table Dishwasher Revenue (million) Forecast, by Application 2020 & 2033
- Table 68: North Africa Table Dishwasher Volume (K) Forecast, by Application 2020 & 2033
- Table 69: South Africa Table Dishwasher Revenue (million) Forecast, by Application 2020 & 2033
- Table 70: South Africa Table Dishwasher Volume (K) Forecast, by Application 2020 & 2033
- Table 71: Rest of Middle East & Africa Table Dishwasher Revenue (million) Forecast, by Application 2020 & 2033
- Table 72: Rest of Middle East & Africa Table Dishwasher Volume (K) Forecast, by Application 2020 & 2033
- Table 73: Global Table Dishwasher Revenue million Forecast, by Application 2020 & 2033
- Table 74: Global Table Dishwasher Volume K Forecast, by Application 2020 & 2033
- Table 75: Global Table Dishwasher Revenue million Forecast, by Types 2020 & 2033
- Table 76: Global Table Dishwasher Volume K Forecast, by Types 2020 & 2033
- Table 77: Global Table Dishwasher Revenue million Forecast, by Country 2020 & 2033
- Table 78: Global Table Dishwasher Volume K Forecast, by Country 2020 & 2033
- Table 79: China Table Dishwasher Revenue (million) Forecast, by Application 2020 & 2033
- Table 80: China Table Dishwasher Volume (K) Forecast, by Application 2020 & 2033
- Table 81: India Table Dishwasher Revenue (million) Forecast, by Application 2020 & 2033
- Table 82: India Table Dishwasher Volume (K) Forecast, by Application 2020 & 2033
- Table 83: Japan Table Dishwasher Revenue (million) Forecast, by Application 2020 & 2033
- Table 84: Japan Table Dishwasher Volume (K) Forecast, by Application 2020 & 2033
- Table 85: South Korea Table Dishwasher Revenue (million) Forecast, by Application 2020 & 2033
- Table 86: South Korea Table Dishwasher Volume (K) Forecast, by Application 2020 & 2033
- Table 87: ASEAN Table Dishwasher Revenue (million) Forecast, by Application 2020 & 2033
- Table 88: ASEAN Table Dishwasher Volume (K) Forecast, by Application 2020 & 2033
- Table 89: Oceania Table Dishwasher Revenue (million) Forecast, by Application 2020 & 2033
- Table 90: Oceania Table Dishwasher Volume (K) Forecast, by Application 2020 & 2033
- Table 91: Rest of Asia Pacific Table Dishwasher Revenue (million) Forecast, by Application 2020 & 2033
- Table 92: Rest of Asia Pacific Table Dishwasher Volume (K) Forecast, by Application 2020 & 2033
Frequently Asked Questions
1. What is the projected Compound Annual Growth Rate (CAGR) of the Table Dishwasher?
The projected CAGR is approximately XX%.
2. Which companies are prominent players in the Table Dishwasher?
Key companies in the market include BOSCH (SIEMENS), Panasonic, Haier, Midea, KOHLER, Westinghouse, Hyundai, ROBAM, Xiaomi, Vatti, Human Touch, Joyoung, GREE, Hisense, Sacon, Bear.
3. What are the main segments of the Table Dishwasher?
The market segments include Application, Types.
4. Can you provide details about the market size?
The market size is estimated to be USD XXX million as of 2022.
5. What are some drivers contributing to market growth?
N/A
6. What are the notable trends driving market growth?
N/A
7. Are there any restraints impacting market growth?
N/A
8. Can you provide examples of recent developments in the market?
N/A
9. What pricing options are available for accessing the report?
Pricing options include single-user, multi-user, and enterprise licenses priced at USD 3350.00, USD 5025.00, and USD 6700.00 respectively.
10. Is the market size provided in terms of value or volume?
The market size is provided in terms of value, measured in million and volume, measured in K.
11. Are there any specific market keywords associated with the report?
Yes, the market keyword associated with the report is "Table Dishwasher," which aids in identifying and referencing the specific market segment covered.
12. How do I determine which pricing option suits my needs best?
The pricing options vary based on user requirements and access needs. Individual users may opt for single-user licenses, while businesses requiring broader access may choose multi-user or enterprise licenses for cost-effective access to the report.
13. Are there any additional resources or data provided in the Table Dishwasher report?
While the report offers comprehensive insights, it's advisable to review the specific contents or supplementary materials provided to ascertain if additional resources or data are available.
14. How can I stay updated on further developments or reports in the Table Dishwasher?
To stay informed about further developments, trends, and reports in the Table Dishwasher, consider subscribing to industry newsletters, following relevant companies and organizations, or regularly checking reputable industry news sources and publications.
Methodology
Step 1 - Identification of Relevant Samples Size from Population Database


Step 2 - Approaches for Defining Global Market Size (Value, Volume* & Price*)

Note*: In applicable scenarios
Step 3 - Data Sources
Primary Research
- Web Analytics
- Survey Reports
- Research Institute
- Latest Research Reports
- Opinion Leaders
Secondary Research
- Annual Reports
- White Paper
- Latest Press Release
- Industry Association
- Paid Database
- Investor Presentations

Step 4 - Data Triangulation
Involves using different sources of information in order to increase the validity of a study
These sources are likely to be stakeholders in a program - participants, other researchers, program staff, other community members, and so on.
Then we put all data in single framework & apply various statistical tools to find out the dynamic on the market.
During the analysis stage, feedback from the stakeholder groups would be compared to determine areas of agreement as well as areas of divergence