Tartaric Acid Industry Market’s Growth Catalysts

Tartaric Acid Industry by Type (Natural Tartaric Acid, Synthetic Tartaric Acid), by Application (Preservative and Additive, Laxative, Intermediate, Other Applications), by End-user Industry (Food and Beverage, Pharmaceutical, Cosmetics, Construction, Other End-user Industries), by Asia Pacific (China, India, Japan, South Korea, Rest of Asia Pacific), by North America (United States, Canada, Mexico), by Europe (Germany, United Kingdom, France, Italy, Spain, Rest of Europe), by South America (Brazil, Argentina, Rest of South America), by Middle East and Africa (Saudi Arabia, South Africa, Rest of Middle East and Africa) Forecast 2025-2033

Aug 8 2025
Base Year: 2024

180 Pages
Main Logo

Tartaric Acid Industry Market’s Growth Catalysts


Home
Industries
Chemicals & Materials
sponsor image
sponsor image
sponsor image
sponsor image

Tailored for you

  • In-depth Analysis Tailored to Specified Regions or Segments
  • Company Profiles Customized to User Preferences
  • Comprehensive Insights Focused on Specific Segments or Regions
  • Customized Evaluation of Competitive Landscape to Meet Your Needs
  • Tailored Customization to Address Other Specific Requirements
Ask for customization


Key Insights

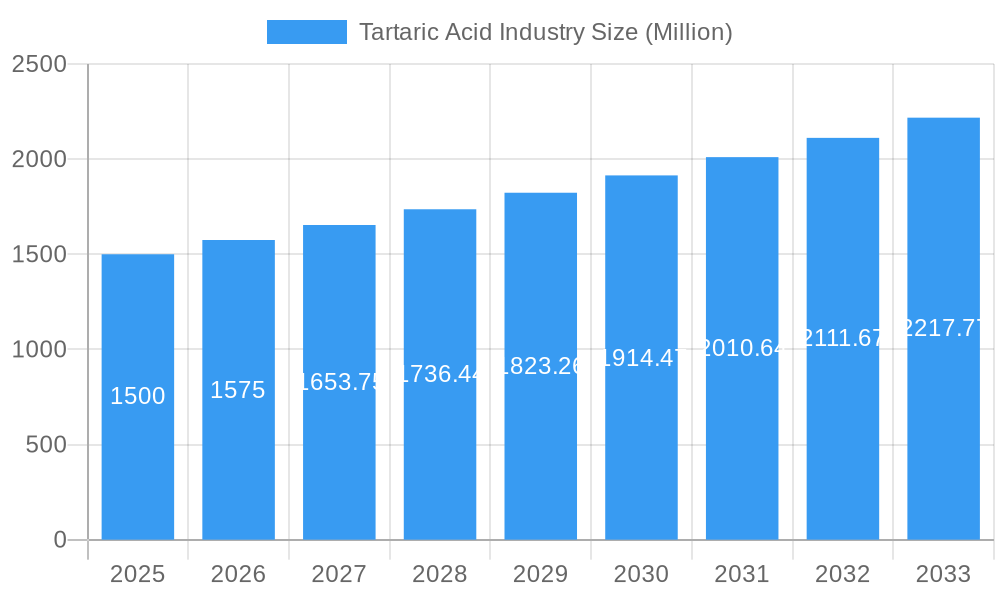
The global tartaric acid market, valued at approximately $XX million in 2025, is experiencing robust growth, projected to expand at a CAGR exceeding 5.00% from 2025 to 2033. This growth is fueled by increasing demand from the food and beverage industry, particularly in the production of beverages and confectionery where tartaric acid acts as a crucial preservative, flavor enhancer, and acidity regulator. The pharmaceutical sector also contributes significantly, leveraging tartaric acid's properties in drug formulation and as a chiral building block for pharmaceuticals. Furthermore, rising demand from the cosmetics industry, for applications in skincare and haircare products, is bolstering market expansion. The market is segmented by application (preservative & additive, laxative, intermediate, other), end-user industry (food & beverage, pharmaceutical, cosmetics, construction, other), and type (natural, synthetic). The natural tartaric acid segment is anticipated to hold a larger market share due to growing consumer preference for natural ingredients, although synthetic tartaric acid provides a cost-effective alternative. Geographical distribution reveals a strong presence across diverse regions, with Asia Pacific (particularly China and India) expected to dominate due to rapidly growing food and beverage sectors and expanding pharmaceutical industries. North America and Europe, however, maintain significant market shares, driven by established industries and high consumer spending. Key players like Omkar Speciality Chemicals, Changmao Biochemical, and others are actively shaping market competition through strategic expansions, capacity increases, and innovative product offerings. Competitive dynamics are likely to intensify with mergers and acquisitions, and the introduction of new technologies aiming to improve production efficiency and sustainability.

Growth in the tartaric acid market is not without challenges. Fluctuations in raw material prices, primarily grapes, which is a major source of natural tartaric acid, can impact production costs and profitability. Stringent regulatory standards and environmental concerns related to the manufacturing process also pose limitations. However, ongoing research and development efforts focused on sustainable production methods, coupled with expanding applications in various industries, are expected to mitigate these challenges and drive continued market growth throughout the forecast period. The market's trajectory will be heavily influenced by factors such as evolving consumer preferences for natural and healthier products, advancements in pharmaceutical technologies, and shifts in global economic conditions. A detailed analysis of these factors would be essential for businesses seeking optimal strategies for market penetration and growth within this dynamic sector.
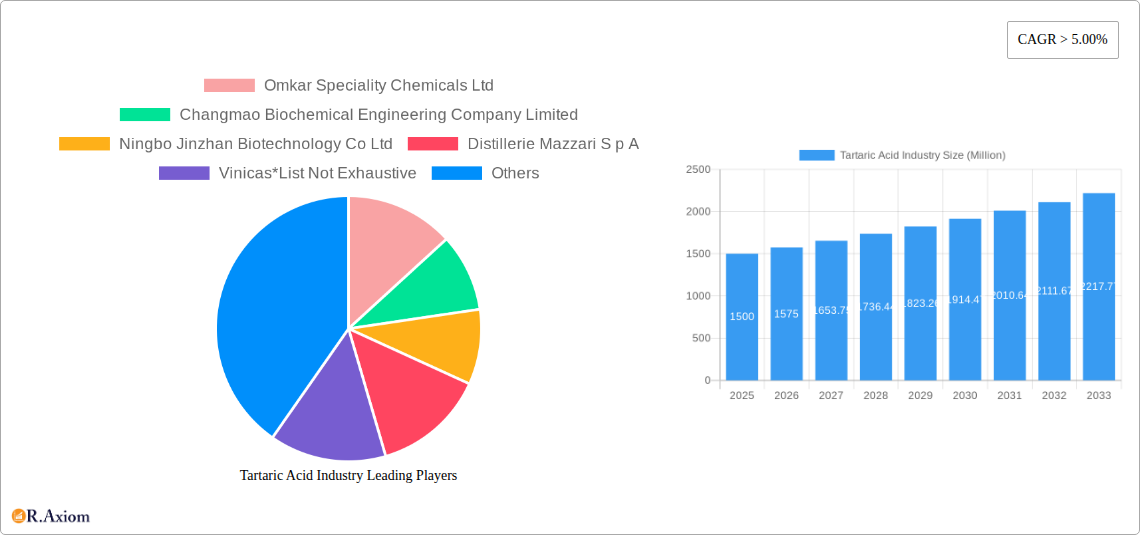
Tartaric Acid Industry Research Report - Market Size, Growth & Forecast

Tartaric Acid Industry: A Comprehensive Market Report (2019-2033)

This detailed report provides a comprehensive analysis of the global tartaric acid industry, covering market size, growth drivers, challenges, and key players. The study period spans from 2019 to 2033, with 2025 serving as the base and estimated year. The report offers actionable insights for industry stakeholders, including manufacturers, suppliers, and investors.

Tartaric Acid Industry Market Concentration & Innovation

The global tartaric acid market exhibits a moderately concentrated structure, with several key players holding significant market share. While precise market share figures for each company require further research and are not included here (xx%), the industry is characterized by both established multinational corporations and regional players. Innovation in the tartaric acid market is driven by the increasing demand for natural and sustainable ingredients across various end-use industries. This is pushing companies to invest in advanced extraction and purification techniques for natural tartaric acid, and explore new applications. Regulatory frameworks, particularly regarding food safety and additives, significantly impact market dynamics. The presence of substitute chemicals (e.g., citric acid) necessitates continuous innovation to maintain competitive advantages. End-user trends towards healthier and more natural products fuel demand for natural tartaric acid, prompting companies to strengthen their supply chains and enhance their product portfolio. M&A activities within the industry, while not extensively documented in publicly available data (xx Million in total deal value from xx deals in the last 5 years), are expected to consolidate market share and drive innovation.

  • Key Market Concentration Metrics: xx% market share held by top 5 players (estimated).
  • Innovation Drivers: Demand for natural ingredients, sustainable sourcing, regulatory compliance.
  • Regulatory Frameworks: Vary by region, impacting production and labeling.
  • Product Substitutes: Citric acid, malic acid.
  • End-user Trends: Growing preference for natural and healthy products.
  • M&A Activities: Consolidation expected, but data limited (xx Million in estimated total deal value).

Tartaric Acid Industry Industry Trends & Insights

The tartaric acid market is experiencing robust growth, driven by increasing demand from the food and beverage, pharmaceutical, and cosmetics industries. The estimated CAGR for the forecast period (2025-2033) is xx%, with market penetration increasing across diverse applications. Technological disruptions, such as advancements in extraction and purification methods, are improving efficiency and reducing costs. Consumer preferences are shifting towards natural and organic products, boosting the demand for natural tartaric acid. Competitive dynamics are characterized by both price competition and product differentiation, with companies focusing on product quality, sustainability, and innovation to gain market share. Emerging applications in new sectors are expanding the market potential. The growing awareness of health and wellness among consumers is creating a positive impact on the market growth.

Tartaric Acid Industry Growth

Dominant Markets & Segments in Tartaric Acid Industry

The food and beverage industry is the dominant end-user segment for tartaric acid, followed by the pharmaceutical sector. Within applications, the use of tartaric acid as a preservative and additive holds the largest market share. Natural tartaric acid accounts for a significant portion of the overall market, driven by the growing consumer preference for natural ingredients.

  • Dominant Region: Europe (due to significant wine production and established manufacturing base).
  • Dominant Country: Italy (due to its extensive wine industry).
  • Dominant Application Segment: Preservative and Additive.
  • Dominant End-user Industry: Food and Beverage.
  • Dominant Type: Natural Tartaric Acid.

Key Drivers for Dominant Segments:

  • Food and Beverage: Demand for leavening agents, acidity regulators, and stabilizers.
  • Pharmaceutical: Use as an excipient in drug formulations.
  • Natural Tartaric Acid: Consumer preference for natural ingredients, stricter regulations.

Tartaric Acid Industry Product Developments

Recent product innovations focus on enhancing the purity and quality of tartaric acid, optimizing extraction processes, and expanding into novel applications. Companies are exploring the use of tartaric acid derivatives in specialized food products and pharmaceutical formulations. This aligns with the overall market trend towards high-quality, sustainable, and versatile ingredients. The focus on improving efficiency and reducing the environmental impact of production processes is also prominent.

Report Scope & Segmentation Analysis

This report segments the tartaric acid market based on application (Preservative and Additive, Laxative, Intermediate, Other Applications), end-user industry (Food and Beverage, Pharmaceutical, Cosmetics, Construction, Other End-user Industries), and type (Natural Tartaric Acid, Synthetic Tartaric Acid). Each segment is analyzed in detail, including market size, growth projections, and competitive dynamics. Growth projections for each segment vary depending on market conditions, consumer demand, and technological developments.

Application: Each application shows varying growth rates depending on specific market needs and technological advancements.

End-user Industry: Growth across end-user industries is uneven depending on market trends and regulatory landscape.

Type: Natural Tartaric Acid growth is favored by consumer preferences while synthetic tartaric acid remains a cost-effective solution.

Key Drivers of Tartaric Acid Industry Growth

The tartaric acid market is propelled by several key factors, including increasing demand from the food and beverage industry, rising consumer preference for natural ingredients, and the expanding applications in pharmaceuticals and cosmetics. Technological advancements in extraction and purification methods are also enhancing efficiency and reducing costs. Favorable government policies supporting the use of natural additives in food products further stimulate growth.

Challenges in the Tartaric Acid Industry Sector

The tartaric acid industry faces challenges including fluctuating raw material prices, stringent regulatory requirements, and intense competition. Supply chain disruptions can impact production and availability, affecting market stability. Environmental regulations related to waste management can also pose challenges to manufacturers. The presence of substitute chemicals, such as citric acid, creates competitive pressures.

Emerging Opportunities in Tartaric Acid Industry

Emerging opportunities lie in expanding into new markets, developing innovative applications in specialized food products and pharmaceuticals, and exploring sustainable sourcing and production methods. The growing demand for natural and organic ingredients presents significant growth potential. Investing in research and development to explore new applications and enhance product quality is crucial for companies seeking market expansion.

Leading Players in the Tartaric Acid Industry Market

  • Omkar Speciality Chemicals Ltd
  • Changmao Biochemical Engineering Company Limited
  • Ningbo Jinzhan Biotechnology Co Ltd
  • Distillerie Mazzari S p A
  • Vinicas
  • The Tartaric Chemicals Corporation
  • Giovanni Randi SpA
  • Tarac Technologies
  • Anhui Hailan Bio-technology Co ltd
  • AUSTRALIAN TARTARIC PRODUCTS
  • Dastech International Inc
  • Derivados Vínicos S A
  • Tártaros Gonzalo Castelló
  • ATP Group
  • Industria Chimica Valenzana I C V SpA

Key Developments in Tartaric Acid Industry Industry

  • [Month, Year]: Company X launched a new, sustainable tartaric acid production process. This impacted the market by lowering production costs and boosting supply.
  • [Month, Year]: Company Y announced a major expansion of its tartaric acid production facility, increasing its market share and capacity. This had a significant impact on market supply and pricing.
  • [Month, Year]: A new regulation was implemented in Country Z regarding the use of tartaric acid in food products, influencing market demand. This affected the market’s regulatory landscape and demand for certified products.
  • (Note: Further details on specific key developments require additional research and will be included in the final report.)

Strategic Outlook for Tartaric Acid Industry Market

The tartaric acid market is poised for continued growth driven by increasing demand, product innovation, and expanding applications. Companies that invest in research and development, sustainable production methods, and strategic partnerships will be well-positioned to capitalize on future market opportunities. Focus on natural ingredients, improved purity and quality, and a commitment to meeting evolving consumer preferences will be crucial for maintaining and expanding market share.

Tartaric Acid Industry Segmentation

  • 1. Type
    • 1.1. Natural Tartaric Acid
    • 1.2. Synthetic Tartaric Acid
  • 2. Application
    • 2.1. Preservative and Additive
    • 2.2. Laxative
    • 2.3. Intermediate
    • 2.4. Other Applications
  • 3. End-user Industry
    • 3.1. Food and Beverage
    • 3.2. Pharmaceutical
    • 3.3. Cosmetics
    • 3.4. Construction
    • 3.5. Other End-user Industries

Tartaric Acid Industry Segmentation By Geography

  • 1. Asia Pacific
    • 1.1. China
    • 1.2. India
    • 1.3. Japan
    • 1.4. South Korea
    • 1.5. Rest of Asia Pacific
  • 2. North America
    • 2.1. United States
    • 2.2. Canada
    • 2.3. Mexico
  • 3. Europe
    • 3.1. Germany
    • 3.2. United Kingdom
    • 3.3. France
    • 3.4. Italy
    • 3.5. Spain
    • 3.6. Rest of Europe
  • 4. South America
    • 4.1. Brazil
    • 4.2. Argentina
    • 4.3. Rest of South America
  • 5. Middle East and Africa
    • 5.1. Saudi Arabia
    • 5.2. South Africa
    • 5.3. Rest of Middle East and Africa
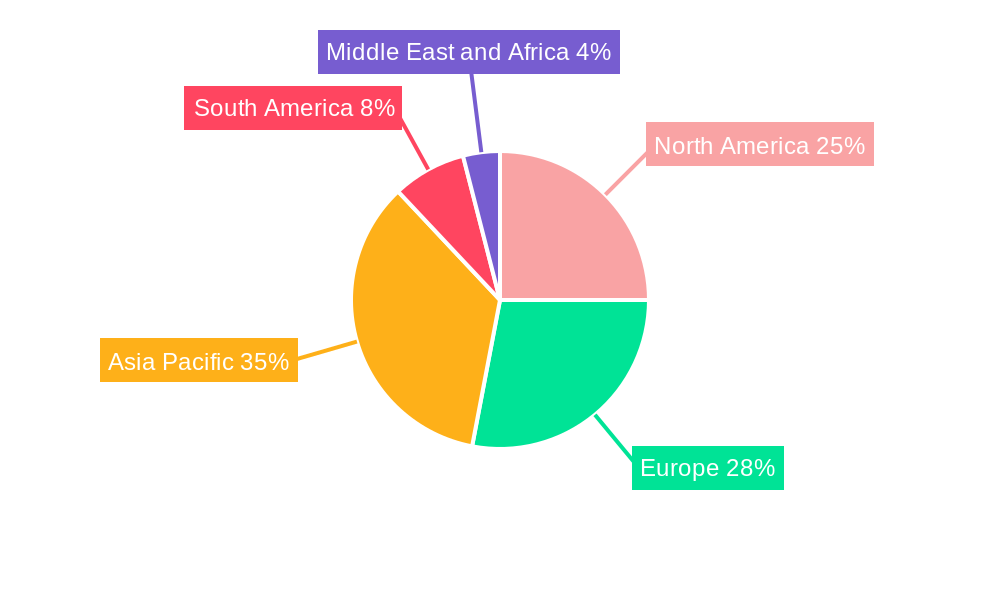
Tartaric Acid Industry Regional Share


Tartaric Acid Industry REPORT HIGHLIGHTS

AspectsDetails
Study Period 2019-2033
Base Year 2024
Estimated Year 2025
Forecast Period2025-2033
Historical Period2019-2024
Growth RateCAGR of > 5.00% from 2019-2033
Segmentation
    • By Type
      • Natural Tartaric Acid
      • Synthetic Tartaric Acid
    • By Application
      • Preservative and Additive
      • Laxative
      • Intermediate
      • Other Applications
    • By End-user Industry
      • Food and Beverage
      • Pharmaceutical
      • Cosmetics
      • Construction
      • Other End-user Industries
  • By Geography
    • Asia Pacific
      • China
      • India
      • Japan
      • South Korea
      • Rest of Asia Pacific
    • North America
      • United States
      • Canada
      • Mexico
    • Europe
      • Germany
      • United Kingdom
      • France
      • Italy
      • Spain
      • Rest of Europe
    • South America
      • Brazil
      • Argentina
      • Rest of South America
    • Middle East and Africa
      • Saudi Arabia
      • South Africa
      • Rest of Middle East and Africa


Table of Contents

  1. 1. Introduction
    • 1.1. Research Scope
    • 1.2. Market Segmentation
    • 1.3. Research Methodology
    • 1.4. Definitions and Assumptions
  2. 2. Executive Summary
    • 2.1. Introduction
  3. 3. Market Dynamics
    • 3.1. Introduction
      • 3.2. Market Drivers
        • 3.2.1. Growing Demand for Wine in the Asia-Pacific and Latin American Regions; Increased Adoption of Microencapsulation across Pharmaceuticals and Food Industries; Rising Demand from the Pharmaceutical Industry
      • 3.3. Market Restrains
        • 3.3.1. Increasing Government Regulations for Restricted Use of Synthetic Tartaric Acid in the Food Industry
      • 3.4. Market Trends
        • 3.4.1. Increasing Demand from the Cosmetics Industry
  4. 4. Market Factor Analysis
    • 4.1. Porters Five Forces
    • 4.2. Supply/Value Chain
    • 4.3. PESTEL analysis
    • 4.4. Market Entropy
    • 4.5. Patent/Trademark Analysis
  5. 5. Global Tartaric Acid Industry Analysis, Insights and Forecast, 2019-2031
    • 5.1. Market Analysis, Insights and Forecast - by Type
      • 5.1.1. Natural Tartaric Acid
      • 5.1.2. Synthetic Tartaric Acid
    • 5.2. Market Analysis, Insights and Forecast - by Application
      • 5.2.1. Preservative and Additive
      • 5.2.2. Laxative
      • 5.2.3. Intermediate
      • 5.2.4. Other Applications
    • 5.3. Market Analysis, Insights and Forecast - by End-user Industry
      • 5.3.1. Food and Beverage
      • 5.3.2. Pharmaceutical
      • 5.3.3. Cosmetics
      • 5.3.4. Construction
      • 5.3.5. Other End-user Industries
    • 5.4. Market Analysis, Insights and Forecast - by Region
      • 5.4.1. Asia Pacific
      • 5.4.2. North America
      • 5.4.3. Europe
      • 5.4.4. South America
      • 5.4.5. Middle East and Africa
  6. 6. Asia Pacific Tartaric Acid Industry Analysis, Insights and Forecast, 2019-2031
    • 6.1. Market Analysis, Insights and Forecast - by Type
      • 6.1.1. Natural Tartaric Acid
      • 6.1.2. Synthetic Tartaric Acid
    • 6.2. Market Analysis, Insights and Forecast - by Application
      • 6.2.1. Preservative and Additive
      • 6.2.2. Laxative
      • 6.2.3. Intermediate
      • 6.2.4. Other Applications
    • 6.3. Market Analysis, Insights and Forecast - by End-user Industry
      • 6.3.1. Food and Beverage
      • 6.3.2. Pharmaceutical
      • 6.3.3. Cosmetics
      • 6.3.4. Construction
      • 6.3.5. Other End-user Industries
  7. 7. North America Tartaric Acid Industry Analysis, Insights and Forecast, 2019-2031
    • 7.1. Market Analysis, Insights and Forecast - by Type
      • 7.1.1. Natural Tartaric Acid
      • 7.1.2. Synthetic Tartaric Acid
    • 7.2. Market Analysis, Insights and Forecast - by Application
      • 7.2.1. Preservative and Additive
      • 7.2.2. Laxative
      • 7.2.3. Intermediate
      • 7.2.4. Other Applications
    • 7.3. Market Analysis, Insights and Forecast - by End-user Industry
      • 7.3.1. Food and Beverage
      • 7.3.2. Pharmaceutical
      • 7.3.3. Cosmetics
      • 7.3.4. Construction
      • 7.3.5. Other End-user Industries
  8. 8. Europe Tartaric Acid Industry Analysis, Insights and Forecast, 2019-2031
    • 8.1. Market Analysis, Insights and Forecast - by Type
      • 8.1.1. Natural Tartaric Acid
      • 8.1.2. Synthetic Tartaric Acid
    • 8.2. Market Analysis, Insights and Forecast - by Application
      • 8.2.1. Preservative and Additive
      • 8.2.2. Laxative
      • 8.2.3. Intermediate
      • 8.2.4. Other Applications
    • 8.3. Market Analysis, Insights and Forecast - by End-user Industry
      • 8.3.1. Food and Beverage
      • 8.3.2. Pharmaceutical
      • 8.3.3. Cosmetics
      • 8.3.4. Construction
      • 8.3.5. Other End-user Industries
  9. 9. South America Tartaric Acid Industry Analysis, Insights and Forecast, 2019-2031
    • 9.1. Market Analysis, Insights and Forecast - by Type
      • 9.1.1. Natural Tartaric Acid
      • 9.1.2. Synthetic Tartaric Acid
    • 9.2. Market Analysis, Insights and Forecast - by Application
      • 9.2.1. Preservative and Additive
      • 9.2.2. Laxative
      • 9.2.3. Intermediate
      • 9.2.4. Other Applications
    • 9.3. Market Analysis, Insights and Forecast - by End-user Industry
      • 9.3.1. Food and Beverage
      • 9.3.2. Pharmaceutical
      • 9.3.3. Cosmetics
      • 9.3.4. Construction
      • 9.3.5. Other End-user Industries
  10. 10. Middle East and Africa Tartaric Acid Industry Analysis, Insights and Forecast, 2019-2031
    • 10.1. Market Analysis, Insights and Forecast - by Type
      • 10.1.1. Natural Tartaric Acid
      • 10.1.2. Synthetic Tartaric Acid
    • 10.2. Market Analysis, Insights and Forecast - by Application
      • 10.2.1. Preservative and Additive
      • 10.2.2. Laxative
      • 10.2.3. Intermediate
      • 10.2.4. Other Applications
    • 10.3. Market Analysis, Insights and Forecast - by End-user Industry
      • 10.3.1. Food and Beverage
      • 10.3.2. Pharmaceutical
      • 10.3.3. Cosmetics
      • 10.3.4. Construction
      • 10.3.5. Other End-user Industries
  11. 11. Asia Pacific Tartaric Acid Industry Analysis, Insights and Forecast, 2019-2031
      • 11.1. Market Analysis, Insights and Forecast - By Country/Sub-region
        • 11.1.1 China
        • 11.1.2 India
        • 11.1.3 Japan
        • 11.1.4 South Korea
        • 11.1.5 Rest of Asia Pacific
  12. 12. North America Tartaric Acid Industry Analysis, Insights and Forecast, 2019-2031
      • 12.1. Market Analysis, Insights and Forecast - By Country/Sub-region
        • 12.1.1 United States
        • 12.1.2 Canada
        • 12.1.3 Mexico
  13. 13. Europe Tartaric Acid Industry Analysis, Insights and Forecast, 2019-2031
      • 13.1. Market Analysis, Insights and Forecast - By Country/Sub-region
        • 13.1.1 Germany
        • 13.1.2 United Kingdom
        • 13.1.3 France
        • 13.1.4 Italy
        • 13.1.5 Spain
        • 13.1.6 Rest of Europe
  14. 14. South America Tartaric Acid Industry Analysis, Insights and Forecast, 2019-2031
      • 14.1. Market Analysis, Insights and Forecast - By Country/Sub-region
        • 14.1.1 Brazil
        • 14.1.2 Argentina
        • 14.1.3 Rest of South America
  15. 15. Middle East and Africa Tartaric Acid Industry Analysis, Insights and Forecast, 2019-2031
      • 15.1. Market Analysis, Insights and Forecast - By Country/Sub-region
        • 15.1.1 Saudi Arabia
        • 15.1.2 South Africa
        • 15.1.3 Rest of Middle East and Africa
  16. 16. Competitive Analysis
    • 16.1. Global Market Share Analysis 2024
      • 16.2. Company Profiles
        • 16.2.1 Omkar Speciality Chemicals Ltd
          • 16.2.1.1. Overview
          • 16.2.1.2. Products
          • 16.2.1.3. SWOT Analysis
          • 16.2.1.4. Recent Developments
          • 16.2.1.5. Financials (Based on Availability)
        • 16.2.2 Changmao Biochemical Engineering Company Limited
          • 16.2.2.1. Overview
          • 16.2.2.2. Products
          • 16.2.2.3. SWOT Analysis
          • 16.2.2.4. Recent Developments
          • 16.2.2.5. Financials (Based on Availability)
        • 16.2.3 Ningbo Jinzhan Biotechnology Co Ltd
          • 16.2.3.1. Overview
          • 16.2.3.2. Products
          • 16.2.3.3. SWOT Analysis
          • 16.2.3.4. Recent Developments
          • 16.2.3.5. Financials (Based on Availability)
        • 16.2.4 Distillerie Mazzari S p A
          • 16.2.4.1. Overview
          • 16.2.4.2. Products
          • 16.2.4.3. SWOT Analysis
          • 16.2.4.4. Recent Developments
          • 16.2.4.5. Financials (Based on Availability)
        • 16.2.5 Vinicas*List Not Exhaustive
          • 16.2.5.1. Overview
          • 16.2.5.2. Products
          • 16.2.5.3. SWOT Analysis
          • 16.2.5.4. Recent Developments
          • 16.2.5.5. Financials (Based on Availability)
        • 16.2.6 The Tartaric Chemicals Corporation
          • 16.2.6.1. Overview
          • 16.2.6.2. Products
          • 16.2.6.3. SWOT Analysis
          • 16.2.6.4. Recent Developments
          • 16.2.6.5. Financials (Based on Availability)
        • 16.2.7 Giovanni Randi SpA
          • 16.2.7.1. Overview
          • 16.2.7.2. Products
          • 16.2.7.3. SWOT Analysis
          • 16.2.7.4. Recent Developments
          • 16.2.7.5. Financials (Based on Availability)
        • 16.2.8 Tarac Technologies
          • 16.2.8.1. Overview
          • 16.2.8.2. Products
          • 16.2.8.3. SWOT Analysis
          • 16.2.8.4. Recent Developments
          • 16.2.8.5. Financials (Based on Availability)
        • 16.2.9 Anhui Hailan Bio-technology Co ltd
          • 16.2.9.1. Overview
          • 16.2.9.2. Products
          • 16.2.9.3. SWOT Analysis
          • 16.2.9.4. Recent Developments
          • 16.2.9.5. Financials (Based on Availability)
        • 16.2.10 AUSTRALIAN TARTARIC PRODUCTS
          • 16.2.10.1. Overview
          • 16.2.10.2. Products
          • 16.2.10.3. SWOT Analysis
          • 16.2.10.4. Recent Developments
          • 16.2.10.5. Financials (Based on Availability)
        • 16.2.11 Dastech International Inc
          • 16.2.11.1. Overview
          • 16.2.11.2. Products
          • 16.2.11.3. SWOT Analysis
          • 16.2.11.4. Recent Developments
          • 16.2.11.5. Financials (Based on Availability)
        • 16.2.12 Derivados Vínicos S A
          • 16.2.12.1. Overview
          • 16.2.12.2. Products
          • 16.2.12.3. SWOT Analysis
          • 16.2.12.4. Recent Developments
          • 16.2.12.5. Financials (Based on Availability)
        • 16.2.13 Tártaros Gonzalo Castelló
          • 16.2.13.1. Overview
          • 16.2.13.2. Products
          • 16.2.13.3. SWOT Analysis
          • 16.2.13.4. Recent Developments
          • 16.2.13.5. Financials (Based on Availability)
        • 16.2.14 ATP Group
          • 16.2.14.1. Overview
          • 16.2.14.2. Products
          • 16.2.14.3. SWOT Analysis
          • 16.2.14.4. Recent Developments
          • 16.2.14.5. Financials (Based on Availability)
        • 16.2.15 Industria Chimica Valenzana I C V SpA
          • 16.2.15.1. Overview
          • 16.2.15.2. Products
          • 16.2.15.3. SWOT Analysis
          • 16.2.15.4. Recent Developments
          • 16.2.15.5. Financials (Based on Availability)

List of Figures

  1. Figure 1: Global Tartaric Acid Industry Revenue Breakdown (Million, %) by Region 2024 & 2032
  2. Figure 2: Asia Pacific Tartaric Acid Industry Revenue (Million), by Country 2024 & 2032
  3. Figure 3: Asia Pacific Tartaric Acid Industry Revenue Share (%), by Country 2024 & 2032
  4. Figure 4: North America Tartaric Acid Industry Revenue (Million), by Country 2024 & 2032
  5. Figure 5: North America Tartaric Acid Industry Revenue Share (%), by Country 2024 & 2032
  6. Figure 6: Europe Tartaric Acid Industry Revenue (Million), by Country 2024 & 2032
  7. Figure 7: Europe Tartaric Acid Industry Revenue Share (%), by Country 2024 & 2032
  8. Figure 8: South America Tartaric Acid Industry Revenue (Million), by Country 2024 & 2032
  9. Figure 9: South America Tartaric Acid Industry Revenue Share (%), by Country 2024 & 2032
  10. Figure 10: Middle East and Africa Tartaric Acid Industry Revenue (Million), by Country 2024 & 2032
  11. Figure 11: Middle East and Africa Tartaric Acid Industry Revenue Share (%), by Country 2024 & 2032
  12. Figure 12: Asia Pacific Tartaric Acid Industry Revenue (Million), by Type 2024 & 2032
  13. Figure 13: Asia Pacific Tartaric Acid Industry Revenue Share (%), by Type 2024 & 2032
  14. Figure 14: Asia Pacific Tartaric Acid Industry Revenue (Million), by Application 2024 & 2032
  15. Figure 15: Asia Pacific Tartaric Acid Industry Revenue Share (%), by Application 2024 & 2032
  16. Figure 16: Asia Pacific Tartaric Acid Industry Revenue (Million), by End-user Industry 2024 & 2032
  17. Figure 17: Asia Pacific Tartaric Acid Industry Revenue Share (%), by End-user Industry 2024 & 2032
  18. Figure 18: Asia Pacific Tartaric Acid Industry Revenue (Million), by Country 2024 & 2032
  19. Figure 19: Asia Pacific Tartaric Acid Industry Revenue Share (%), by Country 2024 & 2032
  20. Figure 20: North America Tartaric Acid Industry Revenue (Million), by Type 2024 & 2032
  21. Figure 21: North America Tartaric Acid Industry Revenue Share (%), by Type 2024 & 2032
  22. Figure 22: North America Tartaric Acid Industry Revenue (Million), by Application 2024 & 2032
  23. Figure 23: North America Tartaric Acid Industry Revenue Share (%), by Application 2024 & 2032
  24. Figure 24: North America Tartaric Acid Industry Revenue (Million), by End-user Industry 2024 & 2032
  25. Figure 25: North America Tartaric Acid Industry Revenue Share (%), by End-user Industry 2024 & 2032
  26. Figure 26: North America Tartaric Acid Industry Revenue (Million), by Country 2024 & 2032
  27. Figure 27: North America Tartaric Acid Industry Revenue Share (%), by Country 2024 & 2032
  28. Figure 28: Europe Tartaric Acid Industry Revenue (Million), by Type 2024 & 2032
  29. Figure 29: Europe Tartaric Acid Industry Revenue Share (%), by Type 2024 & 2032
  30. Figure 30: Europe Tartaric Acid Industry Revenue (Million), by Application 2024 & 2032
  31. Figure 31: Europe Tartaric Acid Industry Revenue Share (%), by Application 2024 & 2032
  32. Figure 32: Europe Tartaric Acid Industry Revenue (Million), by End-user Industry 2024 & 2032
  33. Figure 33: Europe Tartaric Acid Industry Revenue Share (%), by End-user Industry 2024 & 2032
  34. Figure 34: Europe Tartaric Acid Industry Revenue (Million), by Country 2024 & 2032
  35. Figure 35: Europe Tartaric Acid Industry Revenue Share (%), by Country 2024 & 2032
  36. Figure 36: South America Tartaric Acid Industry Revenue (Million), by Type 2024 & 2032
  37. Figure 37: South America Tartaric Acid Industry Revenue Share (%), by Type 2024 & 2032
  38. Figure 38: South America Tartaric Acid Industry Revenue (Million), by Application 2024 & 2032
  39. Figure 39: South America Tartaric Acid Industry Revenue Share (%), by Application 2024 & 2032
  40. Figure 40: South America Tartaric Acid Industry Revenue (Million), by End-user Industry 2024 & 2032
  41. Figure 41: South America Tartaric Acid Industry Revenue Share (%), by End-user Industry 2024 & 2032
  42. Figure 42: South America Tartaric Acid Industry Revenue (Million), by Country 2024 & 2032
  43. Figure 43: South America Tartaric Acid Industry Revenue Share (%), by Country 2024 & 2032
  44. Figure 44: Middle East and Africa Tartaric Acid Industry Revenue (Million), by Type 2024 & 2032
  45. Figure 45: Middle East and Africa Tartaric Acid Industry Revenue Share (%), by Type 2024 & 2032
  46. Figure 46: Middle East and Africa Tartaric Acid Industry Revenue (Million), by Application 2024 & 2032
  47. Figure 47: Middle East and Africa Tartaric Acid Industry Revenue Share (%), by Application 2024 & 2032
  48. Figure 48: Middle East and Africa Tartaric Acid Industry Revenue (Million), by End-user Industry 2024 & 2032
  49. Figure 49: Middle East and Africa Tartaric Acid Industry Revenue Share (%), by End-user Industry 2024 & 2032
  50. Figure 50: Middle East and Africa Tartaric Acid Industry Revenue (Million), by Country 2024 & 2032
  51. Figure 51: Middle East and Africa Tartaric Acid Industry Revenue Share (%), by Country 2024 & 2032

List of Tables

  1. Table 1: Global Tartaric Acid Industry Revenue Million Forecast, by Region 2019 & 2032
  2. Table 2: Global Tartaric Acid Industry Revenue Million Forecast, by Type 2019 & 2032
  3. Table 3: Global Tartaric Acid Industry Revenue Million Forecast, by Application 2019 & 2032
  4. Table 4: Global Tartaric Acid Industry Revenue Million Forecast, by End-user Industry 2019 & 2032
  5. Table 5: Global Tartaric Acid Industry Revenue Million Forecast, by Region 2019 & 2032
  6. Table 6: Global Tartaric Acid Industry Revenue Million Forecast, by Country 2019 & 2032
  7. Table 7: China Tartaric Acid Industry Revenue (Million) Forecast, by Application 2019 & 2032
  8. Table 8: India Tartaric Acid Industry Revenue (Million) Forecast, by Application 2019 & 2032
  9. Table 9: Japan Tartaric Acid Industry Revenue (Million) Forecast, by Application 2019 & 2032
  10. Table 10: South Korea Tartaric Acid Industry Revenue (Million) Forecast, by Application 2019 & 2032
  11. Table 11: Rest of Asia Pacific Tartaric Acid Industry Revenue (Million) Forecast, by Application 2019 & 2032
  12. Table 12: Global Tartaric Acid Industry Revenue Million Forecast, by Country 2019 & 2032
  13. Table 13: United States Tartaric Acid Industry Revenue (Million) Forecast, by Application 2019 & 2032
  14. Table 14: Canada Tartaric Acid Industry Revenue (Million) Forecast, by Application 2019 & 2032
  15. Table 15: Mexico Tartaric Acid Industry Revenue (Million) Forecast, by Application 2019 & 2032
  16. Table 16: Global Tartaric Acid Industry Revenue Million Forecast, by Country 2019 & 2032
  17. Table 17: Germany Tartaric Acid Industry Revenue (Million) Forecast, by Application 2019 & 2032
  18. Table 18: United Kingdom Tartaric Acid Industry Revenue (Million) Forecast, by Application 2019 & 2032
  19. Table 19: France Tartaric Acid Industry Revenue (Million) Forecast, by Application 2019 & 2032
  20. Table 20: Italy Tartaric Acid Industry Revenue (Million) Forecast, by Application 2019 & 2032
  21. Table 21: Spain Tartaric Acid Industry Revenue (Million) Forecast, by Application 2019 & 2032
  22. Table 22: Rest of Europe Tartaric Acid Industry Revenue (Million) Forecast, by Application 2019 & 2032
  23. Table 23: Global Tartaric Acid Industry Revenue Million Forecast, by Country 2019 & 2032
  24. Table 24: Brazil Tartaric Acid Industry Revenue (Million) Forecast, by Application 2019 & 2032
  25. Table 25: Argentina Tartaric Acid Industry Revenue (Million) Forecast, by Application 2019 & 2032
  26. Table 26: Rest of South America Tartaric Acid Industry Revenue (Million) Forecast, by Application 2019 & 2032
  27. Table 27: Global Tartaric Acid Industry Revenue Million Forecast, by Country 2019 & 2032
  28. Table 28: Saudi Arabia Tartaric Acid Industry Revenue (Million) Forecast, by Application 2019 & 2032
  29. Table 29: South Africa Tartaric Acid Industry Revenue (Million) Forecast, by Application 2019 & 2032
  30. Table 30: Rest of Middle East and Africa Tartaric Acid Industry Revenue (Million) Forecast, by Application 2019 & 2032
  31. Table 31: Global Tartaric Acid Industry Revenue Million Forecast, by Type 2019 & 2032
  32. Table 32: Global Tartaric Acid Industry Revenue Million Forecast, by Application 2019 & 2032
  33. Table 33: Global Tartaric Acid Industry Revenue Million Forecast, by End-user Industry 2019 & 2032
  34. Table 34: Global Tartaric Acid Industry Revenue Million Forecast, by Country 2019 & 2032
  35. Table 35: China Tartaric Acid Industry Revenue (Million) Forecast, by Application 2019 & 2032
  36. Table 36: India Tartaric Acid Industry Revenue (Million) Forecast, by Application 2019 & 2032
  37. Table 37: Japan Tartaric Acid Industry Revenue (Million) Forecast, by Application 2019 & 2032
  38. Table 38: South Korea Tartaric Acid Industry Revenue (Million) Forecast, by Application 2019 & 2032
  39. Table 39: Rest of Asia Pacific Tartaric Acid Industry Revenue (Million) Forecast, by Application 2019 & 2032
  40. Table 40: Global Tartaric Acid Industry Revenue Million Forecast, by Type 2019 & 2032
  41. Table 41: Global Tartaric Acid Industry Revenue Million Forecast, by Application 2019 & 2032
  42. Table 42: Global Tartaric Acid Industry Revenue Million Forecast, by End-user Industry 2019 & 2032
  43. Table 43: Global Tartaric Acid Industry Revenue Million Forecast, by Country 2019 & 2032
  44. Table 44: United States Tartaric Acid Industry Revenue (Million) Forecast, by Application 2019 & 2032
  45. Table 45: Canada Tartaric Acid Industry Revenue (Million) Forecast, by Application 2019 & 2032
  46. Table 46: Mexico Tartaric Acid Industry Revenue (Million) Forecast, by Application 2019 & 2032
  47. Table 47: Global Tartaric Acid Industry Revenue Million Forecast, by Type 2019 & 2032
  48. Table 48: Global Tartaric Acid Industry Revenue Million Forecast, by Application 2019 & 2032
  49. Table 49: Global Tartaric Acid Industry Revenue Million Forecast, by End-user Industry 2019 & 2032
  50. Table 50: Global Tartaric Acid Industry Revenue Million Forecast, by Country 2019 & 2032
  51. Table 51: Germany Tartaric Acid Industry Revenue (Million) Forecast, by Application 2019 & 2032
  52. Table 52: United Kingdom Tartaric Acid Industry Revenue (Million) Forecast, by Application 2019 & 2032
  53. Table 53: France Tartaric Acid Industry Revenue (Million) Forecast, by Application 2019 & 2032
  54. Table 54: Italy Tartaric Acid Industry Revenue (Million) Forecast, by Application 2019 & 2032
  55. Table 55: Spain Tartaric Acid Industry Revenue (Million) Forecast, by Application 2019 & 2032
  56. Table 56: Rest of Europe Tartaric Acid Industry Revenue (Million) Forecast, by Application 2019 & 2032
  57. Table 57: Global Tartaric Acid Industry Revenue Million Forecast, by Type 2019 & 2032
  58. Table 58: Global Tartaric Acid Industry Revenue Million Forecast, by Application 2019 & 2032
  59. Table 59: Global Tartaric Acid Industry Revenue Million Forecast, by End-user Industry 2019 & 2032
  60. Table 60: Global Tartaric Acid Industry Revenue Million Forecast, by Country 2019 & 2032
  61. Table 61: Brazil Tartaric Acid Industry Revenue (Million) Forecast, by Application 2019 & 2032
  62. Table 62: Argentina Tartaric Acid Industry Revenue (Million) Forecast, by Application 2019 & 2032
  63. Table 63: Rest of South America Tartaric Acid Industry Revenue (Million) Forecast, by Application 2019 & 2032
  64. Table 64: Global Tartaric Acid Industry Revenue Million Forecast, by Type 2019 & 2032
  65. Table 65: Global Tartaric Acid Industry Revenue Million Forecast, by Application 2019 & 2032
  66. Table 66: Global Tartaric Acid Industry Revenue Million Forecast, by End-user Industry 2019 & 2032
  67. Table 67: Global Tartaric Acid Industry Revenue Million Forecast, by Country 2019 & 2032
  68. Table 68: Saudi Arabia Tartaric Acid Industry Revenue (Million) Forecast, by Application 2019 & 2032
  69. Table 69: South Africa Tartaric Acid Industry Revenue (Million) Forecast, by Application 2019 & 2032
  70. Table 70: Rest of Middle East and Africa Tartaric Acid Industry Revenue (Million) Forecast, by Application 2019 & 2032


Frequently Asked Questions

1. What is the projected Compound Annual Growth Rate (CAGR) of the Tartaric Acid Industry?

The projected CAGR is approximately > 5.00%.

2. Which companies are prominent players in the Tartaric Acid Industry?

Key companies in the market include Omkar Speciality Chemicals Ltd, Changmao Biochemical Engineering Company Limited, Ningbo Jinzhan Biotechnology Co Ltd, Distillerie Mazzari S p A, Vinicas*List Not Exhaustive, The Tartaric Chemicals Corporation, Giovanni Randi SpA, Tarac Technologies, Anhui Hailan Bio-technology Co ltd, AUSTRALIAN TARTARIC PRODUCTS, Dastech International Inc, Derivados Vínicos S A, Tártaros Gonzalo Castelló, ATP Group, Industria Chimica Valenzana I C V SpA.

3. What are the main segments of the Tartaric Acid Industry?

The market segments include Type, Application, End-user Industry.

4. Can you provide details about the market size?

The market size is estimated to be USD XX Million as of 2022.

5. What are some drivers contributing to market growth?

Growing Demand for Wine in the Asia-Pacific and Latin American Regions; Increased Adoption of Microencapsulation across Pharmaceuticals and Food Industries; Rising Demand from the Pharmaceutical Industry.

6. What are the notable trends driving market growth?

Increasing Demand from the Cosmetics Industry.

7. Are there any restraints impacting market growth?

Increasing Government Regulations for Restricted Use of Synthetic Tartaric Acid in the Food Industry.

8. Can you provide examples of recent developments in the market?

N/A

9. What pricing options are available for accessing the report?

Pricing options include single-user, multi-user, and enterprise licenses priced at USD 4750, USD 5250, and USD 8750 respectively.

10. Is the market size provided in terms of value or volume?

The market size is provided in terms of value, measured in Million.

11. Are there any specific market keywords associated with the report?

Yes, the market keyword associated with the report is "Tartaric Acid Industry," which aids in identifying and referencing the specific market segment covered.

12. How do I determine which pricing option suits my needs best?

The pricing options vary based on user requirements and access needs. Individual users may opt for single-user licenses, while businesses requiring broader access may choose multi-user or enterprise licenses for cost-effective access to the report.

13. Are there any additional resources or data provided in the Tartaric Acid Industry report?

While the report offers comprehensive insights, it's advisable to review the specific contents or supplementary materials provided to ascertain if additional resources or data are available.

14. How can I stay updated on further developments or reports in the Tartaric Acid Industry?

To stay informed about further developments, trends, and reports in the Tartaric Acid Industry, consider subscribing to industry newsletters, following relevant companies and organizations, or regularly checking reputable industry news sources and publications.


Methodology

Step 1 - Identification of Relevant Samples Size from Population Database

Step Chart
Bar Chart
Method Chart

Step 2 - Approaches for Defining Global Market Size (Value, Volume* & Price*)

Approach Chart
Top-down and bottom-up approaches are used to validate the global market size and estimate the market size for manufactures, regional segments, product, and application.

Note*: In applicable scenarios

Step 3 - Data Sources

Primary Research

  • Web Analytics
  • Survey Reports
  • Research Institute
  • Latest Research Reports
  • Opinion Leaders

Secondary Research

  • Annual Reports
  • White Paper
  • Latest Press Release
  • Industry Association
  • Paid Database
  • Investor Presentations
Analyst Chart

Step 4 - Data Triangulation

Involves using different sources of information in order to increase the validity of a study

These sources are likely to be stakeholders in a program - participants, other researchers, program staff, other community members, and so on.

Then we put all data in single framework & apply various statistical tools to find out the dynamic on the market.

During the analysis stage, feedback from the stakeholder groups would be compared to determine areas of agreement as well as areas of divergence

Additionally, after gathering mixed and scattered data from a wide range of sources, data is triangulated and correlated to come up with estimated figures which are further validated through primary mediums or industry experts, opinion leaders.

About Research Axiom

Research Axiom delivers in-depth market research, industry analysis, and consulting for pharmaceuticals, automotive, IT, and consumer goods. Our reports provide the clarity you need to make informed decisions and drive innovation.

Our team combines primary research, advanced analytics, and sector expertise to deliver actionable intelligence. We offer syndicated reports, custom research, and consulting services tailored to your business needs.

At Research Axiom, we are committed to quality, transparency, and client satisfaction. Every report is rigorously validated to ensure accuracy and relevance. Our global perspective and local expertise help you understand both the big picture and the finer details of your market.

Stay informed with Research Axiom. Subscribe to our newsletter for the latest updates and research highlights, and follow us on social media for real-time insights. Research Axiom – Turning Data into Business Advantage.

artwork spiralartwork spiralRelated Reports
artwork underline

CCUS Market Decoded: Comprehensive Analysis and Forecasts 2025-2033

Explore the booming Carbon Capture, Utilization, and Storage (CCUS) market, driven by climate goals and industrial decarbonization. Discover key trends, technologies, and growth forecasts from 2025-2033.

September 2025
Base Year: 2024
No Of Pages: 180
Price: $4750

Sri Lanka Paints And Coatings Market Market Trends and Insights

Explore the Sri Lanka paints and coatings market, driven by construction, urbanization, and eco-friendly trends. Get insights into market size, CAGR, key players, and future growth.

September 2025
Base Year: 2024
No Of Pages: 180
Price: $3800

Polypropylene Catalyst Industry Strategic Dynamics: Competitor Analysis 2025-2033

Explore the booming Polypropylene Catalyst market forecast, driven by surging demand for polypropylene in packaging, automotive, and construction. Discover key drivers, trends, restraints, and top companies shaping this \$1.35 billion industry with a 5.3% CAGR.

September 2025
Base Year: 2024
No Of Pages: 180
Price: $3,950

Vietnam Commercial Vehicles Lubricants Market XX CAGR Growth Outlook 2025-2033

Explore the booming Vietnam Commercial Vehicles Lubricants Market, driven by logistics growth and infrastructure development. Discover market size, CAGR, key drivers, trends, and leading companies. Get insights into Engine Oils, Greases, and more.

September 2025
Base Year: 2024
No Of Pages: 197
Price: $3800

Self-adhered Roofing Membranes Market Growth Opportunities: Market Size Forecast to 2033

Explore the Self-adhered Roofing Membranes Market growth forecast, key drivers like TPO & EPDM, and regional trends in North America, Asia Pacific, and Europe. Get insights into market size and CAGR.

September 2025
Base Year: 2024
No Of Pages: 180
Price: $4750

Polyurethane Composites Market Market’s Technological Evolution: Trends and Analysis 2025-2033

Explore the dynamic global Polyurethane Composites Market, forecasting significant growth driven by transportation, construction, and renewable energy. Discover key drivers, trends, and restraints shaping this expanding industry.

September 2025
Base Year: 2024
No Of Pages: 234
Price: $4750

Nucleotides Market 2025 Trends and Forecasts 2033: Analyzing Growth Opportunities

Explore the dynamic Nucleotides Market with a market size of USD 718.4 million and a CAGR over 7%. Discover key drivers, pharmaceutical applications, and regional growth trends through 2033.

September 2025
Base Year: 2024
No Of Pages: 180
Price: $4750

Superhydrophobic Coating Market 2025 to Grow at XX CAGR with XXX Million Market Size: Analysis and Forecasts 2033

The size of the Superhydrophobic Coating Market market was valued at USD XX Million in 2024 and is projected to reach USD XXX Million by 2033, with an expected CAGR of % during the forecast period.

September 2025
Base Year: 2024
No Of Pages: 234
Price: $4750

Europe Ammonium Nitrate Market Market’s Strategic Roadmap: Insights for 2025-2033

The size of the Europe Ammonium Nitrate Market market was valued at USD XX Million in 2024 and is projected to reach USD XXX Million by 2033, with an expected CAGR of 1.03">> 1.03% during the forecast period.

September 2025
Base Year: 2024
No Of Pages: 140
Price: $4750

Industrial Laser Market CAGR Growth Drivers and Trends: Forecasts 2025-2033

The size of the Industrial Laser Market market was valued at USD XX Million in 2024 and is projected to reach USD XXX Million by 2033, with an expected CAGR of 13.00">> 13.00% during the forecast period.

September 2025
Base Year: 2024
No Of Pages: 234
Price: $4750

United States Decorative Laminates Market Market Overview: Trends and Strategic Forecasts 2025-2033

The US Decorative Laminates Market is booming, projected to exceed $2.9 billion by 2033 with a CAGR above 2%. Driven by home renovations and new construction, this report analyzes market trends, key players (Formica, Wilsonart), segments (furniture, flooring), and regional growth, providing valuable insights for investors and industry professionals.

August 2025
Base Year: 2024
No Of Pages: 120
Price: $3800

Demand Patterns in Microcrystalline Wax Market Market: Projections to 2033

Discover the booming microcrystalline wax market! This comprehensive analysis reveals a CAGR of 8.15% through 2033, driven by cosmetics, packaging, and candle industries. Explore regional trends, key players (Sasol, Sonneborn, Koster Keunen), and future growth projections.

August 2025
Base Year: 2024
No Of Pages: 180
Price: $4750

GCC Flat Glass Market Market’s Growth Catalysts

Discover the booming GCC flat glass market! Our in-depth analysis reveals a CAGR of 4.49%, driven by construction, automotive, and solar energy sectors. Learn about key players, market trends, and future growth projections for annealed glass, coated glass, and more. Invest wisely in this lucrative market.

August 2025
Base Year: 2024
No Of Pages: 150
Price: $4750

Packaging Tapes Industry in Developing Economies: Trends and Growth Analysis 2025-2033

Discover the booming Packaging Tapes market! Our in-depth analysis reveals a CAGR exceeding 6%, driven by e-commerce and sustainable packaging trends. Explore market size, key players (3M, Avery Dennison, etc.), regional insights, and future growth projections. Learn how to capitalize on this expanding industry.

August 2025
Base Year: 2024
No Of Pages: 150
Price: $4750

Plastic Adhesives Industry: Growth Opportunities and Competitive Landscape Overview 2025-2033

Discover the booming plastic adhesives market! This comprehensive analysis reveals key trends, drivers, and restraints impacting growth through 2033, covering resin types, technologies, and major players like 3M and Henkel. Explore regional market shares and CAGR projections.

August 2025
Base Year: 2024
No Of Pages: 150
Price: $4750

Iran Automotive Engine Oils Market Market Report: Trends and Growth

Discover the latest insights into the thriving Iran Automotive Engine Oils Market. This comprehensive analysis reveals a market size of $150 million in 2025, projected to grow at a 2.22% CAGR until 2033. Explore key drivers, trends, restraints, and leading players shaping this dynamic sector.

August 2025
Base Year: 2024
No Of Pages: 197
Price: $3800

Asia-Pacific Acetic Acid Market 2025-2033 Trends: Unveiling Growth Opportunities and Competitor Dynamics

The Asia-Pacific acetic acid market is booming, with a projected CAGR of 5.26% (2025-2033). This comprehensive analysis explores market size, key drivers (textiles, pharmaceuticals), major players (Celanese, Eastman Chemical), and regional trends, offering valuable insights for industry stakeholders. Discover growth opportunities in this dynamic market.

August 2025
Base Year: 2024
No Of Pages: 234
Price: $4750

Facade Coatings Market Competitive Advantage: Trends and Opportunities to 2033

Discover the booming facade coatings market! Our analysis reveals a CAGR exceeding 7%, driven by urbanization and demand for energy-efficient buildings. Explore market segmentation, key players (Nippon Paint, Sherwin-Williams, AkzoNobel), and regional trends in this comprehensive report. Learn about silicone, acrylic, and other resin types dominating the industry.

August 2025
Base Year: 2024
No Of Pages: 234
Price: $4750

North America Powder Coatings Market Strategic Insights for 2025 and Forecasts to 2033: Market Trends

The North American powder coatings market is booming, projected to reach [estimated 2033 value] by 2033 with a 4% CAGR. This in-depth analysis explores market drivers, trends, and restraints, covering key resin types, end-user industries, and leading companies. Discover growth opportunities in architectural, automotive, and industrial applications.

August 2025
Base Year: 2024
No Of Pages: 180
Price: $4750

Strategic Insights into India Cement Market Market Trends

Discover the booming Indian cement market! Our in-depth analysis reveals a 5% CAGR from 2025-2033, driven by infrastructure growth and urbanization. Explore key players, market segmentation (OPC, blended cement, etc.), regional trends, and future projections for India's cement industry.

August 2025
Base Year: 2024
No Of Pages: 150
Price: $3800

Asia-Pacific Laminated Adhesives Industry 2025 to Grow at XX CAGR with XXX Million Market Size: Analysis and Forecasts 2033

The Asia-Pacific laminated adhesives market is booming, projected to exceed a CAGR of 6% through 2033. Driven by packaging, industrial, and transportation growth, this market analysis explores key trends, restraints, and leading companies like Avery Dennison and Henkel. Discover insights into regional market share and future projections.

August 2025
Base Year: 2024
No Of Pages: 150
Price: $4750

Analyzing Asia-Pacific Surface Treatment Chemicals Market: Opportunities and Growth Patterns 2025-2033

The Asia-Pacific surface treatment chemicals market is booming, with a CAGR exceeding 5%! This in-depth analysis explores market size, key drivers (automotive, electronics, construction), top players (Henkel, PPG, Chemetall), and future trends in this rapidly growing sector. Discover opportunities and challenges in this dynamic market.

August 2025
Base Year: 2024
No Of Pages: 234
Price: $4750

Barium Petroleum Sulfonate Market Trends and Opportunities for Growth

Discover the booming Barium Petroleum Sulfonate market forecast to 2033! This comprehensive analysis reveals key growth drivers, regional market shares, and competitive landscape insights. Learn about the impact of EOR techniques and environmental regulations on market expansion. Explore the projected CAGR and understand future market trends.

August 2025
Base Year: 2024
No Of Pages: 234
Price: $4750

Consumer Trends in South America Waterborne Adhesives Market Market 2025-2033

Discover the booming South American waterborne adhesives market! This in-depth analysis reveals key trends, drivers, and restraints shaping the $XX million market, projected to exceed 4% CAGR through 2033. Explore regional insights, leading companies (Henkel, 3M, Pidilite), and lucrative segments like building & construction and packaging. Get your free market report today!

August 2025
Base Year: 2024
No Of Pages: 234
Price: $4750

Strategic Growth Drivers for APAC Paints & Coatings Additives Industry Market

The APAC paints & coatings additives market is booming, with a CAGR exceeding 6%! Discover key trends, drivers, and regional breakdowns in this comprehensive market analysis, featuring insights on major players and growth projections to 2033. Learn how to capitalize on this lucrative opportunity.

August 2025
Base Year: 2024
No Of Pages: 180
Price: $4750

ASEAN Protective Coatings Market 2025-2033 Overview: Trends, Competitor Dynamics, and Opportunities

Discover the booming ASEAN protective coatings market! This in-depth analysis reveals a $300M market in 2025, projected to grow at a CAGR exceeding 3% until 2033, driven by infrastructure development and advanced coating technologies. Learn about key players, regional trends, and market restraints in this comprehensive report.

August 2025
Base Year: 2024
No Of Pages: 180
Price: $4750

Exploring Fatty Acid Ester Market Growth Trajectories: CAGR Insights 2025-2033

Discover the booming Fatty Acid Ester market! This comprehensive analysis reveals key drivers, trends, and restraints shaping this multi-billion dollar industry, including projections to 2033, regional breakdowns, and leading companies. Explore market segmentation by type and application, and gain valuable insights for investment and strategic planning.

August 2025
Base Year: 2024
No Of Pages: 180
Price: $4750

Regional Analysis of Asia-Pacific Electronics Adhesives Market Growth Trajectories

The Asia-Pacific Electronics Adhesives Market is booming, projected to exceed $27.6 Billion by 2033 with a CAGR >8%. Driven by 5G, electric vehicles, and consumer electronics growth, this report analyzes market trends, key players (Henkel, 3M, BASF), and application segments (conformal coatings, surface mounting). Discover key insights and forecast data now!

August 2025
Base Year: 2024
No Of Pages: 234
Price: $4750

Strategic Vision for Particle Board Industry in India Industry Trends

Discover the booming Indian particle board market! This in-depth analysis reveals a $0.64B market in 2025, projected to grow at a 12.15% CAGR until 2033, driven by construction, furniture, and infrastructure growth. Explore key players, regional trends, and future forecasts for this dynamic sector.

August 2025
Base Year: 2024
No Of Pages: 197
Price: $3800

Navigating Cryogenic Valves Market Market Trends: Competitor Analysis and Growth 2025-2033

The Cryogenic Valves Market is booming, with a CAGR exceeding 4% and projected growth to 2033. Driven by LNG expansion and technological advancements, this market analysis reveals key trends, restraints, and leading companies, offering valuable insights for investors and industry professionals. Explore market segmentation, regional breakdowns, and future projections.

August 2025
Base Year: 2024
No Of Pages: 234
Price: $4750

Exploring Innovation in Saturated Polyester Resins Market Industry

Discover the latest insights into the booming saturated polyester resins market, projected to reach $7.39 billion by 2033 with a CAGR of 4.24%. This comprehensive analysis covers market size, key drivers, trends, restraints, segments (liquid/solid, applications), leading companies, and regional breakdowns (North America, Europe, Asia-Pacific, etc.). Learn about growth opportunities and future trends in this vital industry.

August 2025
Base Year: 2024
No Of Pages: 150
Price: $4750

Navigating Bismuth Market Market Trends: Competitor Analysis and Growth 2025-2033

Discover the booming bismuth market! This in-depth analysis reveals a CAGR exceeding 5%, driven by pharmaceutical, automotive, and electronics demand. Explore market trends, segmentation (bismuth oxide, bismuth oxychloride, etc.), key players (Merck KGaA, BASF SE, etc.), and regional growth forecasts (Asia Pacific, North America) through 2033.

August 2025
Base Year: 2024
No Of Pages: 234
Price: $4750

Consumer Trends Driving Tall Oil Rosin Industry Market Growth

Discover the booming Tall Oil Rosin market! Our comprehensive analysis reveals key trends, growth projections (2019-2033), and regional market share, highlighting opportunities in adhesives, inks, and coatings. Learn about CAGR, market size, and future forecasts for this vital chemical industry segment.

August 2025
Base Year: 2024
No Of Pages: 234
Price: $4750

Strategic Insights for Wax Additives Market Market Expansion

The global wax additives market is booming, projected to reach over $2.5 billion by 2033 with a 4.95% CAGR. Discover key trends, drivers, restraints, and leading companies shaping this dynamic industry across coatings, leather, and printing applications. Explore market segmentation by material type and regional insights.

August 2025
Base Year: 2024
No Of Pages: 180
Price: $4750

High Purity Quartz Market Industry Insights and Forecasts

The high-purity quartz market is booming, with a projected CAGR exceeding 4.5% to 2033. Driven by semiconductor, solar, and lighting industries, this market analysis reveals key trends, regional insights, and leading companies like Jiangsu Pacific Quartz and Momentive Technologies. Discover the future of high-purity quartz.

August 2025
Base Year: 2024
No Of Pages: 234
Price: $4750

Polyether Amine Industry XX CAGR Growth Outlook 2025-2033

Discover the booming polyether amine market! This in-depth analysis reveals a CAGR of 9.44%, driven by polyurea coatings, fuel additives, and composites. Explore key trends, regional growth, and leading companies shaping this dynamic industry. Get the latest market insights and projections for 2025-2033.

August 2025
Base Year: 2024
No Of Pages: 234
Price: $4750

Flame Retardants for Aerospace Plastics Market Drivers of Growth: Opportunities to 2033

Discover the booming Flame Retardants for Aerospace Plastics market analysis, projecting robust growth (CAGR >3%) to 2033. Explore key drivers, trends, restraints, leading companies (BASF, Clariant, etc.), and regional market share data. Learn about the latest innovations in halogen-free and sustainable solutions.

August 2025
Base Year: 2024
No Of Pages: 234
Price: $4750

Turkey Commercial Vehicle Lubricant Market Insights: Market Size Analysis to 2033

Discover the booming Turkish commercial vehicle lubricant market! Our in-depth analysis reveals a CAGR of 5.45% through 2033, driven by economic growth and regulatory changes. Explore key players, market segmentation, and future trends impacting engine oils, greases, and more.

August 2025
Base Year: 2024
No Of Pages: 120
Price: $3800

Adhesives and Sealants Market 2025 to Grow at XX CAGR with XXX Million Market Size: Analysis and Forecasts 2033

The global adhesives and sealants market is booming, projected to exceed $133 billion by 2033, driven by construction, automotive, and aerospace growth. Explore market trends, key players (Henkel, 3M, Akzo Nobel), and regional insights in this comprehensive analysis. Discover opportunities within polyurethane, epoxy, and silicone adhesives and sealants.

August 2025
Base Year: 2024
No Of Pages: 180
Price: $4750

Unlocking Insights for Polyurethane Powder Coatings Market Growth Strategies

The Polyurethane Powder Coatings Market is booming, with a CAGR exceeding 5%! Discover key trends, drivers, and restraints shaping this $XX billion industry. Explore regional market share, leading companies, and future growth projections in our comprehensive market analysis.

August 2025
Base Year: 2024
No Of Pages: 234
Price: $4750

Decoding Bio alcohols Market Consumer Preferences 2025-2033

Discover the booming bio-alcohols market! This comprehensive analysis reveals key trends, drivers, and restraints impacting bio-ethanol, bio-methanol, bio-butanol, and bio-BDO production from 2019-2033, including regional market shares and leading companies. Explore the potential of sustainable fuels and bio-based materials in transportation, construction, and more.

August 2025
Base Year: 2024
No Of Pages: 234
Price: $4750

Exploring Innovation in North America Electronics Adhesives Market Industry

Discover the booming North America Electronics Adhesives Market! This in-depth analysis reveals a CAGR exceeding 7%, driven by EV adoption, consumer electronics growth, and industry innovation. Explore market size, key players (Henkel, 3M, Dow), and future trends impacting epoxy, acrylic, and polyurethane adhesives.

August 2025
Base Year: 2024
No Of Pages: 234
Price: $4750

Fracking Chemicals Fluid Market Size, Share, and Growth Report: In-Depth Analysis and Forecast to 2033

The Fracking Chemicals Fluid market is booming, exceeding a $15 billion valuation in 2025 and projected for 9%+ CAGR through 2033. Driven by rising energy demand and technological advancements, this report analyzes market segments (water-based, oil-based, etc.), key players (Baker Hughes, Halliburton, Schlumberger), and regional growth trends. Discover insights into this dynamic market.

August 2025
Base Year: 2024
No Of Pages: 234
Price: $4750

Opportunities in United Kingdom Architectural Coatings Market Market 2025-2033

Discover the booming UK Architectural Coatings Market! This in-depth analysis reveals key trends, growth drivers, and market segmentation from 2019-2033, including insights on waterborne coatings, resin types, and leading companies like AkzoNobel and Sherwin-Williams. Learn about projected CAGR and future growth opportunities.

August 2025
Base Year: 2024
No Of Pages: 180
Price: $3800

Polyurea Grease Market Industry Forecasts: Insights and Growth

Discover the booming Polyurea Grease market! This in-depth analysis reveals a CAGR exceeding 7%, driven by high-performance needs and sustainability trends. Explore market size, key players (Castrol, Sinopec, Chevron), and future growth projections for 2025-2033.

August 2025
Base Year: 2024
No Of Pages: 234
Price: $4750

GFRP Industry Market Report: Trends and Growth

Discover the booming GFRP market analysis with a CAGR exceeding 4%! Explore key trends, drivers, restraints, and regional insights. Learn about leading companies and future projections until 2033. Invest wisely in this expanding sector.

August 2025
Base Year: 2024
No Of Pages: 234
Price: $4750

Understanding Rubber Bonded Abrasive Market Trends and Growth Dynamics

Discover the booming Rubber Bonded Abrasive market! Explore key trends, growth drivers, and regional insights for 2025-2033. Learn about leading companies and the future of this $XX million industry. Get your market analysis now.

August 2025
Base Year: 2024
No Of Pages: 150
Price: $4750

Hydrogen Cyanide Market Analysis 2025 and Forecasts 2033: Unveiling Growth Opportunities

The Hydrogen Cyanide market is poised for steady growth, driven by increasing demand from key industries like textiles and mining. Learn about market size, trends, key players, and regional analysis in this comprehensive report covering the period 2019-2033. Explore the challenges and opportunities in this vital chemical market.

August 2025
Base Year: 2024
No Of Pages: 180
Price: $4750

Strategic Drivers and Barriers in Polyester Hot Melt Adhesives Market Market 2025-2033

Discover the latest insights into the booming Polyester Hot Melt Adhesives market. Explore market size, CAGR, key drivers, trends, restraints, and leading companies. Learn about growth projections to 2033 and regional market share analysis. Download your free report today!

August 2025
Base Year: 2024
No Of Pages: 234
Price: $4750

Poland Architectural Coatings Market 2025-2033 Overview: Trends, Competitor Dynamics, and Opportunities

Discover the booming Poland architectural coatings market! This in-depth analysis reveals a CAGR exceeding 4%, driven by construction growth and rising demand for sustainable solutions. Explore market segments, key players (AkzoNobel, Jotun, PPG), and future trends impacting this €[estimated value] market from 2025-2033.

August 2025
Base Year: 2024
No Of Pages: 180
Price: $3800
  • Home
  • About Us
  • Industries
    • Aerospace & Defense
    • Agriculture
    • Animal Nutrition & Wellness
    • Automotive
    • Chemicals & Materials
    • Consumer Goods and Services
    • Energy & Power
    • Financial Services and Investment Intelligence
    • Food & Beverage
    • Home and Property Improvement
    • Hospitality and Tourism
    • Logistics
    • Manufacturing Products and Services
    • Packaging
    • Professional and Commercial Services
    • Real Estate and Construction
    • Retail
    • Technology, Media and Telecom
    • Healthcare
  • Services
  • Contact
Main Logo
  • Home
  • About Us
  • Industries
    • Aerospace & Defense
    • Agriculture
    • Animal Nutrition & Wellness
    • Automotive
    • Chemicals & Materials
    • Consumer Goods and Services
    • Energy & Power
    • Financial Services and Investment Intelligence
    • Food & Beverage
    • Home and Property Improvement
    • Hospitality and Tourism
    • Logistics
    • Manufacturing Products and Services
    • Packaging
    • Professional and Commercial Services
    • Real Estate and Construction
    • Retail
    • Technology, Media and Telecom
    • Healthcare
  • Services
  • Contact
+17162654855
[email protected]

+17162654855

[email protected]

Business Address

Head Office

Ansec House 3 rd floor Tank Road, Yerwada, Pune, Maharashtra 411014

Contact Information

Craig Francis

Business Development Head

+17162654855

[email protected]

Secure Payment Partners

payment image
RetailLogisticsPackagingAutomotiveHealthcareAgricultureEnergy & PowerFood & BeverageAerospace & DefenseChemicals & MaterialsHospitality and TourismAnimal Nutrition & WellnessConsumer Goods and ServicesReal Estate and ConstructionHome and Property ImprovementTechnology, Media and TelecomManufacturing Products and ServicesFinancial Services and Investment Intelligence

© 2025 PRDUA Research & Media Private Limited, All rights reserved

Privacy Policy
Terms and Conditions
FAQ