Key Insights
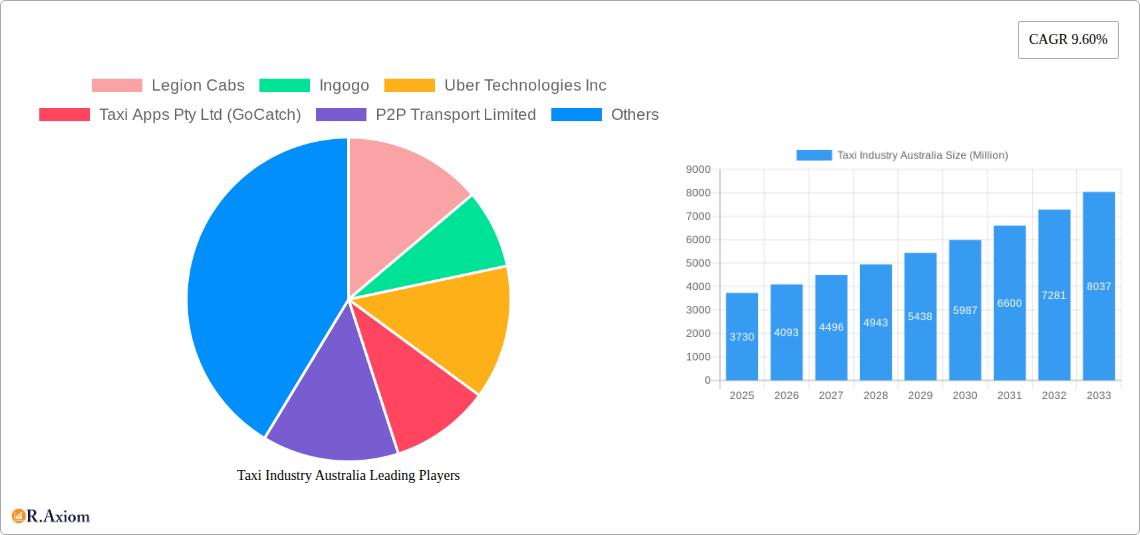
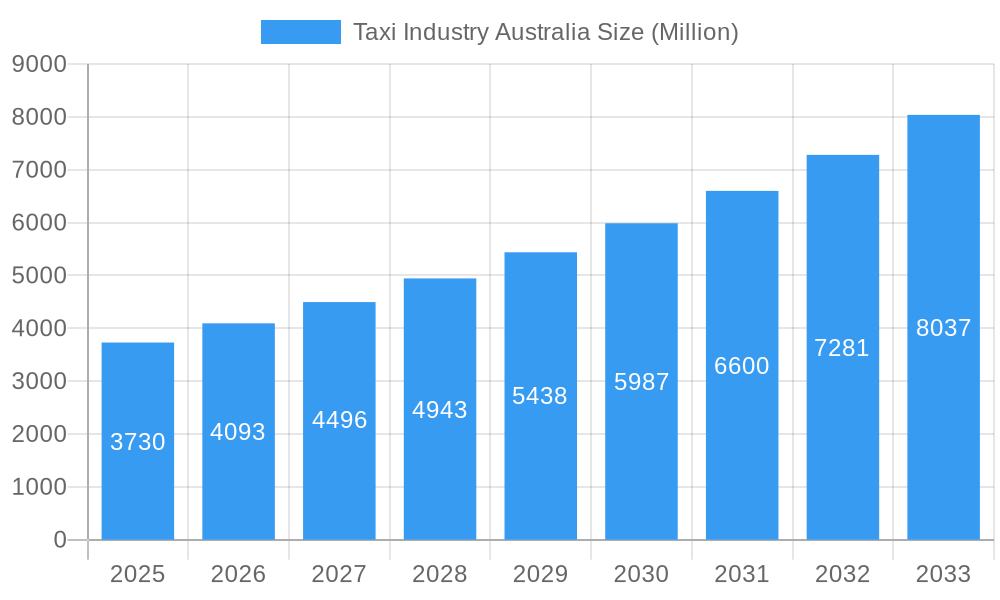
The Australian taxi industry, valued at $3.73 billion in 2025, is experiencing robust growth, projected to expand at a Compound Annual Growth Rate (CAGR) of 9.60% from 2025 to 2033. This growth is fueled by several key factors. Increased urbanization and population growth in major cities like Sydney, Melbourne, and Brisbane are driving demand for convenient and reliable transportation options. The rising adoption of ride-hailing apps like Uber and Ola, alongside established players like GoCatch and Legion Cabs, provides consumers with greater choice and accessibility. Furthermore, technological advancements such as improved GPS navigation, in-app payment systems, and enhanced safety features are enhancing the overall user experience and driving market expansion. The industry is segmented by service type (ride-hailing, ridesharing), booking type (online, offline), and vehicle type (hatchbacks, sedans, SUVs/MPVs), allowing for targeted market penetration and service differentiation. While regulatory changes and intense competition among various players present challenges, the overall outlook for the Australian taxi industry remains positive, underpinned by consistent demand and ongoing technological innovation.
Taxi Industry Australia Market Size (In Billion)
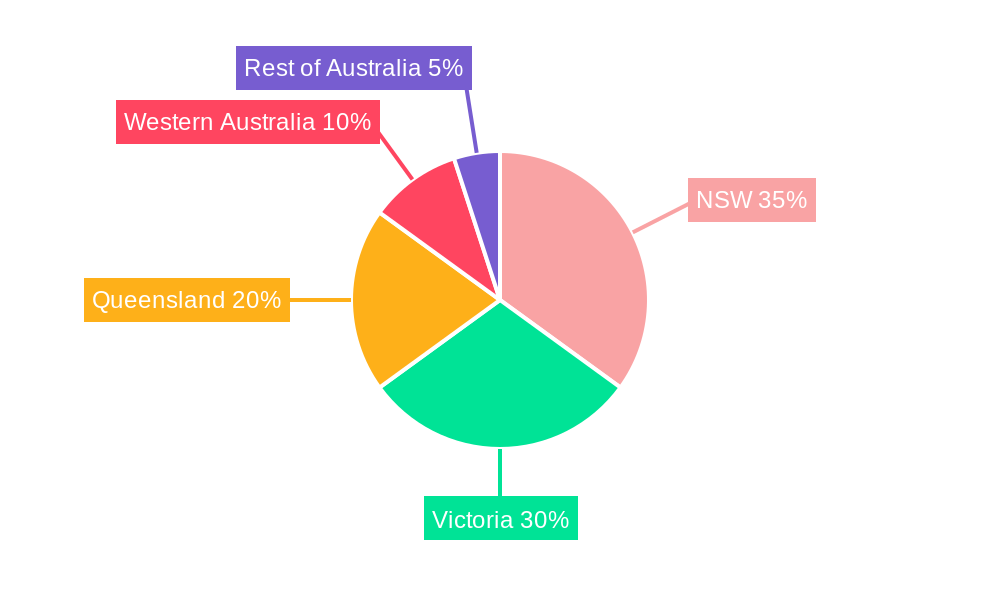
However, the industry faces challenges such as fluctuating fuel prices, stringent government regulations impacting pricing and operations, and the ongoing need to invest in driver training and vehicle maintenance to ensure safety and customer satisfaction. The competitive landscape is dynamic, with established players continually adapting to the presence of international ride-hailing giants. Growth strategies are focusing on enhancing technological capabilities, expanding service offerings (e.g., airport transfers, corporate accounts), and improving customer loyalty programs. Regional variations exist within Australia, with NSW, Victoria, and Queensland representing significant market shares, reflecting population density and economic activity in these regions. The continued focus on improving service quality, technological innovation, and efficient operations will be crucial for players to maintain competitiveness and capitalize on the projected market expansion over the forecast period.
Taxi Industry Australia Company Market Share
Taxi Industry Australia: A Comprehensive Market Report (2019-2033)
This comprehensive report provides an in-depth analysis of the Australian taxi industry, encompassing market trends, competitive dynamics, and future growth prospects. The study period covers 2019-2033, with a base year of 2025 and a forecast period of 2025-2033. The report leverages extensive data from the historical period (2019-2024) and incorporates key industry developments to offer actionable insights for stakeholders. The total market size is estimated at AU$XX Billion in 2025.
Taxi Industry Australia Market Concentration & Innovation
This section analyzes the market concentration, innovation drivers, regulatory landscape, and competitive dynamics within the Australian taxi industry. We examine the market share of key players, including but not limited to Legion Cabs, Ingogo, Uber Technologies Inc, Taxi Apps Pty Ltd (GoCatch), P2P Transport Limited, GM Cabs, Rydo Taxi, Bolt Technology OÜ, A2B Australia Limited, ANI Technologies Pvt Ltd (Ola), and (Didi Chuxing) Beijing Xiaoju Technology Co Ltd. The report further investigates the impact of mergers and acquisitions (M&A) activities on market consolidation, with estimated M&A deal values exceeding AU$XX Billion during the historical period. Innovation is analyzed through the lens of technological advancements, such as the introduction of ride-hailing apps and electric vehicle integration. Regulatory frameworks, including licensing and fare regulations, are examined for their impact on market structure and competition. The analysis also considers the influence of substitute products (e.g., public transportation, ride-sharing services) and evolving consumer preferences on the industry's trajectory.
- Market Share: Uber Technologies Inc holds the largest market share (xx%), followed by [Insert 2nd and 3rd largest companies and their percentages] . The remaining market share is dispersed among numerous smaller players.
- M&A Activity: Significant M&A activity (AU$XX Billion in total deal value from 2019-2024) has led to increased market consolidation.
- Innovation Drivers: Technological advancements, such as the development of sophisticated taxi apps and the adoption of electric vehicles, are primary drivers of innovation.
- Regulatory Framework: The regulatory landscape significantly impacts market access and pricing strategies.
Taxi Industry Australia Industry Trends & Insights
This section provides a detailed examination of the key trends and insights shaping the Australian taxi industry. It delves into market growth drivers, the impact of technological disruptions, evolving consumer preferences, and the intensifying competitive landscape. The compound annual growth rate (CAGR) for the period of 2025-2033 is projected at xx%. Market penetration of online booking is estimated at xx% in 2025, with projections for significant growth driven by the increasing adoption of smartphones and the convenience of digital platforms. The rising popularity of ride-sharing services presents both opportunities and challenges for traditional taxi operators. This analysis also considers the influence of macroeconomic factors and consumer behavior changes.
Dominant Markets & Segments in Taxi Industry Australia
This section identifies the dominant regions, countries, and segments within the Australian taxi market, examining the growth drivers for each.
By Service Type:
- Ride Hailing: Dominated by Uber and other app-based services. Growth is driven by increasing smartphone penetration and consumer preference for convenience.
- Ridesharing: Growing rapidly, particularly in urban areas. Driven by cost-effectiveness and shared-ride options.
By Booking Type:
- Online Booking: Fastest-growing segment, driven by ease of use and widespread smartphone adoption.
- Offline Booking: Still relevant, but market share is gradually declining.
By Vehicle Type:
- Sedans: Remain the most common vehicle type.
- SUVs/MPVs: Growing in popularity due to increased passenger capacity and comfort.
By Country:
- New South Wales (NSW): The largest market, driven by high population density and strong tourism. Key drivers include robust economic policies and a well-developed transportation infrastructure.
- Victoria: A significant market, also characterized by high population density and a well-developed transport network.
- Queensland: Significant market, particularly in major cities.
- Western Australia: Market size is smaller compared to eastern states.
- Rest of Australia: This segment presents significant opportunities for future growth.
Taxi Industry Australia Product Developments
The Australian taxi industry is witnessing significant product innovation, particularly in the realm of technology. Ride-hailing apps provide real-time tracking, fare estimation, and seamless payment options. The integration of electric vehicles is gaining traction, aiming to reduce carbon emissions and offer environmentally friendly transportation solutions. The introduction of hybrid services, such as GM Cab's Taxi-Share 2023, combines the reliability of traditional taxis with the affordability of ride-sharing, catering to diverse consumer needs and creating a competitive advantage.
Report Scope & Segmentation Analysis
This report segments the Australian taxi industry by service type (ride-hailing, ridesharing), booking type (online, offline), vehicle type (hatchbacks, sedans, SUVs/MPVs), and geographic location (NSW, Victoria, Queensland, Western Australia, Rest of Australia). Growth projections are provided for each segment, detailing market size and competitive dynamics. Each segment shows varying growth rates, with online booking and ridesharing exhibiting the fastest expansion.
Key Drivers of Taxi Industry Australia Growth
The growth of the Australian taxi industry is driven by several factors:
- Technological Advancements: The adoption of ride-hailing apps and electric vehicles is significantly impacting the industry.
- Economic Growth: A thriving economy fuels demand for transportation services.
- Regulatory Changes: Favorable regulatory environments can stimulate market expansion.
- Tourism: A growing tourism sector contributes significantly to the demand for taxi services.
Challenges in the Taxi Industry Australia Sector
The Australian taxi industry faces several challenges:
- Regulatory Hurdles: Complex licensing and operational regulations can impede growth.
- Competition: Intense competition from ride-sharing services impacts profitability.
- Rising Fuel Costs: Fluctuating fuel prices affect operational costs.
- Driver Shortages: Attracting and retaining qualified drivers is a significant challenge.
Emerging Opportunities in Taxi Industry Australia
The Australian taxi industry presents various emerging opportunities:
- Autonomous Vehicles: The potential integration of autonomous vehicles could revolutionize the industry.
- Subscription Models: Offering subscription-based services could attract a loyal customer base.
- Expansion into Underserved Markets: Reaching rural and regional areas can unlock significant growth potential.
Leading Players in the Taxi Industry Australia Market
- Legion Cabs
- Ingogo
- Uber Technologies Inc
- Taxi Apps Pty Ltd (GoCatch)
- P2P Transport Limited
- GM Cabs
- Rydo Taxi
- Bolt Technology OÜ
- A2B Australia Limited
- ANI Technologies Pvt Ltd (Ola)
- (Didi Chuxing) Beijing Xiaoju Technology Co Ltd
Key Developments in Taxi Industry Australia Industry
- October 2022: Ingenico and Live Payments partnered to enhance payment solutions for retailers and taxis.
- October 2022: Uber announced the addition of 500 Polestar 2 electric vehicles to its Sydney rideshare fleet, launching its "Custom Electric" service in 2023.
- April 2023: GM Cabs launched Taxi-Share 2023, a hybrid taxi and rideshare service.
Strategic Outlook for Taxi Industry Australia Market
The Australian taxi industry is poised for continued growth, driven by technological advancements, evolving consumer preferences, and the potential for expansion into new markets. The increasing adoption of electric vehicles and the development of innovative service models will shape the industry's future. Opportunities exist in optimizing operations, improving customer experience, and leveraging technology to enhance efficiency and sustainability. The market is expected to reach AU$XX Billion by 2033, reflecting a robust growth trajectory.
Taxi Industry Australia Segmentation
-
1. Service Type
- 1.1. Ride Hailing
- 1.2. Ridesharing
-
2. Booking Type
- 2.1. Online Booking
- 2.2. Offline Booking
-
3. Vehicle Type
- 3.1. Hatchbacks
- 3.2. Sedans
- 3.3. SUVs/MPVs
Taxi Industry Australia Segmentation By Geography
-
1. North America
- 1.1. United States
- 1.2. Canada
- 1.3. Mexico
-
2. South America
- 2.1. Brazil
- 2.2. Argentina
- 2.3. Rest of South America
-
3. Europe
- 3.1. United Kingdom
- 3.2. Germany
- 3.3. France
- 3.4. Italy
- 3.5. Spain
- 3.6. Russia
- 3.7. Benelux
- 3.8. Nordics
- 3.9. Rest of Europe
-
4. Middle East & Africa
- 4.1. Turkey
- 4.2. Israel
- 4.3. GCC
- 4.4. North Africa
- 4.5. South Africa
- 4.6. Rest of Middle East & Africa
-
5. Asia Pacific
- 5.1. China
- 5.2. India
- 5.3. Japan
- 5.4. South Korea
- 5.5. ASEAN
- 5.6. Oceania
- 5.7. Rest of Asia Pacific
Taxi Industry Australia Regional Market Share
Geographic Coverage of Taxi Industry Australia
Taxi Industry Australia REPORT HIGHLIGHTS
| Aspects | Details |
|---|---|
| Study Period | 2020-2034 |
| Base Year | 2025 |
| Estimated Year | 2026 |
| Forecast Period | 2026-2034 |
| Historical Period | 2020-2025 |
| Growth Rate | CAGR of 9.60% from 2020-2034 |
| Segmentation |
|
Table of Contents
- 1. Introduction
- 1.1. Research Scope
- 1.2. Market Segmentation
- 1.3. Research Objective
- 1.4. Definitions and Assumptions
- 2. Executive Summary
- 2.1. Market Snapshot
- 3. Market Dynamics
- 3.1. Market Drivers
- 3.2. Market Restrains
- 3.3. Market Trends
- 3.4. Market Opportunities
- 4. Market Factor Analysis
- 4.1. Porters Five Forces
- 4.1.1. Bargaining Power of Suppliers
- 4.1.2. Bargaining Power of Buyers
- 4.1.3. Threat of New Entrants
- 4.1.4. Threat of Substitutes
- 4.1.5. Competitive Rivalry
- 4.2. PESTEL analysis
- 4.3. BCG Analysis
- 4.3.1. Stars (High Growth, High Market Share)
- 4.3.2. Cash Cows (Low Growth, High Market Share)
- 4.3.3. Question Mark (High Growth, Low Market Share)
- 4.3.4. Dogs (Low Growth, Low Market Share)
- 4.4. Ansoff Matrix Analysis
- 4.5. Supply Chain Analysis
- 4.6. Regulatory Landscape
- 4.7. Current Market Potential and Opportunity Assessment (TAM–SAM–SOM Framework)
- 4.8. RAX Analyst Note
- 4.1. Porters Five Forces
- 5. Market Analysis, Insights and Forecast 2021-2033
- 5.1. Market Analysis, Insights and Forecast - by Service Type
- 5.1.1. Ride Hailing
- 5.1.2. Ridesharing
- 5.2. Market Analysis, Insights and Forecast - by Booking Type
- 5.2.1. Online Booking
- 5.2.2. Offline Booking
- 5.3. Market Analysis, Insights and Forecast - by Vehicle Type
- 5.3.1. Hatchbacks
- 5.3.2. Sedans
- 5.3.3. SUVs/MPVs
- 5.4. Market Analysis, Insights and Forecast - by Region
- 5.4.1. North America
- 5.4.2. South America
- 5.4.3. Europe
- 5.4.4. Middle East & Africa
- 5.4.5. Asia Pacific
- 5.1. Market Analysis, Insights and Forecast - by Service Type
- 6. Global Taxi Industry Australia Analysis, Insights and Forecast, 2021-2033
- 6.1. Market Analysis, Insights and Forecast - by Service Type
- 6.1.1. Ride Hailing
- 6.1.2. Ridesharing
- 6.2. Market Analysis, Insights and Forecast - by Booking Type
- 6.2.1. Online Booking
- 6.2.2. Offline Booking
- 6.3. Market Analysis, Insights and Forecast - by Vehicle Type
- 6.3.1. Hatchbacks
- 6.3.2. Sedans
- 6.3.3. SUVs/MPVs
- 6.1. Market Analysis, Insights and Forecast - by Service Type
- 7. North America Taxi Industry Australia Analysis, Insights and Forecast, 2020-2032
- 7.1. Market Analysis, Insights and Forecast - by Service Type
- 7.1.1. Ride Hailing
- 7.1.2. Ridesharing
- 7.2. Market Analysis, Insights and Forecast - by Booking Type
- 7.2.1. Online Booking
- 7.2.2. Offline Booking
- 7.3. Market Analysis, Insights and Forecast - by Vehicle Type
- 7.3.1. Hatchbacks
- 7.3.2. Sedans
- 7.3.3. SUVs/MPVs
- 7.1. Market Analysis, Insights and Forecast - by Service Type
- 8. South America Taxi Industry Australia Analysis, Insights and Forecast, 2020-2032
- 8.1. Market Analysis, Insights and Forecast - by Service Type
- 8.1.1. Ride Hailing
- 8.1.2. Ridesharing
- 8.2. Market Analysis, Insights and Forecast - by Booking Type
- 8.2.1. Online Booking
- 8.2.2. Offline Booking
- 8.3. Market Analysis, Insights and Forecast - by Vehicle Type
- 8.3.1. Hatchbacks
- 8.3.2. Sedans
- 8.3.3. SUVs/MPVs
- 8.1. Market Analysis, Insights and Forecast - by Service Type
- 9. Europe Taxi Industry Australia Analysis, Insights and Forecast, 2020-2032
- 9.1. Market Analysis, Insights and Forecast - by Service Type
- 9.1.1. Ride Hailing
- 9.1.2. Ridesharing
- 9.2. Market Analysis, Insights and Forecast - by Booking Type
- 9.2.1. Online Booking
- 9.2.2. Offline Booking
- 9.3. Market Analysis, Insights and Forecast - by Vehicle Type
- 9.3.1. Hatchbacks
- 9.3.2. Sedans
- 9.3.3. SUVs/MPVs
- 9.1. Market Analysis, Insights and Forecast - by Service Type
- 10. Middle East & Africa Taxi Industry Australia Analysis, Insights and Forecast, 2020-2032
- 10.1. Market Analysis, Insights and Forecast - by Service Type
- 10.1.1. Ride Hailing
- 10.1.2. Ridesharing
- 10.2. Market Analysis, Insights and Forecast - by Booking Type
- 10.2.1. Online Booking
- 10.2.2. Offline Booking
- 10.3. Market Analysis, Insights and Forecast - by Vehicle Type
- 10.3.1. Hatchbacks
- 10.3.2. Sedans
- 10.3.3. SUVs/MPVs
- 10.1. Market Analysis, Insights and Forecast - by Service Type
- 11. Asia Pacific Taxi Industry Australia Analysis, Insights and Forecast, 2020-2032
- 11.1. Market Analysis, Insights and Forecast - by Service Type
- 11.1.1. Ride Hailing
- 11.1.2. Ridesharing
- 11.2. Market Analysis, Insights and Forecast - by Booking Type
- 11.2.1. Online Booking
- 11.2.2. Offline Booking
- 11.3. Market Analysis, Insights and Forecast - by Vehicle Type
- 11.3.1. Hatchbacks
- 11.3.2. Sedans
- 11.3.3. SUVs/MPVs
- 11.1. Market Analysis, Insights and Forecast - by Service Type
- 12. Competitive Analysis
- 12.1. Company Profiles
- 12.1.1 Legion Cabs
- 12.1.1.1. Company Overview
- 12.1.1.2. Products
- 12.1.1.3. Company Financials
- 12.1.1.4. SWOT Analysis
- 12.1.2 Ingogo
- 12.1.2.1. Company Overview
- 12.1.2.2. Products
- 12.1.2.3. Company Financials
- 12.1.2.4. SWOT Analysis
- 12.1.3 Uber Technologies Inc
- 12.1.3.1. Company Overview
- 12.1.3.2. Products
- 12.1.3.3. Company Financials
- 12.1.3.4. SWOT Analysis
- 12.1.4 Taxi Apps Pty Ltd (GoCatch)
- 12.1.4.1. Company Overview
- 12.1.4.2. Products
- 12.1.4.3. Company Financials
- 12.1.4.4. SWOT Analysis
- 12.1.5 P2P Transport Limited
- 12.1.5.1. Company Overview
- 12.1.5.2. Products
- 12.1.5.3. Company Financials
- 12.1.5.4. SWOT Analysis
- 12.1.6 GM Cabs
- 12.1.6.1. Company Overview
- 12.1.6.2. Products
- 12.1.6.3. Company Financials
- 12.1.6.4. SWOT Analysis
- 12.1.7 Rydo Taxi
- 12.1.7.1. Company Overview
- 12.1.7.2. Products
- 12.1.7.3. Company Financials
- 12.1.7.4. SWOT Analysis
- 12.1.8 Bolt Technology OÜ
- 12.1.8.1. Company Overview
- 12.1.8.2. Products
- 12.1.8.3. Company Financials
- 12.1.8.4. SWOT Analysis
- 12.1.9 A2B Australia Limited
- 12.1.9.1. Company Overview
- 12.1.9.2. Products
- 12.1.9.3. Company Financials
- 12.1.9.4. SWOT Analysis
- 12.1.10 ANI Technologies Pvt Ltd (Ola)
- 12.1.10.1. Company Overview
- 12.1.10.2. Products
- 12.1.10.3. Company Financials
- 12.1.10.4. SWOT Analysis
- 12.1.11 (Didi Chuxing) Beijing Xiaoju Technology Co Ltd *List Not Exhaustive
- 12.1.11.1. Company Overview
- 12.1.11.2. Products
- 12.1.11.3. Company Financials
- 12.1.11.4. SWOT Analysis
- 12.1.1 Legion Cabs
- 12.2. Market Entropy
- 12.2.1 Company's Key Areas Served
- 12.2.2 Recent Developments
- 12.3. Company Market Share Analysis 2025
- 12.3.1 Top 5 Companies Market Share Analysis
- 12.3.2 Top 3 Companies Market Share Analysis
- 12.4. List of Potential Customers
- 13. Research Methodology
List of Figures
- Figure 1: Global Taxi Industry Australia Revenue Breakdown (Million, %) by Region 2025 & 2033
- Figure 2: North America Taxi Industry Australia Revenue (Million), by Service Type 2025 & 2033
- Figure 3: North America Taxi Industry Australia Revenue Share (%), by Service Type 2025 & 2033
- Figure 4: North America Taxi Industry Australia Revenue (Million), by Booking Type 2025 & 2033
- Figure 5: North America Taxi Industry Australia Revenue Share (%), by Booking Type 2025 & 2033
- Figure 6: North America Taxi Industry Australia Revenue (Million), by Vehicle Type 2025 & 2033
- Figure 7: North America Taxi Industry Australia Revenue Share (%), by Vehicle Type 2025 & 2033
- Figure 8: North America Taxi Industry Australia Revenue (Million), by Country 2025 & 2033
- Figure 9: North America Taxi Industry Australia Revenue Share (%), by Country 2025 & 2033
- Figure 10: South America Taxi Industry Australia Revenue (Million), by Service Type 2025 & 2033
- Figure 11: South America Taxi Industry Australia Revenue Share (%), by Service Type 2025 & 2033
- Figure 12: South America Taxi Industry Australia Revenue (Million), by Booking Type 2025 & 2033
- Figure 13: South America Taxi Industry Australia Revenue Share (%), by Booking Type 2025 & 2033
- Figure 14: South America Taxi Industry Australia Revenue (Million), by Vehicle Type 2025 & 2033
- Figure 15: South America Taxi Industry Australia Revenue Share (%), by Vehicle Type 2025 & 2033
- Figure 16: South America Taxi Industry Australia Revenue (Million), by Country 2025 & 2033
- Figure 17: South America Taxi Industry Australia Revenue Share (%), by Country 2025 & 2033
- Figure 18: Europe Taxi Industry Australia Revenue (Million), by Service Type 2025 & 2033
- Figure 19: Europe Taxi Industry Australia Revenue Share (%), by Service Type 2025 & 2033
- Figure 20: Europe Taxi Industry Australia Revenue (Million), by Booking Type 2025 & 2033
- Figure 21: Europe Taxi Industry Australia Revenue Share (%), by Booking Type 2025 & 2033
- Figure 22: Europe Taxi Industry Australia Revenue (Million), by Vehicle Type 2025 & 2033
- Figure 23: Europe Taxi Industry Australia Revenue Share (%), by Vehicle Type 2025 & 2033
- Figure 24: Europe Taxi Industry Australia Revenue (Million), by Country 2025 & 2033
- Figure 25: Europe Taxi Industry Australia Revenue Share (%), by Country 2025 & 2033
- Figure 26: Middle East & Africa Taxi Industry Australia Revenue (Million), by Service Type 2025 & 2033
- Figure 27: Middle East & Africa Taxi Industry Australia Revenue Share (%), by Service Type 2025 & 2033
- Figure 28: Middle East & Africa Taxi Industry Australia Revenue (Million), by Booking Type 2025 & 2033
- Figure 29: Middle East & Africa Taxi Industry Australia Revenue Share (%), by Booking Type 2025 & 2033
- Figure 30: Middle East & Africa Taxi Industry Australia Revenue (Million), by Vehicle Type 2025 & 2033
- Figure 31: Middle East & Africa Taxi Industry Australia Revenue Share (%), by Vehicle Type 2025 & 2033
- Figure 32: Middle East & Africa Taxi Industry Australia Revenue (Million), by Country 2025 & 2033
- Figure 33: Middle East & Africa Taxi Industry Australia Revenue Share (%), by Country 2025 & 2033
- Figure 34: Asia Pacific Taxi Industry Australia Revenue (Million), by Service Type 2025 & 2033
- Figure 35: Asia Pacific Taxi Industry Australia Revenue Share (%), by Service Type 2025 & 2033
- Figure 36: Asia Pacific Taxi Industry Australia Revenue (Million), by Booking Type 2025 & 2033
- Figure 37: Asia Pacific Taxi Industry Australia Revenue Share (%), by Booking Type 2025 & 2033
- Figure 38: Asia Pacific Taxi Industry Australia Revenue (Million), by Vehicle Type 2025 & 2033
- Figure 39: Asia Pacific Taxi Industry Australia Revenue Share (%), by Vehicle Type 2025 & 2033
- Figure 40: Asia Pacific Taxi Industry Australia Revenue (Million), by Country 2025 & 2033
- Figure 41: Asia Pacific Taxi Industry Australia Revenue Share (%), by Country 2025 & 2033
List of Tables
- Table 1: Global Taxi Industry Australia Revenue Million Forecast, by Service Type 2020 & 2033
- Table 2: Global Taxi Industry Australia Revenue Million Forecast, by Booking Type 2020 & 2033
- Table 3: Global Taxi Industry Australia Revenue Million Forecast, by Vehicle Type 2020 & 2033
- Table 4: Global Taxi Industry Australia Revenue Million Forecast, by Region 2020 & 2033
- Table 5: Global Taxi Industry Australia Revenue Million Forecast, by Service Type 2020 & 2033
- Table 6: Global Taxi Industry Australia Revenue Million Forecast, by Booking Type 2020 & 2033
- Table 7: Global Taxi Industry Australia Revenue Million Forecast, by Vehicle Type 2020 & 2033
- Table 8: Global Taxi Industry Australia Revenue Million Forecast, by Country 2020 & 2033
- Table 9: United States Taxi Industry Australia Revenue (Million) Forecast, by Application 2020 & 2033
- Table 10: Canada Taxi Industry Australia Revenue (Million) Forecast, by Application 2020 & 2033
- Table 11: Mexico Taxi Industry Australia Revenue (Million) Forecast, by Application 2020 & 2033
- Table 12: Global Taxi Industry Australia Revenue Million Forecast, by Service Type 2020 & 2033
- Table 13: Global Taxi Industry Australia Revenue Million Forecast, by Booking Type 2020 & 2033
- Table 14: Global Taxi Industry Australia Revenue Million Forecast, by Vehicle Type 2020 & 2033
- Table 15: Global Taxi Industry Australia Revenue Million Forecast, by Country 2020 & 2033
- Table 16: Brazil Taxi Industry Australia Revenue (Million) Forecast, by Application 2020 & 2033
- Table 17: Argentina Taxi Industry Australia Revenue (Million) Forecast, by Application 2020 & 2033
- Table 18: Rest of South America Taxi Industry Australia Revenue (Million) Forecast, by Application 2020 & 2033
- Table 19: Global Taxi Industry Australia Revenue Million Forecast, by Service Type 2020 & 2033
- Table 20: Global Taxi Industry Australia Revenue Million Forecast, by Booking Type 2020 & 2033
- Table 21: Global Taxi Industry Australia Revenue Million Forecast, by Vehicle Type 2020 & 2033
- Table 22: Global Taxi Industry Australia Revenue Million Forecast, by Country 2020 & 2033
- Table 23: United Kingdom Taxi Industry Australia Revenue (Million) Forecast, by Application 2020 & 2033
- Table 24: Germany Taxi Industry Australia Revenue (Million) Forecast, by Application 2020 & 2033
- Table 25: France Taxi Industry Australia Revenue (Million) Forecast, by Application 2020 & 2033
- Table 26: Italy Taxi Industry Australia Revenue (Million) Forecast, by Application 2020 & 2033
- Table 27: Spain Taxi Industry Australia Revenue (Million) Forecast, by Application 2020 & 2033
- Table 28: Russia Taxi Industry Australia Revenue (Million) Forecast, by Application 2020 & 2033
- Table 29: Benelux Taxi Industry Australia Revenue (Million) Forecast, by Application 2020 & 2033
- Table 30: Nordics Taxi Industry Australia Revenue (Million) Forecast, by Application 2020 & 2033
- Table 31: Rest of Europe Taxi Industry Australia Revenue (Million) Forecast, by Application 2020 & 2033
- Table 32: Global Taxi Industry Australia Revenue Million Forecast, by Service Type 2020 & 2033
- Table 33: Global Taxi Industry Australia Revenue Million Forecast, by Booking Type 2020 & 2033
- Table 34: Global Taxi Industry Australia Revenue Million Forecast, by Vehicle Type 2020 & 2033
- Table 35: Global Taxi Industry Australia Revenue Million Forecast, by Country 2020 & 2033
- Table 36: Turkey Taxi Industry Australia Revenue (Million) Forecast, by Application 2020 & 2033
- Table 37: Israel Taxi Industry Australia Revenue (Million) Forecast, by Application 2020 & 2033
- Table 38: GCC Taxi Industry Australia Revenue (Million) Forecast, by Application 2020 & 2033
- Table 39: North Africa Taxi Industry Australia Revenue (Million) Forecast, by Application 2020 & 2033
- Table 40: South Africa Taxi Industry Australia Revenue (Million) Forecast, by Application 2020 & 2033
- Table 41: Rest of Middle East & Africa Taxi Industry Australia Revenue (Million) Forecast, by Application 2020 & 2033
- Table 42: Global Taxi Industry Australia Revenue Million Forecast, by Service Type 2020 & 2033
- Table 43: Global Taxi Industry Australia Revenue Million Forecast, by Booking Type 2020 & 2033
- Table 44: Global Taxi Industry Australia Revenue Million Forecast, by Vehicle Type 2020 & 2033
- Table 45: Global Taxi Industry Australia Revenue Million Forecast, by Country 2020 & 2033
- Table 46: China Taxi Industry Australia Revenue (Million) Forecast, by Application 2020 & 2033
- Table 47: India Taxi Industry Australia Revenue (Million) Forecast, by Application 2020 & 2033
- Table 48: Japan Taxi Industry Australia Revenue (Million) Forecast, by Application 2020 & 2033
- Table 49: South Korea Taxi Industry Australia Revenue (Million) Forecast, by Application 2020 & 2033
- Table 50: ASEAN Taxi Industry Australia Revenue (Million) Forecast, by Application 2020 & 2033
- Table 51: Oceania Taxi Industry Australia Revenue (Million) Forecast, by Application 2020 & 2033
- Table 52: Rest of Asia Pacific Taxi Industry Australia Revenue (Million) Forecast, by Application 2020 & 2033
Frequently Asked Questions
1. What is the projected Compound Annual Growth Rate (CAGR) of the Taxi Industry Australia?
The projected CAGR is approximately 9.60%.
2. Which companies are prominent players in the Taxi Industry Australia?
Key companies in the market include Legion Cabs, Ingogo, Uber Technologies Inc, Taxi Apps Pty Ltd (GoCatch), P2P Transport Limited, GM Cabs, Rydo Taxi, Bolt Technology OÜ, A2B Australia Limited, ANI Technologies Pvt Ltd (Ola), (Didi Chuxing) Beijing Xiaoju Technology Co Ltd *List Not Exhaustive.
3. What are the main segments of the Taxi Industry Australia?
The market segments include Service Type, Booking Type, Vehicle Type.
4. Can you provide details about the market size?
The market size is estimated to be USD 3.73 Million as of 2022.
5. What are some drivers contributing to market growth?
Growing Tourism Industry in Australia.
6. What are the notable trends driving market growth?
Online Booking Holds the Highest Share.
7. Are there any restraints impacting market growth?
Varying Government Regulations on Taxi Services.
8. Can you provide examples of recent developments in the market?
October 2022: Ingenico, the most trusted technological partner for payment acceptance, and Live Payments, one of Australia's leading payment service providers, announced their cooperation for long-term strategic partnerships to equip retailers and taxis with seamless and convenient payment and commerce solutions.
9. What pricing options are available for accessing the report?
Pricing options include single-user, multi-user, and enterprise licenses priced at USD 3800, USD 4500, and USD 5800 respectively.
10. Is the market size provided in terms of value or volume?
The market size is provided in terms of value, measured in Million.
11. Are there any specific market keywords associated with the report?
Yes, the market keyword associated with the report is "Taxi Industry Australia," which aids in identifying and referencing the specific market segment covered.
12. How do I determine which pricing option suits my needs best?
The pricing options vary based on user requirements and access needs. Individual users may opt for single-user licenses, while businesses requiring broader access may choose multi-user or enterprise licenses for cost-effective access to the report.
13. Are there any additional resources or data provided in the Taxi Industry Australia report?
While the report offers comprehensive insights, it's advisable to review the specific contents or supplementary materials provided to ascertain if additional resources or data are available.
14. How can I stay updated on further developments or reports in the Taxi Industry Australia?
To stay informed about further developments, trends, and reports in the Taxi Industry Australia, consider subscribing to industry newsletters, following relevant companies and organizations, or regularly checking reputable industry news sources and publications.
Methodology
Step 1 - Identification of Relevant Samples Size from Population Database


Step 2 - Approaches for Defining Global Market Size (Value, Volume* & Price*)

Note*: In applicable scenarios
Step 3 - Data Sources
Primary Research
- Web Analytics
- Survey Reports
- Research Institute
- Latest Research Reports
- Opinion Leaders
Secondary Research
- Annual Reports
- White Paper
- Latest Press Release
- Industry Association
- Paid Database
- Investor Presentations

Step 4 - Data Triangulation
Involves using different sources of information in order to increase the validity of a study
These sources are likely to be stakeholders in a program - participants, other researchers, program staff, other community members, and so on.
Then we put all data in single framework & apply various statistical tools to find out the dynamic on the market.
During the analysis stage, feedback from the stakeholder groups would be compared to determine areas of agreement as well as areas of divergence

