
Key Insights
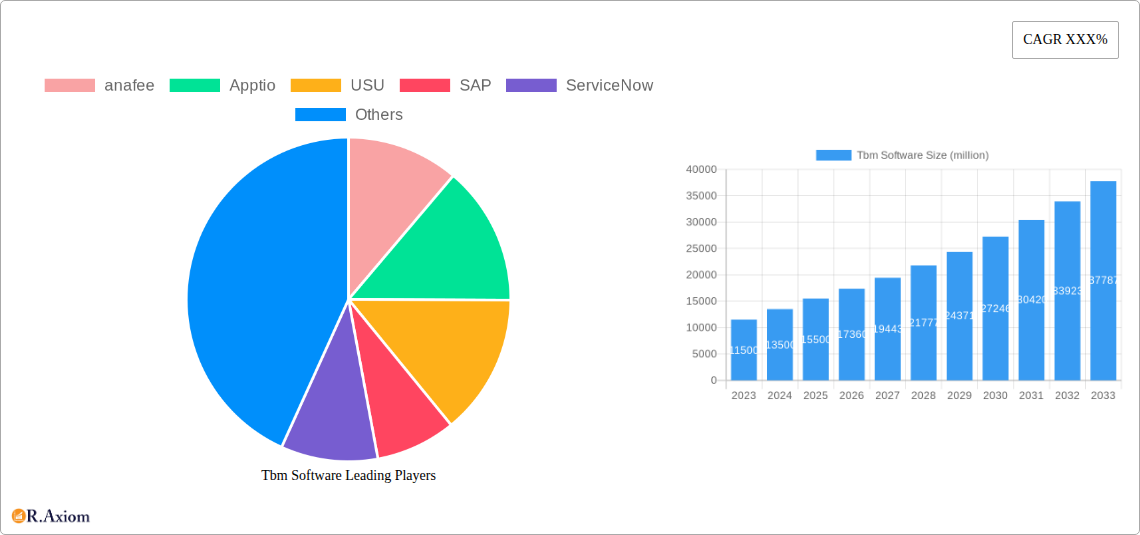
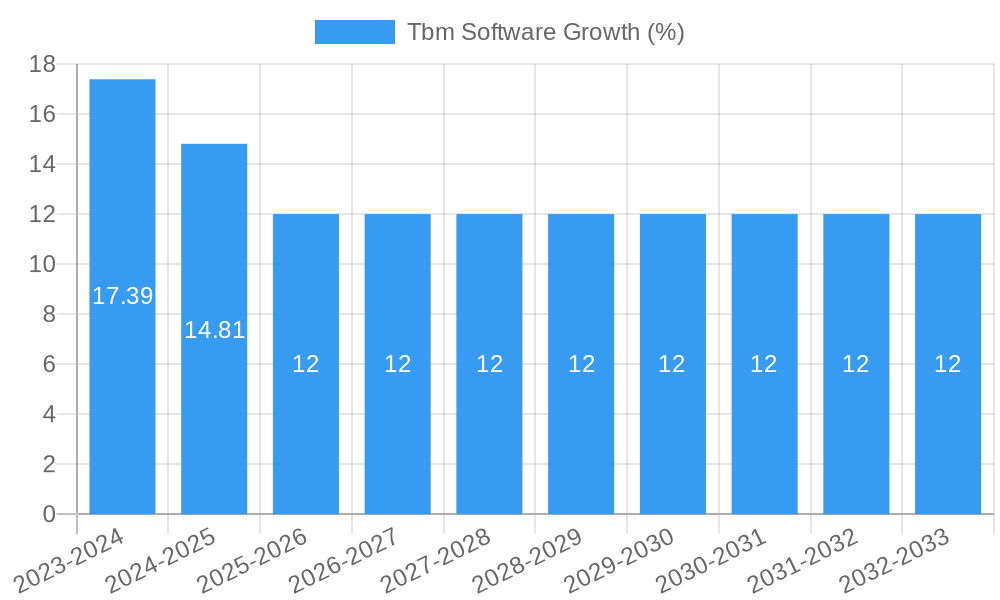
The Technology Business Management (TBM) software market is poised for substantial growth, projected to reach approximately $15,500 million by 2025. This expansion is driven by an estimated Compound Annual Growth Rate (CAGR) of around 12% throughout the forecast period of 2025-2033. The increasing need for enterprises to optimize IT spending, enhance financial transparency, and demonstrate the value of technology investments are key catalysts for this upward trajectory. As businesses navigate complex digital transformations, TBM solutions are becoming indispensable for aligning IT strategy with business objectives. The software enables organizations to gain granular insights into IT costs, performance, and resource allocation, thereby facilitating better decision-making and driving operational efficiencies. This heightened focus on data-driven IT management is a primary driver, allowing companies to move from reactive cost management to proactive strategic planning.
The market is characterized by a dynamic interplay of trends and restraints. Emerging trends include the growing adoption of cloud-based TBM solutions, offering scalability and flexibility, and the integration of AI and machine learning to provide predictive analytics and automated insights. The increasing demand from Small and Medium Enterprises (SMEs) for accessible and affordable TBM tools, alongside continued adoption by Large Enterprises, signifies a broadening market base. However, challenges such as the complexity of TBM implementation, the need for specialized skill sets, and concerns regarding data security and privacy can act as restraints. Nevertheless, the persistent drive for IT cost reduction, improved service delivery, and the necessity to quantify the ROI of technology initiatives are expected to outweigh these challenges, ensuring robust market expansion.
Tbm Software Market Concentration & Innovation
The TBM Software market is characterized by a dynamic interplay of established leaders and emerging innovators. Market concentration remains moderate, with a significant portion of the market share held by key players including ServiceNow, SAP, and BMC, each commanding an estimated market share of 15-20%. Apptio and USU follow closely, with market shares around 8-12%. Innovation is primarily driven by advancements in Artificial Intelligence (AI) and Machine Learning (ML) for predictive analytics, enhanced automation, and more sophisticated cost management capabilities. Regulatory frameworks, while not directly stifling innovation, necessitate adherence to data privacy and security standards, influencing product development. The emergence of robust product substitutes, such as advanced ERP modules and specialized financial planning tools, presents a competitive challenge, pushing TBM software providers to continually enhance their feature sets. End-user trends are heavily skewed towards cloud-based solutions, driven by the need for scalability, flexibility, and cost-effectiveness. Mergers and acquisitions (M&A) are a significant aspect of market evolution, with an estimated aggregate deal value exceeding 500 million over the historical period, aiming to consolidate market position and acquire innovative technologies. For instance, recent acquisitions by larger players have focused on bolstering AI capabilities and expanding their cloud offerings.
Tbm Software Industry Trends & Insights
The TBM Software industry is poised for substantial growth, projected to expand at a Compound Annual Growth Rate (CAGR) of approximately 15% from 2025 to 2033. This robust expansion is underpinned by several key market growth drivers. The increasing complexity of IT landscapes and the growing demand for demonstrable IT value are compelling organizations to adopt TBM solutions for better financial transparency and decision-making. Technological disruptions are at the forefront, with AI and ML revolutionizing how organizations manage and optimize their technology spend. These technologies enable predictive cost modeling, automated resource allocation, and real-time performance monitoring, leading to significant efficiency gains. Consumer preferences are rapidly shifting towards integrated, user-friendly cloud-based platforms that offer comprehensive insights and actionable recommendations. The emphasis is on solutions that can seamlessly integrate with existing IT infrastructure and provide a holistic view of technology investments. Competitive dynamics are intensifying, with both established players and nimble startups vying for market share. Strategic partnerships and alliances are becoming crucial for companies to expand their reach and offer comprehensive solutions. The market penetration of TBM software is steadily increasing across all enterprise segments, driven by a growing awareness of its strategic importance. The shift from a cost-centric to a value-centric IT management approach is a defining trend, with TBM software acting as a critical enabler. Furthermore, the increasing adoption of hybrid cloud and multi-cloud environments necessitates sophisticated TBM tools to manage costs and optimize performance across diverse infrastructures. The evolving digital transformation initiatives within organizations are further amplifying the need for robust TBM solutions to ensure that technology investments align with business objectives and deliver measurable ROI. The industry's ability to adapt to these evolving technological and business landscapes will be paramount for sustained growth and market leadership.
Dominant Markets & Segments in Tbm Software
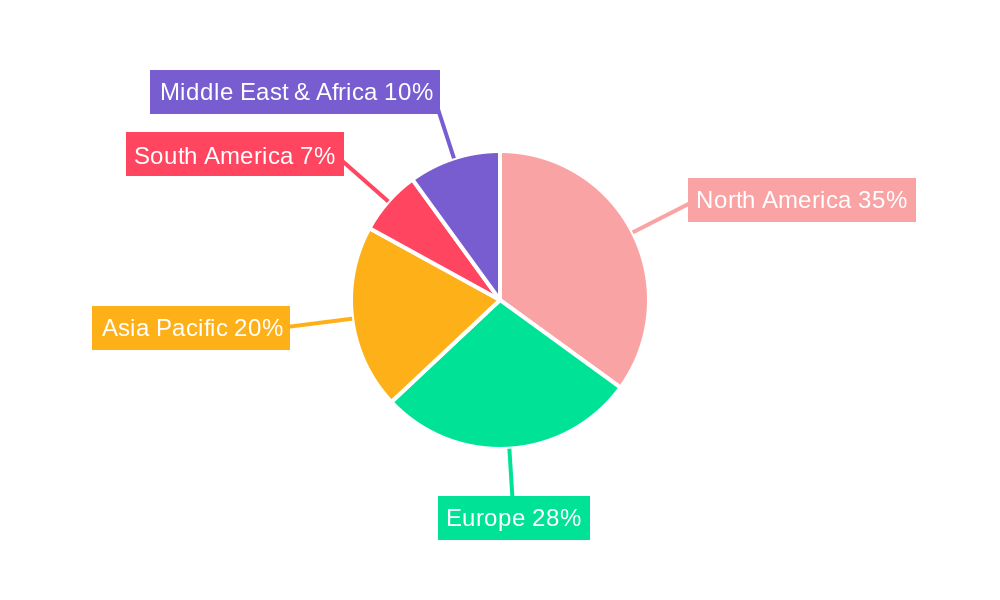
The TBM Software market exhibits distinct regional dominance and segment preferences. North America currently leads the market, accounting for an estimated 40% of global revenue, driven by the presence of a large number of technology-forward enterprises and significant investment in digital transformation initiatives. The United States, in particular, is a powerhouse, owing to its concentration of Fortune 500 companies and a mature IT services ecosystem. Asia Pacific is emerging as a high-growth region, with a projected CAGR of 18% during the forecast period, fueled by rapid digitalization and increasing adoption of cloud technologies in countries like China and India.
The Large Enterprise segment is the dominant force within the application type, representing approximately 70% of the total market. This dominance is attributable to the complex IT environments, substantial technology budgets, and the critical need for comprehensive cost optimization and value realization that large organizations possess. These enterprises often have multi-million dollar IT investments that require sophisticated management tools to ensure financial accountability and strategic alignment. Key drivers for this segment include:
- Stringent Compliance and Governance Requirements: Large enterprises face considerable regulatory scrutiny, necessitating robust TBM solutions for transparent reporting and audit trails.
- Complex IT Architectures: Managing diverse and often legacy IT infrastructures demands advanced capabilities for cost allocation and performance tracking.
- Strategic IT Investment Decisions: Large-scale technology initiatives require data-driven insights to justify investments and maximize ROI, making TBM software indispensable for informed decision-making.
In terms of deployment type, Cloud-Based solutions are rapidly eclipsing On-Premise offerings, capturing an estimated 75% of the market share by 2025. This shift is driven by:
- Scalability and Flexibility: Cloud solutions offer unparalleled ability to scale resources up or down based on demand, accommodating fluctuating business needs without significant upfront infrastructure investment.
- Cost-Effectiveness: Reduced capital expenditure on hardware and maintenance, coupled with predictable subscription-based pricing models, makes cloud solutions more financially attractive.
- Faster Deployment and Updates: Cloud platforms enable quicker implementation and continuous updates, ensuring users have access to the latest features and security patches without extensive IT involvement.
- Accessibility and Collaboration: Cloud-based TBM software facilitates remote access and enhanced collaboration among distributed teams, crucial in today's globalized business environment.
The adoption of TBM software within Small and Medium Enterprises (SMEs) is also growing, albeit at a slower pace, driven by the availability of more affordable and accessible cloud-based solutions. As SMEs increasingly recognize the importance of optimizing their technology spend to remain competitive, their market share is expected to expand significantly in the coming years. Economic policies promoting digital adoption and the availability of flexible SaaS models are key enablers for this segment.
Tbm Software Product Developments
Recent product developments in the TBM Software market are heavily focused on enhancing predictive analytics and AI-driven insights. Companies are integrating advanced machine learning algorithms to forecast technology costs with greater accuracy, identify cost-saving opportunities proactively, and optimize resource allocation across complex hybrid cloud environments. Competitive advantages are being built around seamless integration with a wider array of IT service management (ITSM) and financial systems, providing a unified view of technology investments. Enhanced dashboards, customizable reporting features, and intuitive user interfaces are also key trends, improving user adoption and enabling faster, more informed decision-making.
Tbm Software Scope & Segmentation Analysis
The TBM Software market is segmented by Application into SME (Small and Medium Enterprises) and Large Enterprise. The Large Enterprise segment is expected to maintain its dominance, projected to hold a market size of over 800 million by 2025, driven by complex IT needs and significant investment capacity. The SME segment, while smaller, is experiencing robust growth, with projections indicating a market size exceeding 300 million by 2025, due to increased accessibility and cloud adoption.
Segmentation by Type includes On-Premise and Cloud-Based solutions. The Cloud-Based segment is the clear leader, forecast to reach a market size of over 1.1 billion by 2025, driven by its inherent scalability, cost-effectiveness, and ease of deployment. The On-Premise segment, while still relevant for specific security-conscious enterprises, is expected to see a gradual decline in market share, with a projected market size of around 300 million by 2025.
Key Drivers of Tbm Software Growth
The growth of the TBM Software market is propelled by several critical factors. Firstly, the escalating complexity of IT environments and the burgeoning digital transformation initiatives within organizations necessitate robust tools for managing and optimizing technology spend. Secondly, the increasing demand for transparency and accountability in IT investments, driven by economic pressures and the need to demonstrate ROI, makes TBM solutions indispensable. Thirdly, advancements in AI and Machine Learning are enabling more sophisticated predictive analytics, cost optimization, and automated resource allocation, enhancing the value proposition of TBM software. The shift towards cloud computing further fuels adoption, offering scalability, flexibility, and cost efficiencies that align perfectly with TBM software's capabilities. Regulatory compliance requirements related to data security and financial reporting also play a role, pushing organizations to adopt TBM solutions that provide clear audit trails and comprehensive cost allocation.
Challenges in the Tbm Software Sector
Despite its growth trajectory, the TBM Software sector faces significant challenges. One primary restraint is the complexity of integration with diverse and often disparate IT systems within large organizations, which can lead to implementation delays and increased costs. Resistance to change and a lack of executive sponsorship can also hinder adoption, as TBM requires a shift in organizational mindset towards data-driven IT financial management. Data accuracy and quality are paramount for effective TBM, and organizations often struggle with inconsistent or incomplete data, leading to unreliable insights. Furthermore, the perceived high cost of sophisticated TBM solutions can be a barrier, especially for SMEs, though this is being mitigated by the rise of more affordable SaaS offerings. Intense competitive pressure from established players and emerging niche providers also necessitates continuous innovation and competitive pricing strategies.
Emerging Opportunities in Tbm Software
Emerging opportunities in the TBM Software market are abundant, driven by evolving technological landscapes and business needs. The increasing adoption of hybrid and multi-cloud environments presents a significant opportunity for TBM solutions that can provide unified visibility and cost management across these complex infrastructures. The burgeoning field of FinOps (Cloud Financial Operations) is creating a demand for specialized TBM tools that focus on optimizing cloud spend. Furthermore, the integration of extended reality (XR) and advanced visualization techniques offers potential for more intuitive and engaging ways to present TBM data. As organizations increasingly prioritize sustainability and environmental impact, TBM software that can track and optimize the IT carbon footprint presents a new avenue for growth. The demand for AI-powered automation in IT financial processes, from budgeting to forecasting, will continue to be a key area of development and opportunity.
Leading Players in the Tbm Software Market
- ServiceNow
- SAP
- BMC
- Apptio
- USU
- Upland
- Micro Focus
- VMWare
- CA
Key Developments in Tbm Software Industry
- 2023 Q4: ServiceNow enhances its IT Financial Management (ITFM) suite with advanced AI capabilities for predictive cost analysis.
- 2024 Q1: SAP releases a new module for its S/4HANA suite focused on cloud cost optimization and TBM insights.
- 2024 Q2: BMC integrates machine learning into its TrueSight platform to automate IT cost allocation and anomaly detection.
- 2024 Q3: Apptio acquires a niche analytics startup to bolster its capabilities in cloud FinOps and cost governance.
- 2024 Q4: USU announces strategic partnerships with major cloud service providers to streamline cloud TBM for its customers.
- 2025 Q1: Micro Focus enhances its IT operations management solutions with improved TBM reporting and integration capabilities.
- 2025 Q2: VMWare expands its TBM offerings for multi-cloud environments, focusing on performance optimization and cost transparency.
- 2025 Q3: Upland announces a series of product enhancements to its TBM suite, focusing on user experience and advanced reporting.
- 2025 Q4: CA (now part of Broadcom) rolls out new features for its enterprise asset management solutions, including enhanced TBM reporting.
Strategic Outlook for Tbm Software Market
The strategic outlook for the TBM Software market is overwhelmingly positive, with sustained growth anticipated throughout the forecast period. The increasing recognition of TBM as a critical strategic discipline for optimizing technology investments and driving business value will continue to fuel demand. Key growth catalysts include the ongoing digital transformation of enterprises, the widespread adoption of cloud computing, and the relentless pursuit of operational efficiency. The integration of advanced AI and ML capabilities will further solidify the indispensable nature of TBM software in enabling data-driven decision-making. Opportunities for market expansion lie in catering to the specific needs of SMEs, developing specialized solutions for FinOps, and leveraging emerging technologies like XR for enhanced user engagement. The market's evolution will be shaped by continuous innovation, strategic partnerships, and the ability of vendors to provide comprehensive, integrated solutions that address the complex challenges of modern IT financial management.
Tbm Software Segmentation
-
1. Application
- 1.1. SME (Small and Medium Enterprises)
- 1.2. Large Enterprise
-
2. Type
- 2.1. On-Premise
- 2.2. Cloud-Based
Tbm Software Segmentation By Geography
-
1. North America
- 1.1. United States
- 1.2. Canada
- 1.3. Mexico
-
2. South America
- 2.1. Brazil
- 2.2. Argentina
- 2.3. Rest of South America
-
3. Europe
- 3.1. United Kingdom
- 3.2. Germany
- 3.3. France
- 3.4. Italy
- 3.5. Spain
- 3.6. Russia
- 3.7. Benelux
- 3.8. Nordics
- 3.9. Rest of Europe
-
4. Middle East & Africa
- 4.1. Turkey
- 4.2. Israel
- 4.3. GCC
- 4.4. North Africa
- 4.5. South Africa
- 4.6. Rest of Middle East & Africa
-
5. Asia Pacific
- 5.1. China
- 5.2. India
- 5.3. Japan
- 5.4. South Korea
- 5.5. ASEAN
- 5.6. Oceania
- 5.7. Rest of Asia Pacific
Tbm Software REPORT HIGHLIGHTS
| Aspects | Details |
|---|---|
| Study Period | 2019-2033 |
| Base Year | 2024 |
| Estimated Year | 2025 |
| Forecast Period | 2025-2033 |
| Historical Period | 2019-2024 |
| Growth Rate | CAGR of XXX% from 2019-2033 |
| Segmentation |
|
Table of Contents
- 1. Introduction
- 1.1. Research Scope
- 1.2. Market Segmentation
- 1.3. Research Methodology
- 1.4. Definitions and Assumptions
- 2. Executive Summary
- 2.1. Introduction
- 3. Market Dynamics
- 3.1. Introduction
- 3.2. Market Drivers
- 3.3. Market Restrains
- 3.4. Market Trends
- 4. Market Factor Analysis
- 4.1. Porters Five Forces
- 4.2. Supply/Value Chain
- 4.3. PESTEL analysis
- 4.4. Market Entropy
- 4.5. Patent/Trademark Analysis
- 5. Global Tbm Software Analysis, Insights and Forecast, 2019-2031
- 5.1. Market Analysis, Insights and Forecast - by Application
- 5.1.1. SME (Small and Medium Enterprises)
- 5.1.2. Large Enterprise
- 5.2. Market Analysis, Insights and Forecast - by Type
- 5.2.1. On-Premise
- 5.2.2. Cloud-Based
- 5.3. Market Analysis, Insights and Forecast - by Region
- 5.3.1. North America
- 5.3.2. South America
- 5.3.3. Europe
- 5.3.4. Middle East & Africa
- 5.3.5. Asia Pacific
- 5.1. Market Analysis, Insights and Forecast - by Application
- 6. North America Tbm Software Analysis, Insights and Forecast, 2019-2031
- 6.1. Market Analysis, Insights and Forecast - by Application
- 6.1.1. SME (Small and Medium Enterprises)
- 6.1.2. Large Enterprise
- 6.2. Market Analysis, Insights and Forecast - by Type
- 6.2.1. On-Premise
- 6.2.2. Cloud-Based
- 6.1. Market Analysis, Insights and Forecast - by Application
- 7. South America Tbm Software Analysis, Insights and Forecast, 2019-2031
- 7.1. Market Analysis, Insights and Forecast - by Application
- 7.1.1. SME (Small and Medium Enterprises)
- 7.1.2. Large Enterprise
- 7.2. Market Analysis, Insights and Forecast - by Type
- 7.2.1. On-Premise
- 7.2.2. Cloud-Based
- 7.1. Market Analysis, Insights and Forecast - by Application
- 8. Europe Tbm Software Analysis, Insights and Forecast, 2019-2031
- 8.1. Market Analysis, Insights and Forecast - by Application
- 8.1.1. SME (Small and Medium Enterprises)
- 8.1.2. Large Enterprise
- 8.2. Market Analysis, Insights and Forecast - by Type
- 8.2.1. On-Premise
- 8.2.2. Cloud-Based
- 8.1. Market Analysis, Insights and Forecast - by Application
- 9. Middle East & Africa Tbm Software Analysis, Insights and Forecast, 2019-2031
- 9.1. Market Analysis, Insights and Forecast - by Application
- 9.1.1. SME (Small and Medium Enterprises)
- 9.1.2. Large Enterprise
- 9.2. Market Analysis, Insights and Forecast - by Type
- 9.2.1. On-Premise
- 9.2.2. Cloud-Based
- 9.1. Market Analysis, Insights and Forecast - by Application
- 10. Asia Pacific Tbm Software Analysis, Insights and Forecast, 2019-2031
- 10.1. Market Analysis, Insights and Forecast - by Application
- 10.1.1. SME (Small and Medium Enterprises)
- 10.1.2. Large Enterprise
- 10.2. Market Analysis, Insights and Forecast - by Type
- 10.2.1. On-Premise
- 10.2.2. Cloud-Based
- 10.1. Market Analysis, Insights and Forecast - by Application
- 11. Competitive Analysis
- 11.1. Global Market Share Analysis 2024
- 11.2. Company Profiles
- 11.2.1 anafee
- 11.2.1.1. Overview
- 11.2.1.2. Products
- 11.2.1.3. SWOT Analysis
- 11.2.1.4. Recent Developments
- 11.2.1.5. Financials (Based on Availability)
- 11.2.2 Apptio
- 11.2.2.1. Overview
- 11.2.2.2. Products
- 11.2.2.3. SWOT Analysis
- 11.2.2.4. Recent Developments
- 11.2.2.5. Financials (Based on Availability)
- 11.2.3 USU
- 11.2.3.1. Overview
- 11.2.3.2. Products
- 11.2.3.3. SWOT Analysis
- 11.2.3.4. Recent Developments
- 11.2.3.5. Financials (Based on Availability)
- 11.2.4 SAP
- 11.2.4.1. Overview
- 11.2.4.2. Products
- 11.2.4.3. SWOT Analysis
- 11.2.4.4. Recent Developments
- 11.2.4.5. Financials (Based on Availability)
- 11.2.5 ServiceNow
- 11.2.5.1. Overview
- 11.2.5.2. Products
- 11.2.5.3. SWOT Analysis
- 11.2.5.4. Recent Developments
- 11.2.5.5. Financials (Based on Availability)
- 11.2.6 upland
- 11.2.6.1. Overview
- 11.2.6.2. Products
- 11.2.6.3. SWOT Analysis
- 11.2.6.4. Recent Developments
- 11.2.6.5. Financials (Based on Availability)
- 11.2.7 CA
- 11.2.7.1. Overview
- 11.2.7.2. Products
- 11.2.7.3. SWOT Analysis
- 11.2.7.4. Recent Developments
- 11.2.7.5. Financials (Based on Availability)
- 11.2.8 BMC
- 11.2.8.1. Overview
- 11.2.8.2. Products
- 11.2.8.3. SWOT Analysis
- 11.2.8.4. Recent Developments
- 11.2.8.5. Financials (Based on Availability)
- 11.2.9 Micro Focus
- 11.2.9.1. Overview
- 11.2.9.2. Products
- 11.2.9.3. SWOT Analysis
- 11.2.9.4. Recent Developments
- 11.2.9.5. Financials (Based on Availability)
- 11.2.10 VMWare
- 11.2.10.1. Overview
- 11.2.10.2. Products
- 11.2.10.3. SWOT Analysis
- 11.2.10.4. Recent Developments
- 11.2.10.5. Financials (Based on Availability)
- 11.2.1 anafee
List of Figures
- Figure 1: Global Tbm Software Revenue Breakdown (million, %) by Region 2024 & 2032
- Figure 2: North America Tbm Software Revenue (million), by Application 2024 & 2032
- Figure 3: North America Tbm Software Revenue Share (%), by Application 2024 & 2032
- Figure 4: North America Tbm Software Revenue (million), by Type 2024 & 2032
- Figure 5: North America Tbm Software Revenue Share (%), by Type 2024 & 2032
- Figure 6: North America Tbm Software Revenue (million), by Country 2024 & 2032
- Figure 7: North America Tbm Software Revenue Share (%), by Country 2024 & 2032
- Figure 8: South America Tbm Software Revenue (million), by Application 2024 & 2032
- Figure 9: South America Tbm Software Revenue Share (%), by Application 2024 & 2032
- Figure 10: South America Tbm Software Revenue (million), by Type 2024 & 2032
- Figure 11: South America Tbm Software Revenue Share (%), by Type 2024 & 2032
- Figure 12: South America Tbm Software Revenue (million), by Country 2024 & 2032
- Figure 13: South America Tbm Software Revenue Share (%), by Country 2024 & 2032
- Figure 14: Europe Tbm Software Revenue (million), by Application 2024 & 2032
- Figure 15: Europe Tbm Software Revenue Share (%), by Application 2024 & 2032
- Figure 16: Europe Tbm Software Revenue (million), by Type 2024 & 2032
- Figure 17: Europe Tbm Software Revenue Share (%), by Type 2024 & 2032
- Figure 18: Europe Tbm Software Revenue (million), by Country 2024 & 2032
- Figure 19: Europe Tbm Software Revenue Share (%), by Country 2024 & 2032
- Figure 20: Middle East & Africa Tbm Software Revenue (million), by Application 2024 & 2032
- Figure 21: Middle East & Africa Tbm Software Revenue Share (%), by Application 2024 & 2032
- Figure 22: Middle East & Africa Tbm Software Revenue (million), by Type 2024 & 2032
- Figure 23: Middle East & Africa Tbm Software Revenue Share (%), by Type 2024 & 2032
- Figure 24: Middle East & Africa Tbm Software Revenue (million), by Country 2024 & 2032
- Figure 25: Middle East & Africa Tbm Software Revenue Share (%), by Country 2024 & 2032
- Figure 26: Asia Pacific Tbm Software Revenue (million), by Application 2024 & 2032
- Figure 27: Asia Pacific Tbm Software Revenue Share (%), by Application 2024 & 2032
- Figure 28: Asia Pacific Tbm Software Revenue (million), by Type 2024 & 2032
- Figure 29: Asia Pacific Tbm Software Revenue Share (%), by Type 2024 & 2032
- Figure 30: Asia Pacific Tbm Software Revenue (million), by Country 2024 & 2032
- Figure 31: Asia Pacific Tbm Software Revenue Share (%), by Country 2024 & 2032
List of Tables
- Table 1: Global Tbm Software Revenue million Forecast, by Region 2019 & 2032
- Table 2: Global Tbm Software Revenue million Forecast, by Application 2019 & 2032
- Table 3: Global Tbm Software Revenue million Forecast, by Type 2019 & 2032
- Table 4: Global Tbm Software Revenue million Forecast, by Region 2019 & 2032
- Table 5: Global Tbm Software Revenue million Forecast, by Application 2019 & 2032
- Table 6: Global Tbm Software Revenue million Forecast, by Type 2019 & 2032
- Table 7: Global Tbm Software Revenue million Forecast, by Country 2019 & 2032
- Table 8: United States Tbm Software Revenue (million) Forecast, by Application 2019 & 2032
- Table 9: Canada Tbm Software Revenue (million) Forecast, by Application 2019 & 2032
- Table 10: Mexico Tbm Software Revenue (million) Forecast, by Application 2019 & 2032
- Table 11: Global Tbm Software Revenue million Forecast, by Application 2019 & 2032
- Table 12: Global Tbm Software Revenue million Forecast, by Type 2019 & 2032
- Table 13: Global Tbm Software Revenue million Forecast, by Country 2019 & 2032
- Table 14: Brazil Tbm Software Revenue (million) Forecast, by Application 2019 & 2032
- Table 15: Argentina Tbm Software Revenue (million) Forecast, by Application 2019 & 2032
- Table 16: Rest of South America Tbm Software Revenue (million) Forecast, by Application 2019 & 2032
- Table 17: Global Tbm Software Revenue million Forecast, by Application 2019 & 2032
- Table 18: Global Tbm Software Revenue million Forecast, by Type 2019 & 2032
- Table 19: Global Tbm Software Revenue million Forecast, by Country 2019 & 2032
- Table 20: United Kingdom Tbm Software Revenue (million) Forecast, by Application 2019 & 2032
- Table 21: Germany Tbm Software Revenue (million) Forecast, by Application 2019 & 2032
- Table 22: France Tbm Software Revenue (million) Forecast, by Application 2019 & 2032
- Table 23: Italy Tbm Software Revenue (million) Forecast, by Application 2019 & 2032
- Table 24: Spain Tbm Software Revenue (million) Forecast, by Application 2019 & 2032
- Table 25: Russia Tbm Software Revenue (million) Forecast, by Application 2019 & 2032
- Table 26: Benelux Tbm Software Revenue (million) Forecast, by Application 2019 & 2032
- Table 27: Nordics Tbm Software Revenue (million) Forecast, by Application 2019 & 2032
- Table 28: Rest of Europe Tbm Software Revenue (million) Forecast, by Application 2019 & 2032
- Table 29: Global Tbm Software Revenue million Forecast, by Application 2019 & 2032
- Table 30: Global Tbm Software Revenue million Forecast, by Type 2019 & 2032
- Table 31: Global Tbm Software Revenue million Forecast, by Country 2019 & 2032
- Table 32: Turkey Tbm Software Revenue (million) Forecast, by Application 2019 & 2032
- Table 33: Israel Tbm Software Revenue (million) Forecast, by Application 2019 & 2032
- Table 34: GCC Tbm Software Revenue (million) Forecast, by Application 2019 & 2032
- Table 35: North Africa Tbm Software Revenue (million) Forecast, by Application 2019 & 2032
- Table 36: South Africa Tbm Software Revenue (million) Forecast, by Application 2019 & 2032
- Table 37: Rest of Middle East & Africa Tbm Software Revenue (million) Forecast, by Application 2019 & 2032
- Table 38: Global Tbm Software Revenue million Forecast, by Application 2019 & 2032
- Table 39: Global Tbm Software Revenue million Forecast, by Type 2019 & 2032
- Table 40: Global Tbm Software Revenue million Forecast, by Country 2019 & 2032
- Table 41: China Tbm Software Revenue (million) Forecast, by Application 2019 & 2032
- Table 42: India Tbm Software Revenue (million) Forecast, by Application 2019 & 2032
- Table 43: Japan Tbm Software Revenue (million) Forecast, by Application 2019 & 2032
- Table 44: South Korea Tbm Software Revenue (million) Forecast, by Application 2019 & 2032
- Table 45: ASEAN Tbm Software Revenue (million) Forecast, by Application 2019 & 2032
- Table 46: Oceania Tbm Software Revenue (million) Forecast, by Application 2019 & 2032
- Table 47: Rest of Asia Pacific Tbm Software Revenue (million) Forecast, by Application 2019 & 2032
Frequently Asked Questions
1. What is the projected Compound Annual Growth Rate (CAGR) of the Tbm Software?
The projected CAGR is approximately XXX%.
2. Which companies are prominent players in the Tbm Software?
Key companies in the market include anafee, Apptio, USU, SAP, ServiceNow, upland, CA, BMC, Micro Focus, VMWare.
3. What are the main segments of the Tbm Software?
The market segments include Application, Type.
4. Can you provide details about the market size?
The market size is estimated to be USD XXX million as of 2022.
5. What are some drivers contributing to market growth?
N/A
6. What are the notable trends driving market growth?
N/A
7. Are there any restraints impacting market growth?
N/A
8. Can you provide examples of recent developments in the market?
N/A
9. What pricing options are available for accessing the report?
Pricing options include single-user, multi-user, and enterprise licenses priced at USD 3950.00, USD 5925.00, and USD 7900.00 respectively.
10. Is the market size provided in terms of value or volume?
The market size is provided in terms of value, measured in million.
11. Are there any specific market keywords associated with the report?
Yes, the market keyword associated with the report is "Tbm Software," which aids in identifying and referencing the specific market segment covered.
12. How do I determine which pricing option suits my needs best?
The pricing options vary based on user requirements and access needs. Individual users may opt for single-user licenses, while businesses requiring broader access may choose multi-user or enterprise licenses for cost-effective access to the report.
13. Are there any additional resources or data provided in the Tbm Software report?
While the report offers comprehensive insights, it's advisable to review the specific contents or supplementary materials provided to ascertain if additional resources or data are available.
14. How can I stay updated on further developments or reports in the Tbm Software?
To stay informed about further developments, trends, and reports in the Tbm Software, consider subscribing to industry newsletters, following relevant companies and organizations, or regularly checking reputable industry news sources and publications.
Methodology
Step 1 - Identification of Relevant Samples Size from Population Database


Step 2 - Approaches for Defining Global Market Size (Value, Volume* & Price*)

Note*: In applicable scenarios
Step 3 - Data Sources
Primary Research
- Web Analytics
- Survey Reports
- Research Institute
- Latest Research Reports
- Opinion Leaders
Secondary Research
- Annual Reports
- White Paper
- Latest Press Release
- Industry Association
- Paid Database
- Investor Presentations

Step 4 - Data Triangulation
Involves using different sources of information in order to increase the validity of a study
These sources are likely to be stakeholders in a program - participants, other researchers, program staff, other community members, and so on.
Then we put all data in single framework & apply various statistical tools to find out the dynamic on the market.
During the analysis stage, feedback from the stakeholder groups would be compared to determine areas of agreement as well as areas of divergence


