
Key Insights
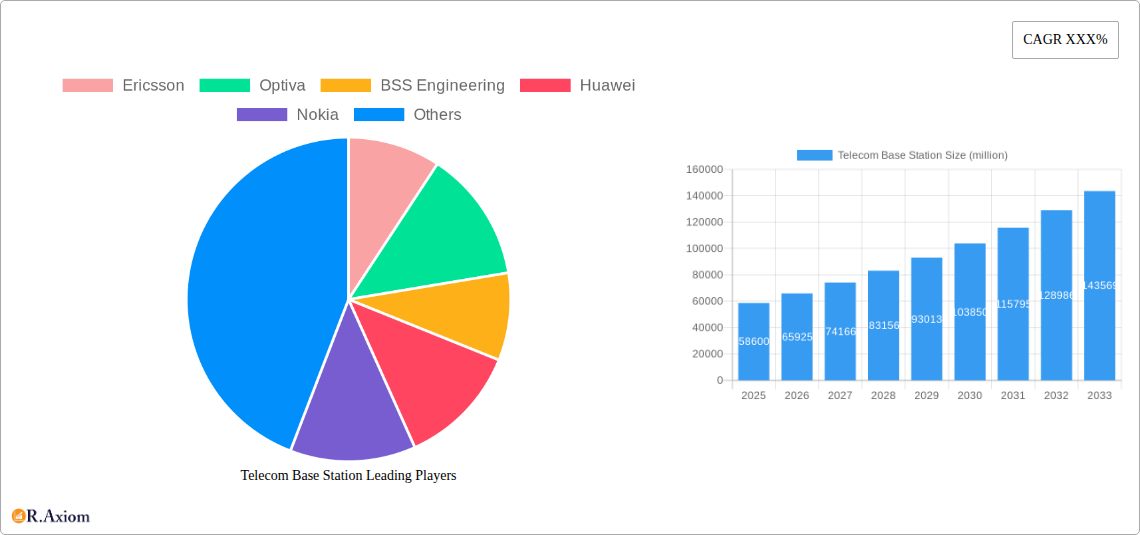
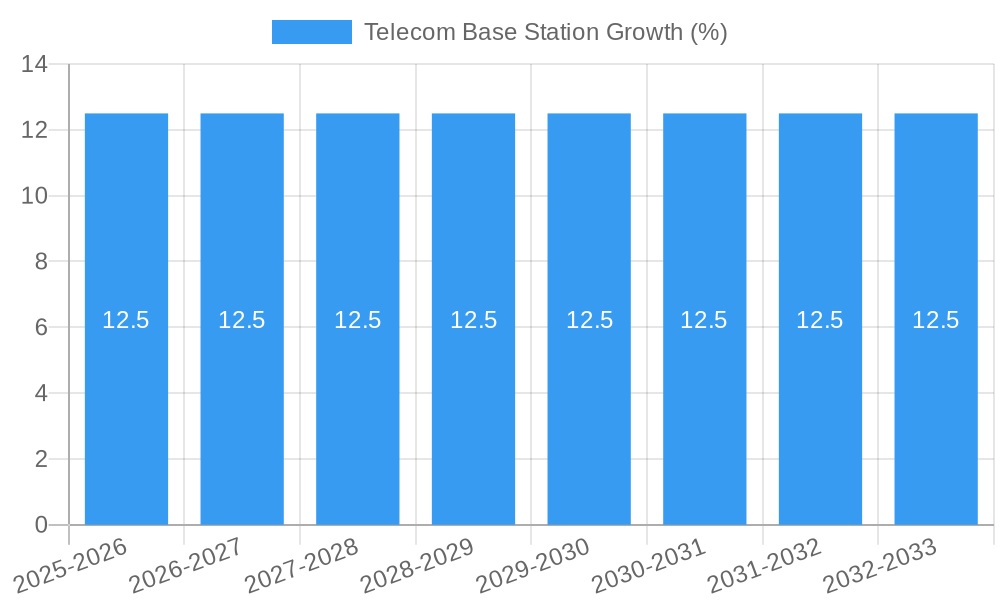
The global Telecom Base Station market is poised for robust expansion, projected to reach an estimated $58.6 billion in 2025 and grow at a Compound Annual Growth Rate (CAGR) of 12.5% through 2033. This significant market valuation underscores the critical role of base stations in powering modern telecommunications infrastructure. The proliferation of high-speed data demands, driven by the increasing adoption of smart devices, the Internet of Things (IoT), and the widespread rollout of 5G networks, are primary catalysts for this growth. Industries across the spectrum, from manufacturing and agriculture to logistics and smart cities, are increasingly reliant on advanced connectivity solutions, thereby fueling demand for next-generation base station technologies. The ongoing transition from 4G to 5G, characterized by lower latency and higher bandwidth, is a monumental driver, necessitating substantial upgrades and new deployments of base station hardware and software.
The market's trajectory is further shaped by several key trends. The advent of small cell technology, designed to enhance network coverage in dense urban areas and indoor environments, is gaining significant traction. Furthermore, the integration of Artificial Intelligence (AI) and Machine Learning (ML) into base station operations is enabling more efficient spectrum management, predictive maintenance, and optimized network performance. While the market is experiencing strong upward momentum, certain restraints could temper its pace. High initial investment costs for 5G infrastructure deployment, coupled with complex regulatory landscapes and spectrum allocation challenges in certain regions, may present hurdles. However, the persistent global push for digital transformation and enhanced connectivity, supported by government initiatives and increasing investments from telecommunications giants, is expected to overcome these challenges, ensuring sustained market growth and innovation in the telecom base station sector.
This comprehensive market research report provides an in-depth analysis of the global Telecom Base Station market, offering critical insights for industry stakeholders, investors, and strategic planners. Covering the period from 2019 to 2033, with a base year of 2025, this report delves into market concentration, innovation drivers, industry trends, dominant segments, product developments, growth drivers, challenges, emerging opportunities, leading players, key developments, and a strategic outlook.
Telecom Base Station Market Concentration & Innovation
The global Telecom Base Station market exhibits a XX% market concentration, characterized by the presence of a few dominant players alongside a growing number of specialized vendors. Innovation is a primary catalyst, driven by the relentless pursuit of enhanced data speeds, reduced latency, and increased network efficiency for 4G, 5G, and future generations. Regulatory frameworks, particularly those pertaining to spectrum allocation and network deployment, play a significant role in shaping market dynamics, influencing investment decisions and the pace of technological adoption. Product substitutes, while limited in direct functionality, are indirectly impacted by advancements in alternative connectivity solutions and edge computing infrastructure. End-user trends are increasingly demanding seamless, high-bandwidth connectivity for a multitude of applications across Industry, Agriculture, Business, and Household segments. Mergers and Acquisitions (M&A) activities have been notable, with approximately $XX million in deal values observed over the historical period, consolidating market share and fostering technological synergies.
Telecom Base Station Industry Trends & Insights
The Telecom Base Station industry is poised for significant expansion, fueled by the escalating global demand for ubiquitous, high-speed mobile connectivity. The projected Compound Annual Growth Rate (CAGR) for the forecast period 2025–2033 is an impressive XX%, indicating robust market growth. Key growth drivers include the ongoing global rollout of 5G networks, which necessitates the deployment of a denser and more advanced base station infrastructure. The increasing penetration of smart devices and the burgeoning Internet of Things (IoT) ecosystem further amplify the need for enhanced network capacity and performance. Technological disruptions, such as the evolution towards Open RAN (Radio Access Network) architectures and advancements in antenna technologies like Massive MIMO, are reshaping the competitive landscape and offering greater flexibility and cost-effectiveness. Consumer preferences are shifting towards immersive experiences like augmented reality (AR) and virtual reality (VR), video streaming at higher resolutions, and real-time gaming, all of which are heavily reliant on low-latency, high-bandwidth mobile networks. Competitive dynamics are characterized by intense innovation, strategic partnerships, and a global race to deploy next-generation infrastructure. The market penetration of 5G base stations is expected to rise from XX% in the base year 2025 to an estimated XX% by 2033. Investments in rural broadband expansion and enterprise-specific private networks are also contributing to sustained market growth. The shift towards software-defined networking (SDN) and network function virtualization (NFV) within base station architecture is enabling greater agility and scalability, further driving adoption and innovation.
Dominant Markets & Segments in Telecom Base Station
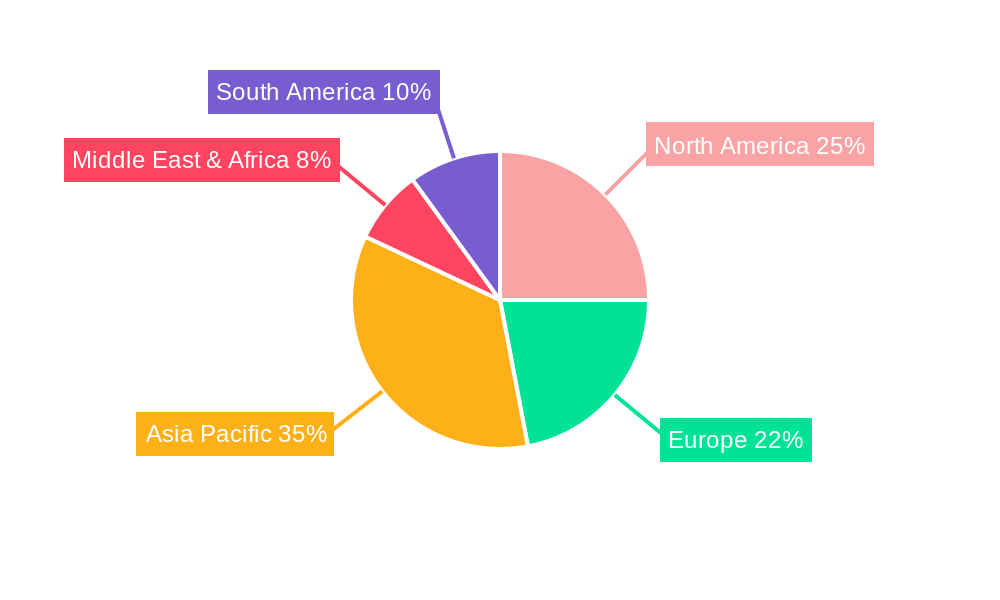
The Asia Pacific region is projected to maintain its dominance in the global Telecom Base Station market, driven by substantial investments in 5G infrastructure across key economies like China, South Korea, and Japan. Favorable government policies promoting digital transformation and the sheer scale of mobile subscriptions underpin this regional leadership. Within the application segments, Industry is emerging as a significant growth driver, with enterprises increasingly adopting private 5G networks for enhanced automation, real-time monitoring, and improved operational efficiency in manufacturing, logistics, and smart city initiatives. The Business segment also remains a cornerstone, with continuous demand for reliable and high-performance connectivity supporting remote work, cloud-based services, and data-intensive applications.
- Key Drivers for Regional Dominance (Asia Pacific):
- Aggressive 5G network deployment by major operators.
- Government initiatives supporting digital infrastructure development.
- High consumer adoption of advanced mobile services.
- Presence of leading telecommunications equipment manufacturers.
- Key Drivers for Application Dominance (Industry & Business):
- Increasing adoption of Industry 4.0 technologies.
- Demand for reliable, low-latency communication for critical operations.
- Growth of enterprise mobility solutions and cloud computing.
- Need for enhanced connectivity in smart city projects.
The 5G type segment is currently the most dominant and is expected to witness the highest growth trajectory, propelled by global network upgrades and the introduction of new 5G-enabled services. While 4G networks will continue to be crucial for widespread coverage, the focus of new deployments and technological advancements is firmly on 5G. The Household segment, while significant for consumer connectivity, is indirectly impacted by the infrastructure advancements driven by industrial and business needs. The Agriculture segment presents a nascent but rapidly growing opportunity, with the potential for precision agriculture applications powered by IoT and 5G connectivity.
Telecom Base Station Product Developments
Product development in the Telecom Base Station sector is characterized by a focus on miniaturization, increased energy efficiency, and enhanced processing capabilities. Innovations are geared towards supporting the evolving demands of 5G and beyond, including features like massive MIMO, beamforming, and edge computing integration. Companies are developing modular and scalable base station solutions that can be easily adapted to diverse deployment scenarios, from dense urban areas to remote rural locations. The competitive advantage lies in offering superior performance, reduced operational costs, and a lower carbon footprint.
Report Scope & Segmentation Analysis
This report provides a granular analysis of the Telecom Base Station market across key segments. The Application segmentation includes Industry, Agriculture, Business, Household, and Others. The Type segmentation covers 4G, 5G, and Others.
- Industry: This segment is projected to grow at a CAGR of XX% from 2025 to 2033, with an estimated market size of $XX million in 2025. Growth is driven by the increasing adoption of private networks and IoT solutions in manufacturing and logistics.
- Agriculture: Expected to witness a CAGR of XX%, this segment is poised for substantial growth with precision farming and smart agriculture initiatives, reaching $XX million by 2033.
- Business: A mature yet continuously evolving segment, projected to grow at XX% CAGR, driven by the demand for enterprise-grade connectivity and cloud services, with a market size of $XX million in 2025.
- Household: This segment will continue to be a major contributor, with a CAGR of XX%, driven by increasing data consumption and the proliferation of connected devices, estimated at $XX million in 2025.
- Others: Encompassing various niche applications, this segment is projected to grow at XX% CAGR.
- 4G: While still significant, its growth rate is expected to be XX%, with a market size of $XX million in 2025.
- 5G: This segment is the primary growth engine, with an anticipated CAGR of XX%, reaching $XX million by 2033.
- Others (Type): Including future generation technologies, this segment is in its nascent stages with a projected CAGR of XX%.
Key Drivers of Telecom Base Station Growth
The growth of the Telecom Base Station market is propelled by a confluence of powerful technological, economic, and regulatory factors. The relentless global push for 5G network deployment, driven by its promise of significantly higher speeds, lower latency, and increased capacity, stands as a primary catalyst. The exponential growth of data consumption, fueled by video streaming, online gaming, and the proliferation of IoT devices, necessitates constant network upgrades. Economic factors such as increasing disposable incomes in emerging economies and substantial government investments in digital infrastructure create fertile ground for expansion. Regulatory frameworks that facilitate spectrum allocation and encourage private network deployments also play a crucial role in driving market growth. For instance, government initiatives promoting smart city development and industrial automation directly translate into increased demand for advanced base station solutions.
Challenges in the Telecom Base Station Sector
Despite robust growth prospects, the Telecom Base Station sector faces several significant challenges. High capital expenditure associated with the deployment of new base stations, particularly for 5G, remains a considerable barrier for many operators. Regulatory hurdles, including lengthy approval processes for site acquisition and spectrum licensing, can significantly delay deployment timelines. Supply chain disruptions, exacerbated by geopolitical factors and global component shortages, pose a persistent threat to production and delivery schedules, potentially impacting market availability and cost. Intense competitive pressure among established players and new entrants also leads to price erosion and necessitates continuous innovation to maintain market share. The cybersecurity landscape presents ongoing challenges, requiring robust security measures to protect critical network infrastructure from evolving threats.
Emerging Opportunities in Telecom Base Station
The Telecom Base Station market is ripe with emerging opportunities, particularly in the context of evolving technological paradigms and expanding use cases. The widespread adoption of Open RAN architectures presents a significant opportunity for new players and fosters greater interoperability and cost efficiencies. The burgeoning IoT ecosystem, spanning smart homes, smart cities, and industrial automation, requires a dense network of connected devices, driving demand for specialized base station solutions. The development of edge computing capabilities integrated with base stations opens new avenues for real-time data processing and localized services, particularly crucial for autonomous vehicles and real-time analytics. Furthermore, the expansion of private 5G networks for enterprises and critical infrastructure offers substantial growth potential, catering to specific industry needs for dedicated, secure, and high-performance connectivity. The increasing focus on sustainability and energy efficiency in network infrastructure also creates opportunities for vendors offering greener solutions.
Leading Players in the Telecom Base Station Market
- Ericsson
- Huawei
- Nokia
- ZTE
- Alcatel Lucent
- Motorola
- NSN
- Optiva
- BSS Engineering
- CooliBlade
- Enapter
- Fibox
Key Developments in Telecom Base Station Industry
- January 2024: Ericsson announced the successful completion of a live 5G standalone trial utilizing cloud-native technologies, enhancing network flexibility and scalability.
- December 2023: Huawei launched a new generation of 5G base stations with improved energy efficiency and higher capacity, aiming to support densified network deployments.
- November 2023: Nokia introduced a new suite of Open RAN solutions, further expanding its commitment to disaggregated network architectures.
- October 2023: ZTE showcased advancements in mmWave 5G technology, highlighting its potential for ultra-high bandwidth applications.
- September 2023: Optiva announced a strategic partnership to integrate AI-driven network optimization solutions with leading base station infrastructure.
- August 2023: BSS Engineering reported significant growth in its deployment services for private 5G networks across various industrial sectors.
- July 2023: CooliBlade announced the integration of its advanced cooling solutions into next-generation base station designs for improved performance and reliability.
- June 2023: Enapter unveiled a new modular electrolyzer solution for green hydrogen production, indirectly impacting energy requirements for base station operations.
- May 2023: Fibox introduced enhanced ruggedized enclosures for outdoor base station equipment, improving durability in harsh environmental conditions.
- April 2023: NSN (Nokia Solutions and Networks) continued its focus on expanding 4G LTE Advanced Pro capabilities in emerging markets.
- March 2023: Alcatel Lucent Enterprise announced collaborations to accelerate private network deployments for businesses.
- February 2023: Motorola Solutions demonstrated enhanced push-to-talk over cellular (PTToC) capabilities leveraging 5G base station infrastructure.
Strategic Outlook for Telecom Base Station Market
The strategic outlook for the Telecom Base Station market is exceptionally positive, driven by continuous technological advancements and the insatiable global demand for enhanced connectivity. The ongoing transition to 5G, coupled with the foundational work for future 6G technologies, presents significant growth catalysts. Strategic imperatives for market players will revolve around developing more intelligent, energy-efficient, and flexible base station solutions that can adapt to diverse deployment scenarios and emerging applications. The expansion of private networks, driven by industrial digitization and enterprise needs, will offer substantial revenue streams. Furthermore, investments in research and development for advanced antenna technologies, AI-powered network management, and edge computing integration will be critical for maintaining a competitive edge and capitalizing on the evolving landscape of the telecommunications industry.
Telecom Base Station Segmentation
-
1. Application
- 1.1. Industry
- 1.2. Agriculture
- 1.3. Business
- 1.4. Household
- 1.5. Others
-
2. Type
- 2.1. 4G
- 2.2. 5G
- 2.3. Others
Telecom Base Station Segmentation By Geography
-
1. North America
- 1.1. United States
- 1.2. Canada
- 1.3. Mexico
-
2. South America
- 2.1. Brazil
- 2.2. Argentina
- 2.3. Rest of South America
-
3. Europe
- 3.1. United Kingdom
- 3.2. Germany
- 3.3. France
- 3.4. Italy
- 3.5. Spain
- 3.6. Russia
- 3.7. Benelux
- 3.8. Nordics
- 3.9. Rest of Europe
-
4. Middle East & Africa
- 4.1. Turkey
- 4.2. Israel
- 4.3. GCC
- 4.4. North Africa
- 4.5. South Africa
- 4.6. Rest of Middle East & Africa
-
5. Asia Pacific
- 5.1. China
- 5.2. India
- 5.3. Japan
- 5.4. South Korea
- 5.5. ASEAN
- 5.6. Oceania
- 5.7. Rest of Asia Pacific
Telecom Base Station REPORT HIGHLIGHTS
| Aspects | Details |
|---|---|
| Study Period | 2019-2033 |
| Base Year | 2024 |
| Estimated Year | 2025 |
| Forecast Period | 2025-2033 |
| Historical Period | 2019-2024 |
| Growth Rate | CAGR of XXX% from 2019-2033 |
| Segmentation |
|
Table of Contents
- 1. Introduction
- 1.1. Research Scope
- 1.2. Market Segmentation
- 1.3. Research Methodology
- 1.4. Definitions and Assumptions
- 2. Executive Summary
- 2.1. Introduction
- 3. Market Dynamics
- 3.1. Introduction
- 3.2. Market Drivers
- 3.3. Market Restrains
- 3.4. Market Trends
- 4. Market Factor Analysis
- 4.1. Porters Five Forces
- 4.2. Supply/Value Chain
- 4.3. PESTEL analysis
- 4.4. Market Entropy
- 4.5. Patent/Trademark Analysis
- 5. Global Telecom Base Station Analysis, Insights and Forecast, 2019-2031
- 5.1. Market Analysis, Insights and Forecast - by Application
- 5.1.1. Industry
- 5.1.2. Agriculture
- 5.1.3. Business
- 5.1.4. Household
- 5.1.5. Others
- 5.2. Market Analysis, Insights and Forecast - by Type
- 5.2.1. 4G
- 5.2.2. 5G
- 5.2.3. Others
- 5.3. Market Analysis, Insights and Forecast - by Region
- 5.3.1. North America
- 5.3.2. South America
- 5.3.3. Europe
- 5.3.4. Middle East & Africa
- 5.3.5. Asia Pacific
- 5.1. Market Analysis, Insights and Forecast - by Application
- 6. North America Telecom Base Station Analysis, Insights and Forecast, 2019-2031
- 6.1. Market Analysis, Insights and Forecast - by Application
- 6.1.1. Industry
- 6.1.2. Agriculture
- 6.1.3. Business
- 6.1.4. Household
- 6.1.5. Others
- 6.2. Market Analysis, Insights and Forecast - by Type
- 6.2.1. 4G
- 6.2.2. 5G
- 6.2.3. Others
- 6.1. Market Analysis, Insights and Forecast - by Application
- 7. South America Telecom Base Station Analysis, Insights and Forecast, 2019-2031
- 7.1. Market Analysis, Insights and Forecast - by Application
- 7.1.1. Industry
- 7.1.2. Agriculture
- 7.1.3. Business
- 7.1.4. Household
- 7.1.5. Others
- 7.2. Market Analysis, Insights and Forecast - by Type
- 7.2.1. 4G
- 7.2.2. 5G
- 7.2.3. Others
- 7.1. Market Analysis, Insights and Forecast - by Application
- 8. Europe Telecom Base Station Analysis, Insights and Forecast, 2019-2031
- 8.1. Market Analysis, Insights and Forecast - by Application
- 8.1.1. Industry
- 8.1.2. Agriculture
- 8.1.3. Business
- 8.1.4. Household
- 8.1.5. Others
- 8.2. Market Analysis, Insights and Forecast - by Type
- 8.2.1. 4G
- 8.2.2. 5G
- 8.2.3. Others
- 8.1. Market Analysis, Insights and Forecast - by Application
- 9. Middle East & Africa Telecom Base Station Analysis, Insights and Forecast, 2019-2031
- 9.1. Market Analysis, Insights and Forecast - by Application
- 9.1.1. Industry
- 9.1.2. Agriculture
- 9.1.3. Business
- 9.1.4. Household
- 9.1.5. Others
- 9.2. Market Analysis, Insights and Forecast - by Type
- 9.2.1. 4G
- 9.2.2. 5G
- 9.2.3. Others
- 9.1. Market Analysis, Insights and Forecast - by Application
- 10. Asia Pacific Telecom Base Station Analysis, Insights and Forecast, 2019-2031
- 10.1. Market Analysis, Insights and Forecast - by Application
- 10.1.1. Industry
- 10.1.2. Agriculture
- 10.1.3. Business
- 10.1.4. Household
- 10.1.5. Others
- 10.2. Market Analysis, Insights and Forecast - by Type
- 10.2.1. 4G
- 10.2.2. 5G
- 10.2.3. Others
- 10.1. Market Analysis, Insights and Forecast - by Application
- 11. Competitive Analysis
- 11.1. Global Market Share Analysis 2024
- 11.2. Company Profiles
- 11.2.1 Ericsson
- 11.2.1.1. Overview
- 11.2.1.2. Products
- 11.2.1.3. SWOT Analysis
- 11.2.1.4. Recent Developments
- 11.2.1.5. Financials (Based on Availability)
- 11.2.2 Optiva
- 11.2.2.1. Overview
- 11.2.2.2. Products
- 11.2.2.3. SWOT Analysis
- 11.2.2.4. Recent Developments
- 11.2.2.5. Financials (Based on Availability)
- 11.2.3 BSS Engineering
- 11.2.3.1. Overview
- 11.2.3.2. Products
- 11.2.3.3. SWOT Analysis
- 11.2.3.4. Recent Developments
- 11.2.3.5. Financials (Based on Availability)
- 11.2.4 Huawei
- 11.2.4.1. Overview
- 11.2.4.2. Products
- 11.2.4.3. SWOT Analysis
- 11.2.4.4. Recent Developments
- 11.2.4.5. Financials (Based on Availability)
- 11.2.5 Nokia
- 11.2.5.1. Overview
- 11.2.5.2. Products
- 11.2.5.3. SWOT Analysis
- 11.2.5.4. Recent Developments
- 11.2.5.5. Financials (Based on Availability)
- 11.2.6 CooliBlade
- 11.2.6.1. Overview
- 11.2.6.2. Products
- 11.2.6.3. SWOT Analysis
- 11.2.6.4. Recent Developments
- 11.2.6.5. Financials (Based on Availability)
- 11.2.7 Enapter
- 11.2.7.1. Overview
- 11.2.7.2. Products
- 11.2.7.3. SWOT Analysis
- 11.2.7.4. Recent Developments
- 11.2.7.5. Financials (Based on Availability)
- 11.2.8 Fibox
- 11.2.8.1. Overview
- 11.2.8.2. Products
- 11.2.8.3. SWOT Analysis
- 11.2.8.4. Recent Developments
- 11.2.8.5. Financials (Based on Availability)
- 11.2.9 NSN
- 11.2.9.1. Overview
- 11.2.9.2. Products
- 11.2.9.3. SWOT Analysis
- 11.2.9.4. Recent Developments
- 11.2.9.5. Financials (Based on Availability)
- 11.2.10 Alcatel Lucent
- 11.2.10.1. Overview
- 11.2.10.2. Products
- 11.2.10.3. SWOT Analysis
- 11.2.10.4. Recent Developments
- 11.2.10.5. Financials (Based on Availability)
- 11.2.11 Motorola
- 11.2.11.1. Overview
- 11.2.11.2. Products
- 11.2.11.3. SWOT Analysis
- 11.2.11.4. Recent Developments
- 11.2.11.5. Financials (Based on Availability)
- 11.2.12 ZTE
- 11.2.12.1. Overview
- 11.2.12.2. Products
- 11.2.12.3. SWOT Analysis
- 11.2.12.4. Recent Developments
- 11.2.12.5. Financials (Based on Availability)
- 11.2.1 Ericsson
List of Figures
- Figure 1: Global Telecom Base Station Revenue Breakdown (million, %) by Region 2024 & 2032
- Figure 2: North America Telecom Base Station Revenue (million), by Application 2024 & 2032
- Figure 3: North America Telecom Base Station Revenue Share (%), by Application 2024 & 2032
- Figure 4: North America Telecom Base Station Revenue (million), by Type 2024 & 2032
- Figure 5: North America Telecom Base Station Revenue Share (%), by Type 2024 & 2032
- Figure 6: North America Telecom Base Station Revenue (million), by Country 2024 & 2032
- Figure 7: North America Telecom Base Station Revenue Share (%), by Country 2024 & 2032
- Figure 8: South America Telecom Base Station Revenue (million), by Application 2024 & 2032
- Figure 9: South America Telecom Base Station Revenue Share (%), by Application 2024 & 2032
- Figure 10: South America Telecom Base Station Revenue (million), by Type 2024 & 2032
- Figure 11: South America Telecom Base Station Revenue Share (%), by Type 2024 & 2032
- Figure 12: South America Telecom Base Station Revenue (million), by Country 2024 & 2032
- Figure 13: South America Telecom Base Station Revenue Share (%), by Country 2024 & 2032
- Figure 14: Europe Telecom Base Station Revenue (million), by Application 2024 & 2032
- Figure 15: Europe Telecom Base Station Revenue Share (%), by Application 2024 & 2032
- Figure 16: Europe Telecom Base Station Revenue (million), by Type 2024 & 2032
- Figure 17: Europe Telecom Base Station Revenue Share (%), by Type 2024 & 2032
- Figure 18: Europe Telecom Base Station Revenue (million), by Country 2024 & 2032
- Figure 19: Europe Telecom Base Station Revenue Share (%), by Country 2024 & 2032
- Figure 20: Middle East & Africa Telecom Base Station Revenue (million), by Application 2024 & 2032
- Figure 21: Middle East & Africa Telecom Base Station Revenue Share (%), by Application 2024 & 2032
- Figure 22: Middle East & Africa Telecom Base Station Revenue (million), by Type 2024 & 2032
- Figure 23: Middle East & Africa Telecom Base Station Revenue Share (%), by Type 2024 & 2032
- Figure 24: Middle East & Africa Telecom Base Station Revenue (million), by Country 2024 & 2032
- Figure 25: Middle East & Africa Telecom Base Station Revenue Share (%), by Country 2024 & 2032
- Figure 26: Asia Pacific Telecom Base Station Revenue (million), by Application 2024 & 2032
- Figure 27: Asia Pacific Telecom Base Station Revenue Share (%), by Application 2024 & 2032
- Figure 28: Asia Pacific Telecom Base Station Revenue (million), by Type 2024 & 2032
- Figure 29: Asia Pacific Telecom Base Station Revenue Share (%), by Type 2024 & 2032
- Figure 30: Asia Pacific Telecom Base Station Revenue (million), by Country 2024 & 2032
- Figure 31: Asia Pacific Telecom Base Station Revenue Share (%), by Country 2024 & 2032
List of Tables
- Table 1: Global Telecom Base Station Revenue million Forecast, by Region 2019 & 2032
- Table 2: Global Telecom Base Station Revenue million Forecast, by Application 2019 & 2032
- Table 3: Global Telecom Base Station Revenue million Forecast, by Type 2019 & 2032
- Table 4: Global Telecom Base Station Revenue million Forecast, by Region 2019 & 2032
- Table 5: Global Telecom Base Station Revenue million Forecast, by Application 2019 & 2032
- Table 6: Global Telecom Base Station Revenue million Forecast, by Type 2019 & 2032
- Table 7: Global Telecom Base Station Revenue million Forecast, by Country 2019 & 2032
- Table 8: United States Telecom Base Station Revenue (million) Forecast, by Application 2019 & 2032
- Table 9: Canada Telecom Base Station Revenue (million) Forecast, by Application 2019 & 2032
- Table 10: Mexico Telecom Base Station Revenue (million) Forecast, by Application 2019 & 2032
- Table 11: Global Telecom Base Station Revenue million Forecast, by Application 2019 & 2032
- Table 12: Global Telecom Base Station Revenue million Forecast, by Type 2019 & 2032
- Table 13: Global Telecom Base Station Revenue million Forecast, by Country 2019 & 2032
- Table 14: Brazil Telecom Base Station Revenue (million) Forecast, by Application 2019 & 2032
- Table 15: Argentina Telecom Base Station Revenue (million) Forecast, by Application 2019 & 2032
- Table 16: Rest of South America Telecom Base Station Revenue (million) Forecast, by Application 2019 & 2032
- Table 17: Global Telecom Base Station Revenue million Forecast, by Application 2019 & 2032
- Table 18: Global Telecom Base Station Revenue million Forecast, by Type 2019 & 2032
- Table 19: Global Telecom Base Station Revenue million Forecast, by Country 2019 & 2032
- Table 20: United Kingdom Telecom Base Station Revenue (million) Forecast, by Application 2019 & 2032
- Table 21: Germany Telecom Base Station Revenue (million) Forecast, by Application 2019 & 2032
- Table 22: France Telecom Base Station Revenue (million) Forecast, by Application 2019 & 2032
- Table 23: Italy Telecom Base Station Revenue (million) Forecast, by Application 2019 & 2032
- Table 24: Spain Telecom Base Station Revenue (million) Forecast, by Application 2019 & 2032
- Table 25: Russia Telecom Base Station Revenue (million) Forecast, by Application 2019 & 2032
- Table 26: Benelux Telecom Base Station Revenue (million) Forecast, by Application 2019 & 2032
- Table 27: Nordics Telecom Base Station Revenue (million) Forecast, by Application 2019 & 2032
- Table 28: Rest of Europe Telecom Base Station Revenue (million) Forecast, by Application 2019 & 2032
- Table 29: Global Telecom Base Station Revenue million Forecast, by Application 2019 & 2032
- Table 30: Global Telecom Base Station Revenue million Forecast, by Type 2019 & 2032
- Table 31: Global Telecom Base Station Revenue million Forecast, by Country 2019 & 2032
- Table 32: Turkey Telecom Base Station Revenue (million) Forecast, by Application 2019 & 2032
- Table 33: Israel Telecom Base Station Revenue (million) Forecast, by Application 2019 & 2032
- Table 34: GCC Telecom Base Station Revenue (million) Forecast, by Application 2019 & 2032
- Table 35: North Africa Telecom Base Station Revenue (million) Forecast, by Application 2019 & 2032
- Table 36: South Africa Telecom Base Station Revenue (million) Forecast, by Application 2019 & 2032
- Table 37: Rest of Middle East & Africa Telecom Base Station Revenue (million) Forecast, by Application 2019 & 2032
- Table 38: Global Telecom Base Station Revenue million Forecast, by Application 2019 & 2032
- Table 39: Global Telecom Base Station Revenue million Forecast, by Type 2019 & 2032
- Table 40: Global Telecom Base Station Revenue million Forecast, by Country 2019 & 2032
- Table 41: China Telecom Base Station Revenue (million) Forecast, by Application 2019 & 2032
- Table 42: India Telecom Base Station Revenue (million) Forecast, by Application 2019 & 2032
- Table 43: Japan Telecom Base Station Revenue (million) Forecast, by Application 2019 & 2032
- Table 44: South Korea Telecom Base Station Revenue (million) Forecast, by Application 2019 & 2032
- Table 45: ASEAN Telecom Base Station Revenue (million) Forecast, by Application 2019 & 2032
- Table 46: Oceania Telecom Base Station Revenue (million) Forecast, by Application 2019 & 2032
- Table 47: Rest of Asia Pacific Telecom Base Station Revenue (million) Forecast, by Application 2019 & 2032
Frequently Asked Questions
1. What is the projected Compound Annual Growth Rate (CAGR) of the Telecom Base Station?
The projected CAGR is approximately XXX%.
2. Which companies are prominent players in the Telecom Base Station?
Key companies in the market include Ericsson, Optiva, BSS Engineering, Huawei, Nokia, CooliBlade, Enapter, Fibox, NSN, Alcatel Lucent, Motorola, ZTE.
3. What are the main segments of the Telecom Base Station?
The market segments include Application, Type.
4. Can you provide details about the market size?
The market size is estimated to be USD XXX million as of 2022.
5. What are some drivers contributing to market growth?
N/A
6. What are the notable trends driving market growth?
N/A
7. Are there any restraints impacting market growth?
N/A
8. Can you provide examples of recent developments in the market?
N/A
9. What pricing options are available for accessing the report?
Pricing options include single-user, multi-user, and enterprise licenses priced at USD 2900.00, USD 4350.00, and USD 5800.00 respectively.
10. Is the market size provided in terms of value or volume?
The market size is provided in terms of value, measured in million.
11. Are there any specific market keywords associated with the report?
Yes, the market keyword associated with the report is "Telecom Base Station," which aids in identifying and referencing the specific market segment covered.
12. How do I determine which pricing option suits my needs best?
The pricing options vary based on user requirements and access needs. Individual users may opt for single-user licenses, while businesses requiring broader access may choose multi-user or enterprise licenses for cost-effective access to the report.
13. Are there any additional resources or data provided in the Telecom Base Station report?
While the report offers comprehensive insights, it's advisable to review the specific contents or supplementary materials provided to ascertain if additional resources or data are available.
14. How can I stay updated on further developments or reports in the Telecom Base Station?
To stay informed about further developments, trends, and reports in the Telecom Base Station, consider subscribing to industry newsletters, following relevant companies and organizations, or regularly checking reputable industry news sources and publications.
Methodology
Step 1 - Identification of Relevant Samples Size from Population Database


Step 2 - Approaches for Defining Global Market Size (Value, Volume* & Price*)

Note*: In applicable scenarios
Step 3 - Data Sources
Primary Research
- Web Analytics
- Survey Reports
- Research Institute
- Latest Research Reports
- Opinion Leaders
Secondary Research
- Annual Reports
- White Paper
- Latest Press Release
- Industry Association
- Paid Database
- Investor Presentations

Step 4 - Data Triangulation
Involves using different sources of information in order to increase the validity of a study
These sources are likely to be stakeholders in a program - participants, other researchers, program staff, other community members, and so on.
Then we put all data in single framework & apply various statistical tools to find out the dynamic on the market.
During the analysis stage, feedback from the stakeholder groups would be compared to determine areas of agreement as well as areas of divergence


