

Key Insights
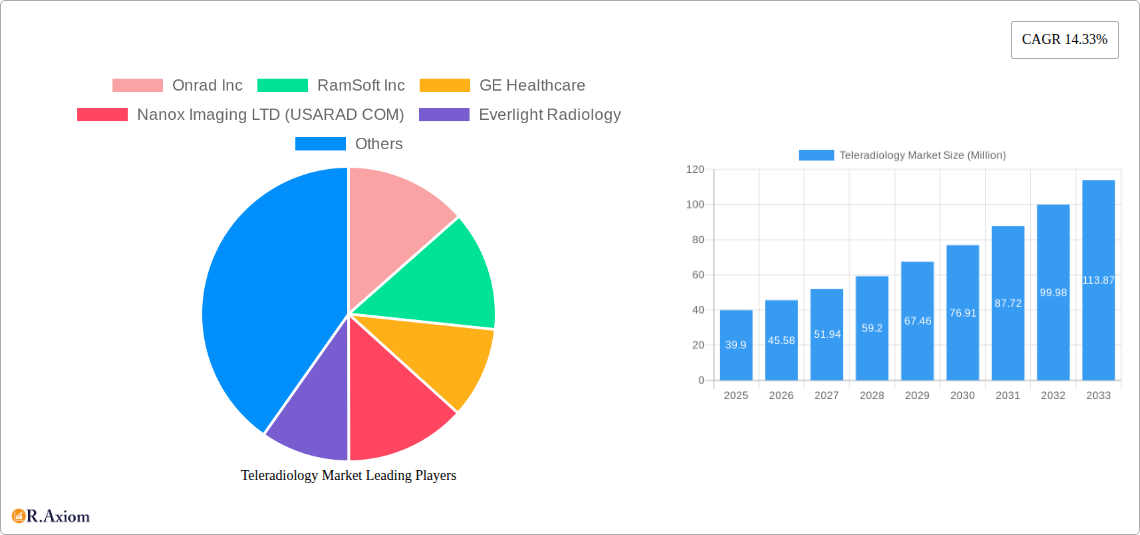
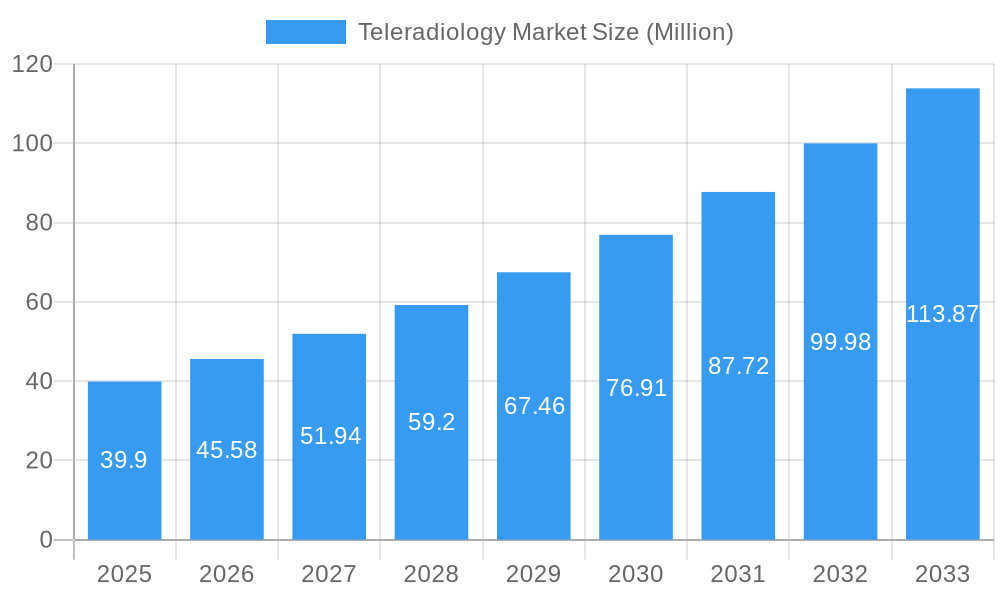
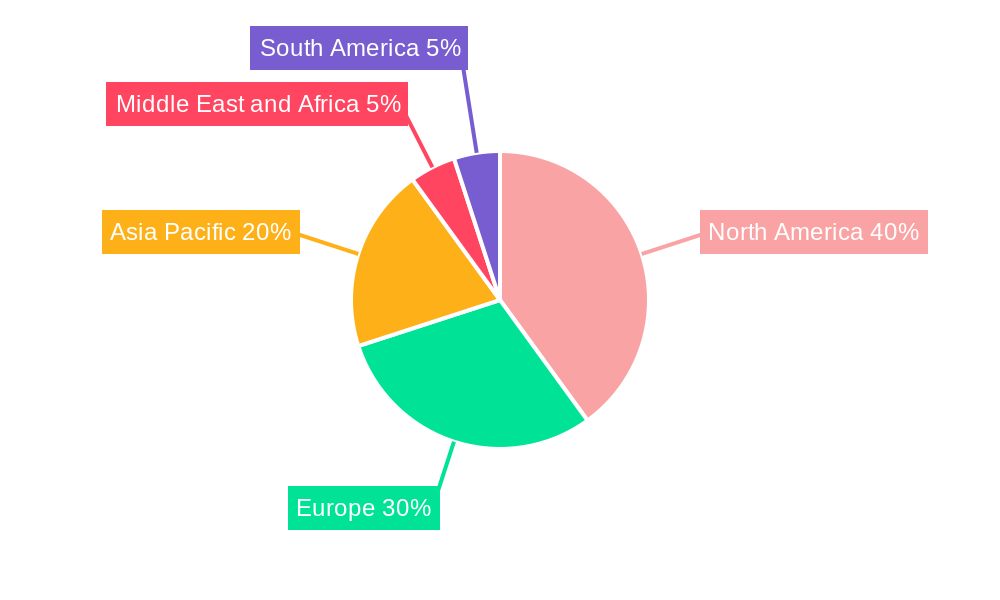
The teleradiology market, valued at $39.90 million in 2025, is projected to experience robust growth, driven by the increasing demand for remote diagnostic services, the rising prevalence of chronic diseases requiring frequent imaging, and advancements in high-speed internet and medical imaging technology. This expansion is further fueled by the increasing adoption of cloud-based solutions for image storage and analysis, enabling faster diagnosis and improved patient care, particularly in underserved areas. The market is segmented by component (hardware, software), end-user (hospitals, diagnostic centers, other), and imaging technique (X-rays, CT, Ultrasound, MRI, Nuclear Imaging). The substantial growth is expected across all segments, with software solutions witnessing particularly strong uptake due to their efficiency and cost-effectiveness. North America is expected to hold a significant market share, primarily due to the region's advanced healthcare infrastructure and early adoption of telehealth technologies. However, Asia Pacific is anticipated to show the fastest growth rate due to expanding healthcare infrastructure and increasing disposable incomes. Challenges such as concerns regarding data security and regulatory hurdles related to telehealth practices are potential market restraints, but the overall market outlook remains positive. Key players include Onrad Inc, RamSoft Inc, GE Healthcare, Nanox Imaging, Everlight Radiology, and others, constantly innovating to enhance service offerings and address market needs.
Teleradiology Market Market Size (In Million)
The forecast period (2025-2033) anticipates a continuation of this upward trajectory. The 14.33% CAGR suggests a significant market expansion, with substantial growth opportunities for companies offering advanced analytics, AI-powered diagnostic tools, and seamless integration with existing healthcare information systems. The increasing focus on reducing healthcare costs and improving access to quality care, especially in remote and rural areas, will further propel market growth. Competition among existing and new entrants will intensify, driving innovation and potentially leading to more affordable and accessible teleradiology services. Strategic partnerships and mergers and acquisitions are anticipated as companies seek to expand their market reach and enhance their service offerings. The successful navigation of regulatory landscapes and ongoing investments in cybersecurity infrastructure will be crucial for sustained market growth.
Teleradiology Market Company Market Share
This detailed report provides a comprehensive analysis of the Teleradiology market, encompassing historical data (2019-2024), current estimates (2025), and future projections (2025-2033). The study covers market segmentation by component (Hardware, Software), end-user (Hospitals, Diagnostic Centers, Other End Users), and imaging technique (X-rays, Computed Tomography (CT), Ultrasound, Magnetic Resonance Imaging (MRI), Nuclear Imaging, Other Imaging Techniques), offering actionable insights for industry stakeholders. The report also features detailed company profiles of key players including Onrad Inc, RamSoft Inc, GE Healthcare, Nanox Imaging LTD (USARAD COM), Everlight Radiology, HealthWatch TeleDiagnostics Private Limited, Koninklijke Philips NV, 4ways Healthcare Ltd, Teleradiology Solutions, Carestream Health, and Agfa-Gevaert Group.
Teleradiology Market Market Concentration & Innovation
The teleradiology market exhibits a moderately concentrated landscape, with a few major players holding significant market share. However, the market is also characterized by a considerable number of smaller, specialized providers. The market share of the top five players is estimated at xx%, reflecting both consolidation and the emergence of new entrants. Innovation is a key driver, fueled by advancements in AI-powered image analysis, high-speed network infrastructure, and improved data security solutions. Regulatory frameworks, while varying across regions, are increasingly focused on ensuring data privacy and patient safety, impacting market growth and adoption rates. The market is witnessing several M&A activities, with deal values ranging from xx Million to xx Million in recent years. These mergers and acquisitions aim to expand market reach, enhance technological capabilities, and consolidate market share.
- Market Concentration: Top 5 players hold approximately xx% market share (2025 estimate).
- Innovation Drivers: AI-powered image analysis, high-speed networks, enhanced data security.
- Regulatory Framework: Focus on data privacy and patient safety varies regionally.
- Product Substitutes: Limited direct substitutes exist; however, traditional in-person radiology services remain a key alternative.
- End-User Trends: Increasing adoption of teleradiology by hospitals and diagnostic centers due to cost-effectiveness and improved access to specialists.
- M&A Activity: Significant M&A activity observed, with deal values ranging from xx Million to xx Million (2019-2024).
Teleradiology Market Industry Trends & Insights
The global teleradiology market is experiencing robust growth, driven by the increasing prevalence of chronic diseases, rising demand for efficient healthcare delivery, and the expanding adoption of digital health technologies. The market's Compound Annual Growth Rate (CAGR) is projected to be xx% during the forecast period (2025-2033). Technological advancements, such as the integration of Artificial Intelligence (AI) and Machine Learning (ML) in image analysis, are significantly enhancing diagnostic accuracy and efficiency. This has led to increased market penetration, particularly in remote and underserved areas. Consumer preferences are shifting toward convenient, accessible, and high-quality healthcare services, further boosting the demand for teleradiology. Competitive dynamics are characterized by both collaboration and competition, with established players investing in technological innovation and expanding their service offerings while newer companies are entering the market with specialized solutions. Market penetration is expected to reach xx% by 2033.
Dominant Markets & Segments in Teleradiology Market
The North American region currently holds the largest market share in the teleradiology market, driven by high healthcare expenditure, advanced technological infrastructure, and a favorable regulatory environment. Within the segments, the Software segment is experiencing the fastest growth, followed by the Hardware segment. Hospitals currently represent the largest end-user segment, but diagnostic centers are showing rapid growth. Among imaging techniques, X-rays and CT scans hold the largest market share due to high volume and established infrastructure.
Key Drivers for North American Dominance:
- High healthcare expenditure.
- Advanced technological infrastructure.
- Favorable regulatory environment.
Fastest-Growing Segments:
- Software component: driven by advancements in AI and image analysis software.
- Diagnostic centers end-user segment: due to increasing outsourcing of radiology services.
- CT and MRI imaging techniques: driven by technological advances and increased diagnostic capabilities.
Teleradiology Market Product Developments
Recent product innovations focus on improving image quality, enhancing diagnostic accuracy through AI integration, and streamlining workflow efficiency. New applications are emerging in areas such as remote patient monitoring and chronic disease management. Competitive advantages are derived from superior image processing algorithms, user-friendly interfaces, robust security features, and comprehensive service offerings. The market is witnessing a strong trend toward cloud-based solutions, offering scalability and cost-effectiveness.
Report Scope & Segmentation Analysis
This report comprehensively analyzes the teleradiology market across various segments.
Component: The Hardware segment includes imaging devices, workstations, and network infrastructure, while the Software segment comprises image processing, diagnostic support, and management tools. The hardware market is projected to grow at a CAGR of xx% during the forecast period, driven by the demand for high-resolution imaging devices. The Software segment is expected to witness a faster growth rate, reaching a market size of xx Million by 2033, due to the increasing adoption of AI-powered diagnostic tools.
End-User: The Hospitals segment currently dominates the market, followed by Diagnostic Centers and Other End Users (including private clinics and mobile radiology units). The Diagnostic Centers segment is anticipated to experience the fastest growth rate due to increased outsourcing and the adoption of cost-effective teleradiology solutions.
Imaging Technique: The X-rays and Computed Tomography (CT) segments currently hold the largest market share, followed by Ultrasound, MRI, and Nuclear Imaging. The CT segment is poised for significant growth due to advancements in image acquisition and processing technologies.
Key Drivers of Teleradiology Market Growth
Several factors propel teleradiology market growth: increasing demand for specialized radiology services in underserved areas, cost reductions for healthcare providers, the need for improved healthcare accessibility, and technological advancements like AI-powered diagnostic tools. Government initiatives promoting telehealth and digital healthcare further contribute to this growth. The rising prevalence of chronic diseases requiring regular imaging also fuels demand.
Challenges in the Teleradiology Market Sector
Despite the growth potential, challenges remain. These include ensuring data security and privacy compliance across diverse regulatory landscapes, maintaining high-quality image transmission and minimizing latency, and addressing the potential for high initial investment costs in infrastructure and training. The market also faces challenges in overcoming the hesitancy of some healthcare professionals to fully adopt teleradiology. These challenges could lead to a xx% reduction in market growth if not adequately addressed.
Emerging Opportunities in Teleradiology Market
Significant opportunities exist in expanding teleradiology services to remote areas with limited access to specialists, integrating AI-powered diagnostic tools to enhance accuracy and speed, and developing innovative business models to improve affordability and accessibility. The integration of teleradiology with other digital health solutions, such as remote patient monitoring, presents significant potential. Furthermore, the growing adoption of cloud-based solutions and the use of specialized hardware for specific modalities can offer additional opportunities for growth.
Leading Players in the Teleradiology Market Market
- Onrad Inc
- RamSoft Inc
- GE Healthcare
- Nanox Imaging LTD (USARAD COM)
- Everlight Radiology
- HealthWatch TeleDiagnostics Private Limited
- Koninklijke Philips NV
- 4ways Healthcare Ltd
- Teleradiology Solutions
- Carestream Health
- Agfa-Gevaert Group
Key Developments in Teleradiology Market Industry
- April 2023: Aster DM Healthcare launched a Telecommand Center and Digital Health facility in India, integrating teleradiology services. This significantly boosts market adoption in a key emerging market.
- April 2022: Teleradiology Solutions partnered with Andhra Med Tech Zone (AMTZ) to establish a teleradiology hub in India, leveraging AI solutions. This demonstrates the strategic importance of AI integration and public-private partnerships in market expansion.
Strategic Outlook for Teleradiology Market Market
The future of the teleradiology market is promising, driven by continuous technological advancements, increasing demand for accessible and efficient healthcare, and favorable regulatory support in various regions. The market is expected to experience sustained growth, propelled by the wider adoption of AI-powered diagnostic tools, cloud-based solutions, and the expansion of teleradiology services into new geographic markets. Further integration with other telehealth services and the development of specialized teleradiology solutions for specific medical conditions will present significant opportunities for market expansion and innovation.
Teleradiology Market Segmentation
-
1. Imaging Technique
- 1.1. X-rays
- 1.2. Computed Tomography (CT)
- 1.3. Ultrasound
- 1.4. Magnetic Resonance Imaging (MRI)
- 1.5. Nuclear Imaging
- 1.6. Other Imaging Techniques
-
2. Component
- 2.1. Hardware
- 2.2. Software
-
3. End User
- 3.1. Hospitals
- 3.2. Diagnostic Centers
- 3.3. Other End Users
Teleradiology Market Segmentation By Geography
-
1. North America
- 1.1. United States
- 1.2. Canada
- 1.3. Mexico
-
2. Europe
- 2.1. Germany
- 2.2. United Kingdom
- 2.3. France
- 2.4. Italy
- 2.5. Spain
- 2.6. Rest of Europe
-
3. Asia Pacific
- 3.1. China
- 3.2. Japan
- 3.3. India
- 3.4. Australia
- 3.5. South Korea
- 3.6. Rest of Asia Pacific
-
4. Middle East and Africa
- 4.1. GCC
- 4.2. South Africa
- 4.3. Rest of Middle East and Africa
-
5. South America
- 5.1. Brazil
- 5.2. Argentina
- 5.3. Rest of South America
Teleradiology Market Regional Market Share
Geographic Coverage of Teleradiology Market
Teleradiology Market REPORT HIGHLIGHTS
| Aspects | Details |
|---|---|
| Study Period | 2020-2034 |
| Base Year | 2025 |
| Estimated Year | 2026 |
| Forecast Period | 2026-2034 |
| Historical Period | 2020-2025 |
| Growth Rate | CAGR of 14.33% from 2020-2034 |
| Segmentation |
|
Table of Contents
- 1. Introduction
- 1.1. Research Scope
- 1.2. Market Segmentation
- 1.3. Research Objective
- 1.4. Definitions and Assumptions
- 2. Executive Summary
- 2.1. Market Snapshot
- 3. Market Dynamics
- 3.1. Market Drivers
- 3.2. Market Restrains
- 3.3. Market Trends
- 3.4. Market Opportunities
- 4. Market Factor Analysis
- 4.1. Porters Five Forces
- 4.1.1. Bargaining Power of Suppliers
- 4.1.2. Bargaining Power of Buyers
- 4.1.3. Threat of New Entrants
- 4.1.4. Threat of Substitutes
- 4.1.5. Competitive Rivalry
- 4.2. PESTEL analysis
- 4.3. BCG Analysis
- 4.3.1. Stars (High Growth, High Market Share)
- 4.3.2. Cash Cows (Low Growth, High Market Share)
- 4.3.3. Question Mark (High Growth, Low Market Share)
- 4.3.4. Dogs (Low Growth, Low Market Share)
- 4.4. Ansoff Matrix Analysis
- 4.5. Supply Chain Analysis
- 4.6. Regulatory Landscape
- 4.7. Current Market Potential and Opportunity Assessment (TAM–SAM–SOM Framework)
- 4.8. RAX Analyst Note
- 4.1. Porters Five Forces
- 5. Market Analysis, Insights and Forecast 2021-2033
- 5.1. Market Analysis, Insights and Forecast - by Imaging Technique
- 5.1.1. X-rays
- 5.1.2. Computed Tomography (CT)
- 5.1.3. Ultrasound
- 5.1.4. Magnetic Resonance Imaging (MRI)
- 5.1.5. Nuclear Imaging
- 5.1.6. Other Imaging Techniques
- 5.2. Market Analysis, Insights and Forecast - by Component
- 5.2.1. Hardware
- 5.2.2. Software
- 5.3. Market Analysis, Insights and Forecast - by End User
- 5.3.1. Hospitals
- 5.3.2. Diagnostic Centers
- 5.3.3. Other End Users
- 5.4. Market Analysis, Insights and Forecast - by Region
- 5.4.1. North America
- 5.4.2. Europe
- 5.4.3. Asia Pacific
- 5.4.4. Middle East and Africa
- 5.4.5. South America
- 5.1. Market Analysis, Insights and Forecast - by Imaging Technique
- 6. Global Teleradiology Market Analysis, Insights and Forecast, 2021-2033
- 6.1. Market Analysis, Insights and Forecast - by Imaging Technique
- 6.1.1. X-rays
- 6.1.2. Computed Tomography (CT)
- 6.1.3. Ultrasound
- 6.1.4. Magnetic Resonance Imaging (MRI)
- 6.1.5. Nuclear Imaging
- 6.1.6. Other Imaging Techniques
- 6.2. Market Analysis, Insights and Forecast - by Component
- 6.2.1. Hardware
- 6.2.2. Software
- 6.3. Market Analysis, Insights and Forecast - by End User
- 6.3.1. Hospitals
- 6.3.2. Diagnostic Centers
- 6.3.3. Other End Users
- 6.1. Market Analysis, Insights and Forecast - by Imaging Technique
- 7. North America Teleradiology Market Analysis, Insights and Forecast, 2020-2032
- 7.1. Market Analysis, Insights and Forecast - by Imaging Technique
- 7.1.1. X-rays
- 7.1.2. Computed Tomography (CT)
- 7.1.3. Ultrasound
- 7.1.4. Magnetic Resonance Imaging (MRI)
- 7.1.5. Nuclear Imaging
- 7.1.6. Other Imaging Techniques
- 7.2. Market Analysis, Insights and Forecast - by Component
- 7.2.1. Hardware
- 7.2.2. Software
- 7.3. Market Analysis, Insights and Forecast - by End User
- 7.3.1. Hospitals
- 7.3.2. Diagnostic Centers
- 7.3.3. Other End Users
- 7.1. Market Analysis, Insights and Forecast - by Imaging Technique
- 8. Europe Teleradiology Market Analysis, Insights and Forecast, 2020-2032
- 8.1. Market Analysis, Insights and Forecast - by Imaging Technique
- 8.1.1. X-rays
- 8.1.2. Computed Tomography (CT)
- 8.1.3. Ultrasound
- 8.1.4. Magnetic Resonance Imaging (MRI)
- 8.1.5. Nuclear Imaging
- 8.1.6. Other Imaging Techniques
- 8.2. Market Analysis, Insights and Forecast - by Component
- 8.2.1. Hardware
- 8.2.2. Software
- 8.3. Market Analysis, Insights and Forecast - by End User
- 8.3.1. Hospitals
- 8.3.2. Diagnostic Centers
- 8.3.3. Other End Users
- 8.1. Market Analysis, Insights and Forecast - by Imaging Technique
- 9. Asia Pacific Teleradiology Market Analysis, Insights and Forecast, 2020-2032
- 9.1. Market Analysis, Insights and Forecast - by Imaging Technique
- 9.1.1. X-rays
- 9.1.2. Computed Tomography (CT)
- 9.1.3. Ultrasound
- 9.1.4. Magnetic Resonance Imaging (MRI)
- 9.1.5. Nuclear Imaging
- 9.1.6. Other Imaging Techniques
- 9.2. Market Analysis, Insights and Forecast - by Component
- 9.2.1. Hardware
- 9.2.2. Software
- 9.3. Market Analysis, Insights and Forecast - by End User
- 9.3.1. Hospitals
- 9.3.2. Diagnostic Centers
- 9.3.3. Other End Users
- 9.1. Market Analysis, Insights and Forecast - by Imaging Technique
- 10. Middle East and Africa Teleradiology Market Analysis, Insights and Forecast, 2020-2032
- 10.1. Market Analysis, Insights and Forecast - by Imaging Technique
- 10.1.1. X-rays
- 10.1.2. Computed Tomography (CT)
- 10.1.3. Ultrasound
- 10.1.4. Magnetic Resonance Imaging (MRI)
- 10.1.5. Nuclear Imaging
- 10.1.6. Other Imaging Techniques
- 10.2. Market Analysis, Insights and Forecast - by Component
- 10.2.1. Hardware
- 10.2.2. Software
- 10.3. Market Analysis, Insights and Forecast - by End User
- 10.3.1. Hospitals
- 10.3.2. Diagnostic Centers
- 10.3.3. Other End Users
- 10.1. Market Analysis, Insights and Forecast - by Imaging Technique
- 11. South America Teleradiology Market Analysis, Insights and Forecast, 2020-2032
- 11.1. Market Analysis, Insights and Forecast - by Imaging Technique
- 11.1.1. X-rays
- 11.1.2. Computed Tomography (CT)
- 11.1.3. Ultrasound
- 11.1.4. Magnetic Resonance Imaging (MRI)
- 11.1.5. Nuclear Imaging
- 11.1.6. Other Imaging Techniques
- 11.2. Market Analysis, Insights and Forecast - by Component
- 11.2.1. Hardware
- 11.2.2. Software
- 11.3. Market Analysis, Insights and Forecast - by End User
- 11.3.1. Hospitals
- 11.3.2. Diagnostic Centers
- 11.3.3. Other End Users
- 11.1. Market Analysis, Insights and Forecast - by Imaging Technique
- 12. Competitive Analysis
- 12.1. Company Profiles
- 12.1.1 Onrad Inc
- 12.1.1.1. Company Overview
- 12.1.1.2. Products
- 12.1.1.3. Company Financials
- 12.1.1.4. SWOT Analysis
- 12.1.2 RamSoft Inc
- 12.1.2.1. Company Overview
- 12.1.2.2. Products
- 12.1.2.3. Company Financials
- 12.1.2.4. SWOT Analysis
- 12.1.3 GE Healthcare
- 12.1.3.1. Company Overview
- 12.1.3.2. Products
- 12.1.3.3. Company Financials
- 12.1.3.4. SWOT Analysis
- 12.1.4 Nanox Imaging LTD (USARAD COM)
- 12.1.4.1. Company Overview
- 12.1.4.2. Products
- 12.1.4.3. Company Financials
- 12.1.4.4. SWOT Analysis
- 12.1.5 Everlight Radiology
- 12.1.5.1. Company Overview
- 12.1.5.2. Products
- 12.1.5.3. Company Financials
- 12.1.5.4. SWOT Analysis
- 12.1.6 HealthWatch TeleDiagnostics Private Limited
- 12.1.6.1. Company Overview
- 12.1.6.2. Products
- 12.1.6.3. Company Financials
- 12.1.6.4. SWOT Analysis
- 12.1.7 Koninklijke Philips NV
- 12.1.7.1. Company Overview
- 12.1.7.2. Products
- 12.1.7.3. Company Financials
- 12.1.7.4. SWOT Analysis
- 12.1.8 4ways Healthcare Ltd
- 12.1.8.1. Company Overview
- 12.1.8.2. Products
- 12.1.8.3. Company Financials
- 12.1.8.4. SWOT Analysis
- 12.1.9 Teleradiology Solutions
- 12.1.9.1. Company Overview
- 12.1.9.2. Products
- 12.1.9.3. Company Financials
- 12.1.9.4. SWOT Analysis
- 12.1.10 Carestream Health
- 12.1.10.1. Company Overview
- 12.1.10.2. Products
- 12.1.10.3. Company Financials
- 12.1.10.4. SWOT Analysis
- 12.1.11 Agfa-Gevaert Group
- 12.1.11.1. Company Overview
- 12.1.11.2. Products
- 12.1.11.3. Company Financials
- 12.1.11.4. SWOT Analysis
- 12.1.1 Onrad Inc
- 12.2. Market Entropy
- 12.2.1 Company's Key Areas Served
- 12.2.2 Recent Developments
- 12.3. Company Market Share Analysis 2025
- 12.3.1 Top 5 Companies Market Share Analysis
- 12.3.2 Top 3 Companies Market Share Analysis
- 12.4. List of Potential Customers
- 13. Research Methodology
List of Figures
- Figure 1: Global Teleradiology Market Revenue Breakdown (Million, %) by Region 2025 & 2033
- Figure 2: Global Teleradiology Market Volume Breakdown (K Unit, %) by Region 2025 & 2033
- Figure 3: North America Teleradiology Market Revenue (Million), by Imaging Technique 2025 & 2033
- Figure 4: North America Teleradiology Market Volume (K Unit), by Imaging Technique 2025 & 2033
- Figure 5: North America Teleradiology Market Revenue Share (%), by Imaging Technique 2025 & 2033
- Figure 6: North America Teleradiology Market Volume Share (%), by Imaging Technique 2025 & 2033
- Figure 7: North America Teleradiology Market Revenue (Million), by Component 2025 & 2033
- Figure 8: North America Teleradiology Market Volume (K Unit), by Component 2025 & 2033
- Figure 9: North America Teleradiology Market Revenue Share (%), by Component 2025 & 2033
- Figure 10: North America Teleradiology Market Volume Share (%), by Component 2025 & 2033
- Figure 11: North America Teleradiology Market Revenue (Million), by End User 2025 & 2033
- Figure 12: North America Teleradiology Market Volume (K Unit), by End User 2025 & 2033
- Figure 13: North America Teleradiology Market Revenue Share (%), by End User 2025 & 2033
- Figure 14: North America Teleradiology Market Volume Share (%), by End User 2025 & 2033
- Figure 15: North America Teleradiology Market Revenue (Million), by Country 2025 & 2033
- Figure 16: North America Teleradiology Market Volume (K Unit), by Country 2025 & 2033
- Figure 17: North America Teleradiology Market Revenue Share (%), by Country 2025 & 2033
- Figure 18: North America Teleradiology Market Volume Share (%), by Country 2025 & 2033
- Figure 19: Europe Teleradiology Market Revenue (Million), by Imaging Technique 2025 & 2033
- Figure 20: Europe Teleradiology Market Volume (K Unit), by Imaging Technique 2025 & 2033
- Figure 21: Europe Teleradiology Market Revenue Share (%), by Imaging Technique 2025 & 2033
- Figure 22: Europe Teleradiology Market Volume Share (%), by Imaging Technique 2025 & 2033
- Figure 23: Europe Teleradiology Market Revenue (Million), by Component 2025 & 2033
- Figure 24: Europe Teleradiology Market Volume (K Unit), by Component 2025 & 2033
- Figure 25: Europe Teleradiology Market Revenue Share (%), by Component 2025 & 2033
- Figure 26: Europe Teleradiology Market Volume Share (%), by Component 2025 & 2033
- Figure 27: Europe Teleradiology Market Revenue (Million), by End User 2025 & 2033
- Figure 28: Europe Teleradiology Market Volume (K Unit), by End User 2025 & 2033
- Figure 29: Europe Teleradiology Market Revenue Share (%), by End User 2025 & 2033
- Figure 30: Europe Teleradiology Market Volume Share (%), by End User 2025 & 2033
- Figure 31: Europe Teleradiology Market Revenue (Million), by Country 2025 & 2033
- Figure 32: Europe Teleradiology Market Volume (K Unit), by Country 2025 & 2033
- Figure 33: Europe Teleradiology Market Revenue Share (%), by Country 2025 & 2033
- Figure 34: Europe Teleradiology Market Volume Share (%), by Country 2025 & 2033
- Figure 35: Asia Pacific Teleradiology Market Revenue (Million), by Imaging Technique 2025 & 2033
- Figure 36: Asia Pacific Teleradiology Market Volume (K Unit), by Imaging Technique 2025 & 2033
- Figure 37: Asia Pacific Teleradiology Market Revenue Share (%), by Imaging Technique 2025 & 2033
- Figure 38: Asia Pacific Teleradiology Market Volume Share (%), by Imaging Technique 2025 & 2033
- Figure 39: Asia Pacific Teleradiology Market Revenue (Million), by Component 2025 & 2033
- Figure 40: Asia Pacific Teleradiology Market Volume (K Unit), by Component 2025 & 2033
- Figure 41: Asia Pacific Teleradiology Market Revenue Share (%), by Component 2025 & 2033
- Figure 42: Asia Pacific Teleradiology Market Volume Share (%), by Component 2025 & 2033
- Figure 43: Asia Pacific Teleradiology Market Revenue (Million), by End User 2025 & 2033
- Figure 44: Asia Pacific Teleradiology Market Volume (K Unit), by End User 2025 & 2033
- Figure 45: Asia Pacific Teleradiology Market Revenue Share (%), by End User 2025 & 2033
- Figure 46: Asia Pacific Teleradiology Market Volume Share (%), by End User 2025 & 2033
- Figure 47: Asia Pacific Teleradiology Market Revenue (Million), by Country 2025 & 2033
- Figure 48: Asia Pacific Teleradiology Market Volume (K Unit), by Country 2025 & 2033
- Figure 49: Asia Pacific Teleradiology Market Revenue Share (%), by Country 2025 & 2033
- Figure 50: Asia Pacific Teleradiology Market Volume Share (%), by Country 2025 & 2033
- Figure 51: Middle East and Africa Teleradiology Market Revenue (Million), by Imaging Technique 2025 & 2033
- Figure 52: Middle East and Africa Teleradiology Market Volume (K Unit), by Imaging Technique 2025 & 2033
- Figure 53: Middle East and Africa Teleradiology Market Revenue Share (%), by Imaging Technique 2025 & 2033
- Figure 54: Middle East and Africa Teleradiology Market Volume Share (%), by Imaging Technique 2025 & 2033
- Figure 55: Middle East and Africa Teleradiology Market Revenue (Million), by Component 2025 & 2033
- Figure 56: Middle East and Africa Teleradiology Market Volume (K Unit), by Component 2025 & 2033
- Figure 57: Middle East and Africa Teleradiology Market Revenue Share (%), by Component 2025 & 2033
- Figure 58: Middle East and Africa Teleradiology Market Volume Share (%), by Component 2025 & 2033
- Figure 59: Middle East and Africa Teleradiology Market Revenue (Million), by End User 2025 & 2033
- Figure 60: Middle East and Africa Teleradiology Market Volume (K Unit), by End User 2025 & 2033
- Figure 61: Middle East and Africa Teleradiology Market Revenue Share (%), by End User 2025 & 2033
- Figure 62: Middle East and Africa Teleradiology Market Volume Share (%), by End User 2025 & 2033
- Figure 63: Middle East and Africa Teleradiology Market Revenue (Million), by Country 2025 & 2033
- Figure 64: Middle East and Africa Teleradiology Market Volume (K Unit), by Country 2025 & 2033
- Figure 65: Middle East and Africa Teleradiology Market Revenue Share (%), by Country 2025 & 2033
- Figure 66: Middle East and Africa Teleradiology Market Volume Share (%), by Country 2025 & 2033
- Figure 67: South America Teleradiology Market Revenue (Million), by Imaging Technique 2025 & 2033
- Figure 68: South America Teleradiology Market Volume (K Unit), by Imaging Technique 2025 & 2033
- Figure 69: South America Teleradiology Market Revenue Share (%), by Imaging Technique 2025 & 2033
- Figure 70: South America Teleradiology Market Volume Share (%), by Imaging Technique 2025 & 2033
- Figure 71: South America Teleradiology Market Revenue (Million), by Component 2025 & 2033
- Figure 72: South America Teleradiology Market Volume (K Unit), by Component 2025 & 2033
- Figure 73: South America Teleradiology Market Revenue Share (%), by Component 2025 & 2033
- Figure 74: South America Teleradiology Market Volume Share (%), by Component 2025 & 2033
- Figure 75: South America Teleradiology Market Revenue (Million), by End User 2025 & 2033
- Figure 76: South America Teleradiology Market Volume (K Unit), by End User 2025 & 2033
- Figure 77: South America Teleradiology Market Revenue Share (%), by End User 2025 & 2033
- Figure 78: South America Teleradiology Market Volume Share (%), by End User 2025 & 2033
- Figure 79: South America Teleradiology Market Revenue (Million), by Country 2025 & 2033
- Figure 80: South America Teleradiology Market Volume (K Unit), by Country 2025 & 2033
- Figure 81: South America Teleradiology Market Revenue Share (%), by Country 2025 & 2033
- Figure 82: South America Teleradiology Market Volume Share (%), by Country 2025 & 2033
List of Tables
- Table 1: Global Teleradiology Market Revenue Million Forecast, by Imaging Technique 2020 & 2033
- Table 2: Global Teleradiology Market Volume K Unit Forecast, by Imaging Technique 2020 & 2033
- Table 3: Global Teleradiology Market Revenue Million Forecast, by Component 2020 & 2033
- Table 4: Global Teleradiology Market Volume K Unit Forecast, by Component 2020 & 2033
- Table 5: Global Teleradiology Market Revenue Million Forecast, by End User 2020 & 2033
- Table 6: Global Teleradiology Market Volume K Unit Forecast, by End User 2020 & 2033
- Table 7: Global Teleradiology Market Revenue Million Forecast, by Region 2020 & 2033
- Table 8: Global Teleradiology Market Volume K Unit Forecast, by Region 2020 & 2033
- Table 9: Global Teleradiology Market Revenue Million Forecast, by Imaging Technique 2020 & 2033
- Table 10: Global Teleradiology Market Volume K Unit Forecast, by Imaging Technique 2020 & 2033
- Table 11: Global Teleradiology Market Revenue Million Forecast, by Component 2020 & 2033
- Table 12: Global Teleradiology Market Volume K Unit Forecast, by Component 2020 & 2033
- Table 13: Global Teleradiology Market Revenue Million Forecast, by End User 2020 & 2033
- Table 14: Global Teleradiology Market Volume K Unit Forecast, by End User 2020 & 2033
- Table 15: Global Teleradiology Market Revenue Million Forecast, by Country 2020 & 2033
- Table 16: Global Teleradiology Market Volume K Unit Forecast, by Country 2020 & 2033
- Table 17: United States Teleradiology Market Revenue (Million) Forecast, by Application 2020 & 2033
- Table 18: United States Teleradiology Market Volume (K Unit) Forecast, by Application 2020 & 2033
- Table 19: Canada Teleradiology Market Revenue (Million) Forecast, by Application 2020 & 2033
- Table 20: Canada Teleradiology Market Volume (K Unit) Forecast, by Application 2020 & 2033
- Table 21: Mexico Teleradiology Market Revenue (Million) Forecast, by Application 2020 & 2033
- Table 22: Mexico Teleradiology Market Volume (K Unit) Forecast, by Application 2020 & 2033
- Table 23: Global Teleradiology Market Revenue Million Forecast, by Imaging Technique 2020 & 2033
- Table 24: Global Teleradiology Market Volume K Unit Forecast, by Imaging Technique 2020 & 2033
- Table 25: Global Teleradiology Market Revenue Million Forecast, by Component 2020 & 2033
- Table 26: Global Teleradiology Market Volume K Unit Forecast, by Component 2020 & 2033
- Table 27: Global Teleradiology Market Revenue Million Forecast, by End User 2020 & 2033
- Table 28: Global Teleradiology Market Volume K Unit Forecast, by End User 2020 & 2033
- Table 29: Global Teleradiology Market Revenue Million Forecast, by Country 2020 & 2033
- Table 30: Global Teleradiology Market Volume K Unit Forecast, by Country 2020 & 2033
- Table 31: Germany Teleradiology Market Revenue (Million) Forecast, by Application 2020 & 2033
- Table 32: Germany Teleradiology Market Volume (K Unit) Forecast, by Application 2020 & 2033
- Table 33: United Kingdom Teleradiology Market Revenue (Million) Forecast, by Application 2020 & 2033
- Table 34: United Kingdom Teleradiology Market Volume (K Unit) Forecast, by Application 2020 & 2033
- Table 35: France Teleradiology Market Revenue (Million) Forecast, by Application 2020 & 2033
- Table 36: France Teleradiology Market Volume (K Unit) Forecast, by Application 2020 & 2033
- Table 37: Italy Teleradiology Market Revenue (Million) Forecast, by Application 2020 & 2033
- Table 38: Italy Teleradiology Market Volume (K Unit) Forecast, by Application 2020 & 2033
- Table 39: Spain Teleradiology Market Revenue (Million) Forecast, by Application 2020 & 2033
- Table 40: Spain Teleradiology Market Volume (K Unit) Forecast, by Application 2020 & 2033
- Table 41: Rest of Europe Teleradiology Market Revenue (Million) Forecast, by Application 2020 & 2033
- Table 42: Rest of Europe Teleradiology Market Volume (K Unit) Forecast, by Application 2020 & 2033
- Table 43: Global Teleradiology Market Revenue Million Forecast, by Imaging Technique 2020 & 2033
- Table 44: Global Teleradiology Market Volume K Unit Forecast, by Imaging Technique 2020 & 2033
- Table 45: Global Teleradiology Market Revenue Million Forecast, by Component 2020 & 2033
- Table 46: Global Teleradiology Market Volume K Unit Forecast, by Component 2020 & 2033
- Table 47: Global Teleradiology Market Revenue Million Forecast, by End User 2020 & 2033
- Table 48: Global Teleradiology Market Volume K Unit Forecast, by End User 2020 & 2033
- Table 49: Global Teleradiology Market Revenue Million Forecast, by Country 2020 & 2033
- Table 50: Global Teleradiology Market Volume K Unit Forecast, by Country 2020 & 2033
- Table 51: China Teleradiology Market Revenue (Million) Forecast, by Application 2020 & 2033
- Table 52: China Teleradiology Market Volume (K Unit) Forecast, by Application 2020 & 2033
- Table 53: Japan Teleradiology Market Revenue (Million) Forecast, by Application 2020 & 2033
- Table 54: Japan Teleradiology Market Volume (K Unit) Forecast, by Application 2020 & 2033
- Table 55: India Teleradiology Market Revenue (Million) Forecast, by Application 2020 & 2033
- Table 56: India Teleradiology Market Volume (K Unit) Forecast, by Application 2020 & 2033
- Table 57: Australia Teleradiology Market Revenue (Million) Forecast, by Application 2020 & 2033
- Table 58: Australia Teleradiology Market Volume (K Unit) Forecast, by Application 2020 & 2033
- Table 59: South Korea Teleradiology Market Revenue (Million) Forecast, by Application 2020 & 2033
- Table 60: South Korea Teleradiology Market Volume (K Unit) Forecast, by Application 2020 & 2033
- Table 61: Rest of Asia Pacific Teleradiology Market Revenue (Million) Forecast, by Application 2020 & 2033
- Table 62: Rest of Asia Pacific Teleradiology Market Volume (K Unit) Forecast, by Application 2020 & 2033
- Table 63: Global Teleradiology Market Revenue Million Forecast, by Imaging Technique 2020 & 2033
- Table 64: Global Teleradiology Market Volume K Unit Forecast, by Imaging Technique 2020 & 2033
- Table 65: Global Teleradiology Market Revenue Million Forecast, by Component 2020 & 2033
- Table 66: Global Teleradiology Market Volume K Unit Forecast, by Component 2020 & 2033
- Table 67: Global Teleradiology Market Revenue Million Forecast, by End User 2020 & 2033
- Table 68: Global Teleradiology Market Volume K Unit Forecast, by End User 2020 & 2033
- Table 69: Global Teleradiology Market Revenue Million Forecast, by Country 2020 & 2033
- Table 70: Global Teleradiology Market Volume K Unit Forecast, by Country 2020 & 2033
- Table 71: GCC Teleradiology Market Revenue (Million) Forecast, by Application 2020 & 2033
- Table 72: GCC Teleradiology Market Volume (K Unit) Forecast, by Application 2020 & 2033
- Table 73: South Africa Teleradiology Market Revenue (Million) Forecast, by Application 2020 & 2033
- Table 74: South Africa Teleradiology Market Volume (K Unit) Forecast, by Application 2020 & 2033
- Table 75: Rest of Middle East and Africa Teleradiology Market Revenue (Million) Forecast, by Application 2020 & 2033
- Table 76: Rest of Middle East and Africa Teleradiology Market Volume (K Unit) Forecast, by Application 2020 & 2033
- Table 77: Global Teleradiology Market Revenue Million Forecast, by Imaging Technique 2020 & 2033
- Table 78: Global Teleradiology Market Volume K Unit Forecast, by Imaging Technique 2020 & 2033
- Table 79: Global Teleradiology Market Revenue Million Forecast, by Component 2020 & 2033
- Table 80: Global Teleradiology Market Volume K Unit Forecast, by Component 2020 & 2033
- Table 81: Global Teleradiology Market Revenue Million Forecast, by End User 2020 & 2033
- Table 82: Global Teleradiology Market Volume K Unit Forecast, by End User 2020 & 2033
- Table 83: Global Teleradiology Market Revenue Million Forecast, by Country 2020 & 2033
- Table 84: Global Teleradiology Market Volume K Unit Forecast, by Country 2020 & 2033
- Table 85: Brazil Teleradiology Market Revenue (Million) Forecast, by Application 2020 & 2033
- Table 86: Brazil Teleradiology Market Volume (K Unit) Forecast, by Application 2020 & 2033
- Table 87: Argentina Teleradiology Market Revenue (Million) Forecast, by Application 2020 & 2033
- Table 88: Argentina Teleradiology Market Volume (K Unit) Forecast, by Application 2020 & 2033
- Table 89: Rest of South America Teleradiology Market Revenue (Million) Forecast, by Application 2020 & 2033
- Table 90: Rest of South America Teleradiology Market Volume (K Unit) Forecast, by Application 2020 & 2033
Frequently Asked Questions
1. What is the projected Compound Annual Growth Rate (CAGR) of the Teleradiology Market?
The projected CAGR is approximately 14.33%.
2. Which companies are prominent players in the Teleradiology Market?
Key companies in the market include Onrad Inc, RamSoft Inc, GE Healthcare, Nanox Imaging LTD (USARAD COM), Everlight Radiology, HealthWatch TeleDiagnostics Private Limited, Koninklijke Philips NV, 4ways Healthcare Ltd, Teleradiology Solutions, Carestream Health, Agfa-Gevaert Group.
3. What are the main segments of the Teleradiology Market?
The market segments include Imaging Technique, Component, End User.
4. Can you provide details about the market size?
The market size is estimated to be USD 39.90 Million as of 2022.
5. What are some drivers contributing to market growth?
Rising Number of Imaging Procedures; Development of IT Infrastructure and Rise in Healthcare Expenditure; Increasing Prevalence of Osteoarthritis and Chronic Diseases.
6. What are the notable trends driving market growth?
Software Segment is Expected to Register Fastest Growth Over the Forecast Period.
7. Are there any restraints impacting market growth?
Lack of Skilled Professionals; Security Concerns Associated with Teleradiology.
8. Can you provide examples of recent developments in the market?
April 2023: Aster DM Healthcare opened its Telecommand Center and Digital Health facility in India, which uses cutting-edge technology to provide all telehealth services under one roof, including teleradiology.
9. What pricing options are available for accessing the report?
Pricing options include single-user, multi-user, and enterprise licenses priced at USD 4750, USD 5250, and USD 8750 respectively.
10. Is the market size provided in terms of value or volume?
The market size is provided in terms of value, measured in Million and volume, measured in K Unit.
11. Are there any specific market keywords associated with the report?
Yes, the market keyword associated with the report is "Teleradiology Market," which aids in identifying and referencing the specific market segment covered.
12. How do I determine which pricing option suits my needs best?
The pricing options vary based on user requirements and access needs. Individual users may opt for single-user licenses, while businesses requiring broader access may choose multi-user or enterprise licenses for cost-effective access to the report.
13. Are there any additional resources or data provided in the Teleradiology Market report?
While the report offers comprehensive insights, it's advisable to review the specific contents or supplementary materials provided to ascertain if additional resources or data are available.
14. How can I stay updated on further developments or reports in the Teleradiology Market?
To stay informed about further developments, trends, and reports in the Teleradiology Market, consider subscribing to industry newsletters, following relevant companies and organizations, or regularly checking reputable industry news sources and publications.
Methodology
Step 1 - Identification of Relevant Samples Size from Population Database


Step 2 - Approaches for Defining Global Market Size (Value, Volume* & Price*)

Note*: In applicable scenarios
Step 3 - Data Sources
Primary Research
- Web Analytics
- Survey Reports
- Research Institute
- Latest Research Reports
- Opinion Leaders
Secondary Research
- Annual Reports
- White Paper
- Latest Press Release
- Industry Association
- Paid Database
- Investor Presentations

Step 4 - Data Triangulation
Involves using different sources of information in order to increase the validity of a study
These sources are likely to be stakeholders in a program - participants, other researchers, program staff, other community members, and so on.
Then we put all data in single framework & apply various statistical tools to find out the dynamic on the market.
During the analysis stage, feedback from the stakeholder groups would be compared to determine areas of agreement as well as areas of divergence