

Key Insights
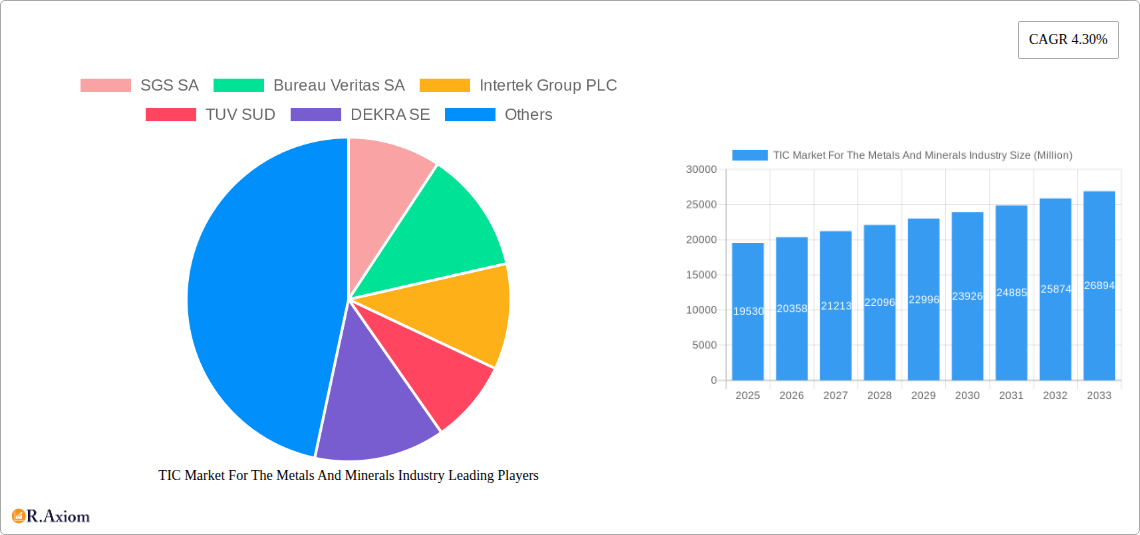
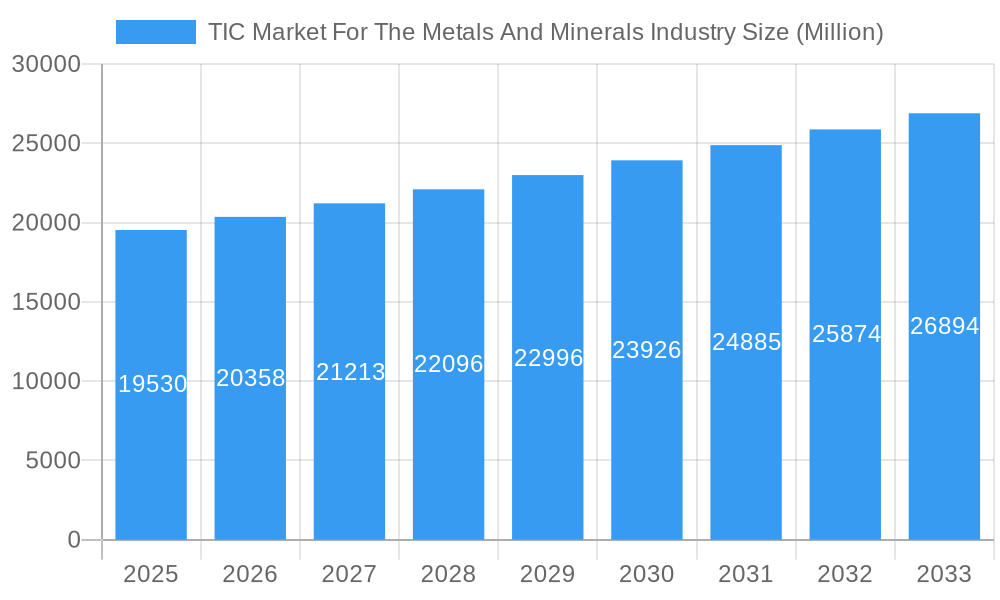
The global Third-Party Inspection (TIC) market for the metals and minerals industry is experiencing robust growth, projected to reach \$19.53 billion in 2025 and maintain a Compound Annual Growth Rate (CAGR) of 4.30% from 2025 to 2033. This expansion is fueled by several key factors. Increasing demand for quality assurance and regulatory compliance within the mining and metals sectors is a primary driver, prompting companies to outsource inspection and testing services to specialized TIC providers. Furthermore, the growing complexity of manufacturing processes and the need for advanced materials testing necessitate the expertise offered by these organizations. Stringent safety regulations and a focus on risk mitigation further contribute to market growth. Technological advancements, such as the adoption of automated inspection systems and advanced analytical techniques, are enhancing efficiency and accuracy, leading to greater market adoption of TIC services. However, the market faces certain constraints, including economic fluctuations impacting capital expenditure in the metals and minerals industry, and the potential for price competition among various TIC providers.
TIC Market For The Metals And Minerals Industry Market Size (In Billion)
Despite these challenges, the market demonstrates significant potential for continued growth. The rising focus on sustainability and the growing demand for responsibly sourced minerals are driving the need for more thorough inspections and certifications. This trend is likely to propel the segment focused on environmental and social compliance within the TIC market. The major players in this space, including SGS SA, Bureau Veritas SA, Intertek Group PLC, and TÜV SÜD, are well-positioned to benefit from this trend due to their established global presence and extensive service portfolios. Furthermore, strategic acquisitions and partnerships are likely to reshape the competitive landscape, consolidating market share among larger players. The fragmentation of the market among smaller, regional providers presents opportunities for consolidation and expansion for these larger firms. Overall, the TIC market for the metals and minerals sector presents a compelling investment opportunity for the foreseeable future.
TIC Market For The Metals And Minerals Industry Company Market Share
TIC Market For The Metals And Minerals Industry: A Comprehensive Report (2019-2033)
This detailed report provides a comprehensive analysis of the Testing, Inspection, and Certification (TIC) market for the metals and minerals industry, covering the period from 2019 to 2033. It offers actionable insights into market dynamics, competitive landscapes, and future growth opportunities, empowering stakeholders to make informed strategic decisions. The report incorporates extensive data analysis, incorporating key market trends, recent industry developments, and projections for future growth. The study period spans from 2019-2024 (historical), with 2025 as the base year and the forecast period extending to 2033. The report is invaluable for businesses operating within this sector, investors seeking growth opportunities, and regulatory bodies interested in understanding market developments.
TIC Market For The Metals And Minerals Industry Market Concentration & Innovation
The TIC market for the metals and minerals industry exhibits a moderately concentrated landscape, dominated by several multinational players and a longer tail of regional specialists. Market share analysis reveals a top five players holding approximately xx% of the global market in 2025, with the remaining share distributed among numerous smaller firms. This concentration is influenced by high barriers to entry, including substantial capital investment for laboratory infrastructure and accreditation. Innovation is driven by advancements in materials science, stricter regulatory compliance demands, and the need for enhanced efficiency and safety across the metals and minerals supply chain.
- Market Leaders: SGS SA, Bureau Veritas SA, Intertek Group PLC, TÜV SÜD, and DEKRA SE, hold significant market share.
- Innovation Drivers: Advancements in analytical techniques (e.g., spectroscopy, microscopy), automation of testing processes, and the development of advanced data analytics for quality control.
- Regulatory Frameworks: Stringent international and regional standards (e.g., ISO, ASTM) are key drivers shaping innovation and market consolidation.
- Product Substitutes: Limited direct substitutes exist; however, improvements in in-house testing capabilities by some companies could put pressure on the market.
- End-User Trends: Increasing demand for traceability, sustainability certifications, and real-time quality monitoring is pushing adoption of advanced TIC services.
- M&A Activities: Significant M&A activity has been observed in recent years, primarily driven by companies seeking to expand their service offerings and geographical reach. The total value of M&A deals in the sector between 2019-2024 amounted to approximately xx Million USD.
TIC Market For The Metals And Minerals Industry Industry Trends & Insights
The global TIC market for the metals and minerals industry is experiencing robust growth, propelled by factors such as rising infrastructure development, increasing demand for high-quality materials, stringent regulatory compliance, and the growing focus on environmental sustainability. The market is projected to register a CAGR of xx% during the forecast period (2025-2033), reaching a market size of xx Million by 2033. Technological advancements are leading to more accurate, efficient, and cost-effective testing methods. Consumer preferences are shifting towards greater transparency and traceability, driving demand for comprehensive TIC services. The industry exhibits a competitive landscape with companies constantly vying for market share through innovation, expansion, and strategic partnerships. Market penetration of advanced testing techniques is estimated to reach xx% by 2033.
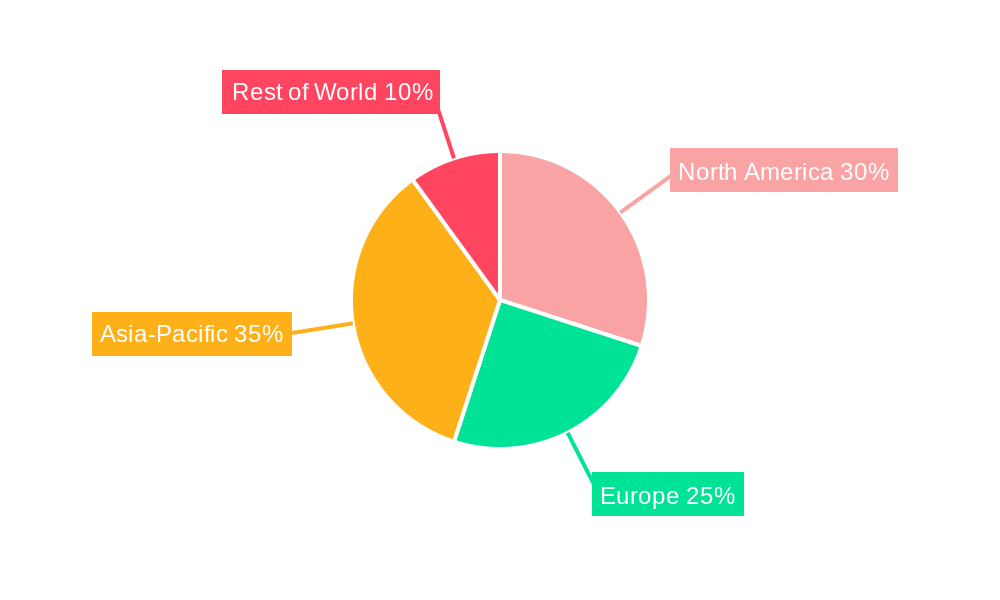
Dominant Markets & Segments in TIC Market For The Metals And Minerals Industry
The North American region currently holds the largest market share, driven by substantial industrial activity and robust infrastructure spending. However, Asia-Pacific is projected to exhibit the fastest growth during the forecast period due to rapid industrialization and rising investments in mining and infrastructure projects.
- Key Drivers for North America: Robust industrial base, stringent environmental regulations, and a strong presence of major TIC providers.
- Key Drivers for Asia-Pacific: Rapid industrialization, significant investments in mining and infrastructure, and a growing demand for quality control.
- Key Drivers for Europe: Stringent environmental regulations, focus on sustainable practices, and a well-established TIC infrastructure.
TIC Market For The Metals And Minerals Industry Product Developments
Recent product innovations focus on automated testing equipment, advanced analytical techniques (e.g., advanced spectroscopy, mass spectrometry), and specialized testing services tailored to specific materials and applications. These developments offer enhanced accuracy, efficiency, and cost-effectiveness, addressing the industry's need for real-time quality monitoring and stringent regulatory compliance. Competitive advantages are derived from superior analytical capabilities, specialized expertise, faster turnaround times, and global reach.
Report Scope & Segmentation Analysis
The report segments the TIC market based on several parameters, including testing type (e.g., chemical analysis, mechanical testing, non-destructive testing), service type (e.g., inspection, certification, verification), application (e.g., mining, steel, construction), and geography. Each segment shows varying growth projections and competitive dynamics based on their unique drivers and challenges. The detailed segmentation allows for in-depth analysis of individual segments and their contributions to the overall market growth.
Key Drivers of TIC Market For The Metals And Minerals Industry Growth
The market's growth is largely driven by factors including rising demand for high-quality metals and minerals, increasing investments in infrastructure projects globally, strengthening environmental regulations, and advancements in testing technologies. The push for sustainable and responsible sourcing in supply chains is also a significant driver.
Challenges in the TIC Market For The Metals And Minerals Industry Sector
The TIC market faces challenges including stringent regulatory requirements, ensuring accurate and reliable testing, managing rising operational costs, maintaining global supply chain stability, and the intense competition among existing industry players. These factors can impact profitability and expansion strategies.
Emerging Opportunities in TIC Market For The Metals And Minerals Industry
Emerging opportunities include the expansion of services into new geographic regions, development of specialized testing services for niche materials, focus on sustainable and responsible sourcing and increased adoption of digital technologies for remote testing and data analysis. Demand for data-driven insights and integrated quality management systems also presents a significant opportunity.
Leading Players in the TIC Market For The Metals And Minerals Industry Market
- SGS SA
- Bureau Veritas SA
- Intertek Group PLC
- TÜV SÜD
- DEKRA SE
- ALS Limited
- Applus+
- Eurofins Scientific SE
- DNV Group AS
- Element Materials Technology Group Limited
- Mistras Group Inc
- Kiwa NV
- UL Solutions Inc
- Rina SPA
- Qima
- Westmoreland Mechanical Testing and Research Inc
- Laboratory Testing Inc
- NSL Analytical Services Inc
- IMR Test Labs (Curtiss Wright Corporation)
- Applied Technical Services LLC
- *List Not Exhaustive
Key Developments in TIC Market For The Metals And Minerals Industry Industry
- August 2024: Element Materials Technology invested USD 13 Million to expand its Canadian operations, launching two new laboratories in Toronto, focusing on advanced life sciences and metals testing. This signifies a strategic move to cater to the growing pharmaceutical and biotechnology sectors' demand for high-quality testing.
- June 2024: UL Solutions Inc. announced plans to build the Advanced Automotive and Battery Testing Center in Korea, expanding its battery testing capabilities and supporting the growth of Korea's electric vehicle industry. This positions them to capitalize on the booming EV sector's demand for comprehensive testing services.
- March 2024: Applus+ played a significant role in the technical supervision of the 220 kV transmission line project in Peru. This highlights their involvement in large-scale infrastructure projects and the demand for TIC services in the energy sector.
Strategic Outlook for TIC Market For The Metals And Minerals Industry Market
The TIC market for the metals and minerals industry presents a promising outlook, with continuous growth projected across key segments. Increasing regulatory scrutiny, the burgeoning renewable energy sector's demand for materials testing, and ongoing technological advancements will drive market expansion. Companies that strategically invest in advanced technologies, expand their service offerings, and focus on sustainable practices are well-positioned to capitalize on future growth opportunities.
TIC Market For The Metals And Minerals Industry Segmentation
-
1. Operation Type
- 1.1. In-house
- 1.2. Outsourced
-
2. Service Type
- 2.1. Testing And Inspection
- 2.2. Certification
-
3. Material Type
- 3.1. Metals/Metal Powders
- 3.2. Composites
-
4. End-user Industry
- 4.1. Automotive
- 4.2. Aerospace and Defense
- 4.3. Energy and Power
- 4.4. Manufacturing
- 4.5. Construction
- 4.6. Oil and Gas
- 4.7. Other End-user Industries
TIC Market For The Metals And Minerals Industry Segmentation By Geography
-
1. North America
- 1.1. United States
- 1.2. Canada
-
2. Europe
- 2.1. United Kingdom
- 2.2. Germany
- 2.3. France
-
3. Asia
- 3.1. China
- 3.2. Japan
- 3.3. South Korea
- 3.4. South East Asia
- 3.5. India
- 4. Australia and New Zealand
- 5. Latin America
- 6. Middle East and Africa
TIC Market For The Metals And Minerals Industry Regional Market Share
Geographic Coverage of TIC Market For The Metals And Minerals Industry
TIC Market For The Metals And Minerals Industry REPORT HIGHLIGHTS
| Aspects | Details |
|---|---|
| Study Period | 2020-2034 |
| Base Year | 2025 |
| Estimated Year | 2026 |
| Forecast Period | 2026-2034 |
| Historical Period | 2020-2025 |
| Growth Rate | CAGR of 4.30% from 2020-2034 |
| Segmentation |
|
Table of Contents
- 1. Introduction
- 1.1. Research Scope
- 1.2. Market Segmentation
- 1.3. Research Objective
- 1.4. Definitions and Assumptions
- 2. Executive Summary
- 2.1. Market Snapshot
- 3. Market Dynamics
- 3.1. Market Drivers
- 3.2. Market Restrains
- 3.3. Market Trends
- 3.4. Market Opportunities
- 4. Market Factor Analysis
- 4.1. Porters Five Forces
- 4.1.1. Bargaining Power of Suppliers
- 4.1.2. Bargaining Power of Buyers
- 4.1.3. Threat of New Entrants
- 4.1.4. Threat of Substitutes
- 4.1.5. Competitive Rivalry
- 4.2. PESTEL analysis
- 4.3. BCG Analysis
- 4.3.1. Stars (High Growth, High Market Share)
- 4.3.2. Cash Cows (Low Growth, High Market Share)
- 4.3.3. Question Mark (High Growth, Low Market Share)
- 4.3.4. Dogs (Low Growth, Low Market Share)
- 4.4. Ansoff Matrix Analysis
- 4.5. Supply Chain Analysis
- 4.6. Regulatory Landscape
- 4.7. Current Market Potential and Opportunity Assessment (TAM–SAM–SOM Framework)
- 4.8. RAX Analyst Note
- 4.1. Porters Five Forces
- 5. Market Analysis, Insights and Forecast 2021-2033
- 5.1. Market Analysis, Insights and Forecast - by Operation Type
- 5.1.1. In-house
- 5.1.2. Outsourced
- 5.2. Market Analysis, Insights and Forecast - by Service Type
- 5.2.1. Testing And Inspection
- 5.2.2. Certification
- 5.3. Market Analysis, Insights and Forecast - by Material Type
- 5.3.1. Metals/Metal Powders
- 5.3.2. Composites
- 5.4. Market Analysis, Insights and Forecast - by End-user Industry
- 5.4.1. Automotive
- 5.4.2. Aerospace and Defense
- 5.4.3. Energy and Power
- 5.4.4. Manufacturing
- 5.4.5. Construction
- 5.4.6. Oil and Gas
- 5.4.7. Other End-user Industries
- 5.5. Market Analysis, Insights and Forecast - by Region
- 5.5.1. North America
- 5.5.2. Europe
- 5.5.3. Asia
- 5.5.4. Australia and New Zealand
- 5.5.5. Latin America
- 5.5.6. Middle East and Africa
- 5.1. Market Analysis, Insights and Forecast - by Operation Type
- 6. Global TIC Market For The Metals And Minerals Industry Analysis, Insights and Forecast, 2021-2033
- 6.1. Market Analysis, Insights and Forecast - by Operation Type
- 6.1.1. In-house
- 6.1.2. Outsourced
- 6.2. Market Analysis, Insights and Forecast - by Service Type
- 6.2.1. Testing And Inspection
- 6.2.2. Certification
- 6.3. Market Analysis, Insights and Forecast - by Material Type
- 6.3.1. Metals/Metal Powders
- 6.3.2. Composites
- 6.4. Market Analysis, Insights and Forecast - by End-user Industry
- 6.4.1. Automotive
- 6.4.2. Aerospace and Defense
- 6.4.3. Energy and Power
- 6.4.4. Manufacturing
- 6.4.5. Construction
- 6.4.6. Oil and Gas
- 6.4.7. Other End-user Industries
- 6.1. Market Analysis, Insights and Forecast - by Operation Type
- 7. North America TIC Market For The Metals And Minerals Industry Analysis, Insights and Forecast, 2020-2032
- 7.1. Market Analysis, Insights and Forecast - by Operation Type
- 7.1.1. In-house
- 7.1.2. Outsourced
- 7.2. Market Analysis, Insights and Forecast - by Service Type
- 7.2.1. Testing And Inspection
- 7.2.2. Certification
- 7.3. Market Analysis, Insights and Forecast - by Material Type
- 7.3.1. Metals/Metal Powders
- 7.3.2. Composites
- 7.4. Market Analysis, Insights and Forecast - by End-user Industry
- 7.4.1. Automotive
- 7.4.2. Aerospace and Defense
- 7.4.3. Energy and Power
- 7.4.4. Manufacturing
- 7.4.5. Construction
- 7.4.6. Oil and Gas
- 7.4.7. Other End-user Industries
- 7.1. Market Analysis, Insights and Forecast - by Operation Type
- 8. Europe TIC Market For The Metals And Minerals Industry Analysis, Insights and Forecast, 2020-2032
- 8.1. Market Analysis, Insights and Forecast - by Operation Type
- 8.1.1. In-house
- 8.1.2. Outsourced
- 8.2. Market Analysis, Insights and Forecast - by Service Type
- 8.2.1. Testing And Inspection
- 8.2.2. Certification
- 8.3. Market Analysis, Insights and Forecast - by Material Type
- 8.3.1. Metals/Metal Powders
- 8.3.2. Composites
- 8.4. Market Analysis, Insights and Forecast - by End-user Industry
- 8.4.1. Automotive
- 8.4.2. Aerospace and Defense
- 8.4.3. Energy and Power
- 8.4.4. Manufacturing
- 8.4.5. Construction
- 8.4.6. Oil and Gas
- 8.4.7. Other End-user Industries
- 8.1. Market Analysis, Insights and Forecast - by Operation Type
- 9. Asia TIC Market For The Metals And Minerals Industry Analysis, Insights and Forecast, 2020-2032
- 9.1. Market Analysis, Insights and Forecast - by Operation Type
- 9.1.1. In-house
- 9.1.2. Outsourced
- 9.2. Market Analysis, Insights and Forecast - by Service Type
- 9.2.1. Testing And Inspection
- 9.2.2. Certification
- 9.3. Market Analysis, Insights and Forecast - by Material Type
- 9.3.1. Metals/Metal Powders
- 9.3.2. Composites
- 9.4. Market Analysis, Insights and Forecast - by End-user Industry
- 9.4.1. Automotive
- 9.4.2. Aerospace and Defense
- 9.4.3. Energy and Power
- 9.4.4. Manufacturing
- 9.4.5. Construction
- 9.4.6. Oil and Gas
- 9.4.7. Other End-user Industries
- 9.1. Market Analysis, Insights and Forecast - by Operation Type
- 10. Australia and New Zealand TIC Market For The Metals And Minerals Industry Analysis, Insights and Forecast, 2020-2032
- 10.1. Market Analysis, Insights and Forecast - by Operation Type
- 10.1.1. In-house
- 10.1.2. Outsourced
- 10.2. Market Analysis, Insights and Forecast - by Service Type
- 10.2.1. Testing And Inspection
- 10.2.2. Certification
- 10.3. Market Analysis, Insights and Forecast - by Material Type
- 10.3.1. Metals/Metal Powders
- 10.3.2. Composites
- 10.4. Market Analysis, Insights and Forecast - by End-user Industry
- 10.4.1. Automotive
- 10.4.2. Aerospace and Defense
- 10.4.3. Energy and Power
- 10.4.4. Manufacturing
- 10.4.5. Construction
- 10.4.6. Oil and Gas
- 10.4.7. Other End-user Industries
- 10.1. Market Analysis, Insights and Forecast - by Operation Type
- 11. Latin America TIC Market For The Metals And Minerals Industry Analysis, Insights and Forecast, 2020-2032
- 11.1. Market Analysis, Insights and Forecast - by Operation Type
- 11.1.1. In-house
- 11.1.2. Outsourced
- 11.2. Market Analysis, Insights and Forecast - by Service Type
- 11.2.1. Testing And Inspection
- 11.2.2. Certification
- 11.3. Market Analysis, Insights and Forecast - by Material Type
- 11.3.1. Metals/Metal Powders
- 11.3.2. Composites
- 11.4. Market Analysis, Insights and Forecast - by End-user Industry
- 11.4.1. Automotive
- 11.4.2. Aerospace and Defense
- 11.4.3. Energy and Power
- 11.4.4. Manufacturing
- 11.4.5. Construction
- 11.4.6. Oil and Gas
- 11.4.7. Other End-user Industries
- 11.1. Market Analysis, Insights and Forecast - by Operation Type
- 12. Middle East and Africa TIC Market For The Metals And Minerals Industry Analysis, Insights and Forecast, 2020-2032
- 12.1. Market Analysis, Insights and Forecast - by Operation Type
- 12.1.1. In-house
- 12.1.2. Outsourced
- 12.2. Market Analysis, Insights and Forecast - by Service Type
- 12.2.1. Testing And Inspection
- 12.2.2. Certification
- 12.3. Market Analysis, Insights and Forecast - by Material Type
- 12.3.1. Metals/Metal Powders
- 12.3.2. Composites
- 12.4. Market Analysis, Insights and Forecast - by End-user Industry
- 12.4.1. Automotive
- 12.4.2. Aerospace and Defense
- 12.4.3. Energy and Power
- 12.4.4. Manufacturing
- 12.4.5. Construction
- 12.4.6. Oil and Gas
- 12.4.7. Other End-user Industries
- 12.1. Market Analysis, Insights and Forecast - by Operation Type
- 13. Competitive Analysis
- 13.1. Company Profiles
- 13.1.1 SGS SA
- 13.1.1.1. Company Overview
- 13.1.1.2. Products
- 13.1.1.3. Company Financials
- 13.1.1.4. SWOT Analysis
- 13.1.2 Bureau Veritas SA
- 13.1.2.1. Company Overview
- 13.1.2.2. Products
- 13.1.2.3. Company Financials
- 13.1.2.4. SWOT Analysis
- 13.1.3 Intertek Group PLC
- 13.1.3.1. Company Overview
- 13.1.3.2. Products
- 13.1.3.3. Company Financials
- 13.1.3.4. SWOT Analysis
- 13.1.4 TUV SUD
- 13.1.4.1. Company Overview
- 13.1.4.2. Products
- 13.1.4.3. Company Financials
- 13.1.4.4. SWOT Analysis
- 13.1.5 DEKRA SE
- 13.1.5.1. Company Overview
- 13.1.5.2. Products
- 13.1.5.3. Company Financials
- 13.1.5.4. SWOT Analysis
- 13.1.6 ALS Limited
- 13.1.6.1. Company Overview
- 13.1.6.2. Products
- 13.1.6.3. Company Financials
- 13.1.6.4. SWOT Analysis
- 13.1.7 Applus+
- 13.1.7.1. Company Overview
- 13.1.7.2. Products
- 13.1.7.3. Company Financials
- 13.1.7.4. SWOT Analysis
- 13.1.8 Eurofins Scientific SE
- 13.1.8.1. Company Overview
- 13.1.8.2. Products
- 13.1.8.3. Company Financials
- 13.1.8.4. SWOT Analysis
- 13.1.9 DNV Group AS
- 13.1.9.1. Company Overview
- 13.1.9.2. Products
- 13.1.9.3. Company Financials
- 13.1.9.4. SWOT Analysis
- 13.1.10 Element Materials Technology Group Limited
- 13.1.10.1. Company Overview
- 13.1.10.2. Products
- 13.1.10.3. Company Financials
- 13.1.10.4. SWOT Analysis
- 13.1.11 Mistras Group Inc
- 13.1.11.1. Company Overview
- 13.1.11.2. Products
- 13.1.11.3. Company Financials
- 13.1.11.4. SWOT Analysis
- 13.1.12 Kiwa NV
- 13.1.12.1. Company Overview
- 13.1.12.2. Products
- 13.1.12.3. Company Financials
- 13.1.12.4. SWOT Analysis
- 13.1.13 UL Solutions Inc
- 13.1.13.1. Company Overview
- 13.1.13.2. Products
- 13.1.13.3. Company Financials
- 13.1.13.4. SWOT Analysis
- 13.1.14 Rina SPA
- 13.1.14.1. Company Overview
- 13.1.14.2. Products
- 13.1.14.3. Company Financials
- 13.1.14.4. SWOT Analysis
- 13.1.15 Qima
- 13.1.15.1. Company Overview
- 13.1.15.2. Products
- 13.1.15.3. Company Financials
- 13.1.15.4. SWOT Analysis
- 13.1.16 Westmoreland Mechanical Testing and Research Inc
- 13.1.16.1. Company Overview
- 13.1.16.2. Products
- 13.1.16.3. Company Financials
- 13.1.16.4. SWOT Analysis
- 13.1.17 Laboratory Testing Inc
- 13.1.17.1. Company Overview
- 13.1.17.2. Products
- 13.1.17.3. Company Financials
- 13.1.17.4. SWOT Analysis
- 13.1.18 NSL Analytical Services Inc
- 13.1.18.1. Company Overview
- 13.1.18.2. Products
- 13.1.18.3. Company Financials
- 13.1.18.4. SWOT Analysis
- 13.1.19 IMR Test Labs (Curtiss Wright Corporation)
- 13.1.19.1. Company Overview
- 13.1.19.2. Products
- 13.1.19.3. Company Financials
- 13.1.19.4. SWOT Analysis
- 13.1.20 Applied Technical Services LLC*List Not Exhaustive
- 13.1.20.1. Company Overview
- 13.1.20.2. Products
- 13.1.20.3. Company Financials
- 13.1.20.4. SWOT Analysis
- 13.1.1 SGS SA
- 13.2. Market Entropy
- 13.2.1 Company's Key Areas Served
- 13.2.2 Recent Developments
- 13.3. Company Market Share Analysis 2025
- 13.3.1 Top 5 Companies Market Share Analysis
- 13.3.2 Top 3 Companies Market Share Analysis
- 13.4. List of Potential Customers
- 14. Research Methodology
List of Figures
- Figure 1: Global TIC Market For The Metals And Minerals Industry Revenue Breakdown (Million, %) by Region 2025 & 2033
- Figure 2: Global TIC Market For The Metals And Minerals Industry Volume Breakdown (Billion, %) by Region 2025 & 2033
- Figure 3: North America TIC Market For The Metals And Minerals Industry Revenue (Million), by Operation Type 2025 & 2033
- Figure 4: North America TIC Market For The Metals And Minerals Industry Volume (Billion), by Operation Type 2025 & 2033
- Figure 5: North America TIC Market For The Metals And Minerals Industry Revenue Share (%), by Operation Type 2025 & 2033
- Figure 6: North America TIC Market For The Metals And Minerals Industry Volume Share (%), by Operation Type 2025 & 2033
- Figure 7: North America TIC Market For The Metals And Minerals Industry Revenue (Million), by Service Type 2025 & 2033
- Figure 8: North America TIC Market For The Metals And Minerals Industry Volume (Billion), by Service Type 2025 & 2033
- Figure 9: North America TIC Market For The Metals And Minerals Industry Revenue Share (%), by Service Type 2025 & 2033
- Figure 10: North America TIC Market For The Metals And Minerals Industry Volume Share (%), by Service Type 2025 & 2033
- Figure 11: North America TIC Market For The Metals And Minerals Industry Revenue (Million), by Material Type 2025 & 2033
- Figure 12: North America TIC Market For The Metals And Minerals Industry Volume (Billion), by Material Type 2025 & 2033
- Figure 13: North America TIC Market For The Metals And Minerals Industry Revenue Share (%), by Material Type 2025 & 2033
- Figure 14: North America TIC Market For The Metals And Minerals Industry Volume Share (%), by Material Type 2025 & 2033
- Figure 15: North America TIC Market For The Metals And Minerals Industry Revenue (Million), by End-user Industry 2025 & 2033
- Figure 16: North America TIC Market For The Metals And Minerals Industry Volume (Billion), by End-user Industry 2025 & 2033
- Figure 17: North America TIC Market For The Metals And Minerals Industry Revenue Share (%), by End-user Industry 2025 & 2033
- Figure 18: North America TIC Market For The Metals And Minerals Industry Volume Share (%), by End-user Industry 2025 & 2033
- Figure 19: North America TIC Market For The Metals And Minerals Industry Revenue (Million), by Country 2025 & 2033
- Figure 20: North America TIC Market For The Metals And Minerals Industry Volume (Billion), by Country 2025 & 2033
- Figure 21: North America TIC Market For The Metals And Minerals Industry Revenue Share (%), by Country 2025 & 2033
- Figure 22: North America TIC Market For The Metals And Minerals Industry Volume Share (%), by Country 2025 & 2033
- Figure 23: Europe TIC Market For The Metals And Minerals Industry Revenue (Million), by Operation Type 2025 & 2033
- Figure 24: Europe TIC Market For The Metals And Minerals Industry Volume (Billion), by Operation Type 2025 & 2033
- Figure 25: Europe TIC Market For The Metals And Minerals Industry Revenue Share (%), by Operation Type 2025 & 2033
- Figure 26: Europe TIC Market For The Metals And Minerals Industry Volume Share (%), by Operation Type 2025 & 2033
- Figure 27: Europe TIC Market For The Metals And Minerals Industry Revenue (Million), by Service Type 2025 & 2033
- Figure 28: Europe TIC Market For The Metals And Minerals Industry Volume (Billion), by Service Type 2025 & 2033
- Figure 29: Europe TIC Market For The Metals And Minerals Industry Revenue Share (%), by Service Type 2025 & 2033
- Figure 30: Europe TIC Market For The Metals And Minerals Industry Volume Share (%), by Service Type 2025 & 2033
- Figure 31: Europe TIC Market For The Metals And Minerals Industry Revenue (Million), by Material Type 2025 & 2033
- Figure 32: Europe TIC Market For The Metals And Minerals Industry Volume (Billion), by Material Type 2025 & 2033
- Figure 33: Europe TIC Market For The Metals And Minerals Industry Revenue Share (%), by Material Type 2025 & 2033
- Figure 34: Europe TIC Market For The Metals And Minerals Industry Volume Share (%), by Material Type 2025 & 2033
- Figure 35: Europe TIC Market For The Metals And Minerals Industry Revenue (Million), by End-user Industry 2025 & 2033
- Figure 36: Europe TIC Market For The Metals And Minerals Industry Volume (Billion), by End-user Industry 2025 & 2033
- Figure 37: Europe TIC Market For The Metals And Minerals Industry Revenue Share (%), by End-user Industry 2025 & 2033
- Figure 38: Europe TIC Market For The Metals And Minerals Industry Volume Share (%), by End-user Industry 2025 & 2033
- Figure 39: Europe TIC Market For The Metals And Minerals Industry Revenue (Million), by Country 2025 & 2033
- Figure 40: Europe TIC Market For The Metals And Minerals Industry Volume (Billion), by Country 2025 & 2033
- Figure 41: Europe TIC Market For The Metals And Minerals Industry Revenue Share (%), by Country 2025 & 2033
- Figure 42: Europe TIC Market For The Metals And Minerals Industry Volume Share (%), by Country 2025 & 2033
- Figure 43: Asia TIC Market For The Metals And Minerals Industry Revenue (Million), by Operation Type 2025 & 2033
- Figure 44: Asia TIC Market For The Metals And Minerals Industry Volume (Billion), by Operation Type 2025 & 2033
- Figure 45: Asia TIC Market For The Metals And Minerals Industry Revenue Share (%), by Operation Type 2025 & 2033
- Figure 46: Asia TIC Market For The Metals And Minerals Industry Volume Share (%), by Operation Type 2025 & 2033
- Figure 47: Asia TIC Market For The Metals And Minerals Industry Revenue (Million), by Service Type 2025 & 2033
- Figure 48: Asia TIC Market For The Metals And Minerals Industry Volume (Billion), by Service Type 2025 & 2033
- Figure 49: Asia TIC Market For The Metals And Minerals Industry Revenue Share (%), by Service Type 2025 & 2033
- Figure 50: Asia TIC Market For The Metals And Minerals Industry Volume Share (%), by Service Type 2025 & 2033
- Figure 51: Asia TIC Market For The Metals And Minerals Industry Revenue (Million), by Material Type 2025 & 2033
- Figure 52: Asia TIC Market For The Metals And Minerals Industry Volume (Billion), by Material Type 2025 & 2033
- Figure 53: Asia TIC Market For The Metals And Minerals Industry Revenue Share (%), by Material Type 2025 & 2033
- Figure 54: Asia TIC Market For The Metals And Minerals Industry Volume Share (%), by Material Type 2025 & 2033
- Figure 55: Asia TIC Market For The Metals And Minerals Industry Revenue (Million), by End-user Industry 2025 & 2033
- Figure 56: Asia TIC Market For The Metals And Minerals Industry Volume (Billion), by End-user Industry 2025 & 2033
- Figure 57: Asia TIC Market For The Metals And Minerals Industry Revenue Share (%), by End-user Industry 2025 & 2033
- Figure 58: Asia TIC Market For The Metals And Minerals Industry Volume Share (%), by End-user Industry 2025 & 2033
- Figure 59: Asia TIC Market For The Metals And Minerals Industry Revenue (Million), by Country 2025 & 2033
- Figure 60: Asia TIC Market For The Metals And Minerals Industry Volume (Billion), by Country 2025 & 2033
- Figure 61: Asia TIC Market For The Metals And Minerals Industry Revenue Share (%), by Country 2025 & 2033
- Figure 62: Asia TIC Market For The Metals And Minerals Industry Volume Share (%), by Country 2025 & 2033
- Figure 63: Australia and New Zealand TIC Market For The Metals And Minerals Industry Revenue (Million), by Operation Type 2025 & 2033
- Figure 64: Australia and New Zealand TIC Market For The Metals And Minerals Industry Volume (Billion), by Operation Type 2025 & 2033
- Figure 65: Australia and New Zealand TIC Market For The Metals And Minerals Industry Revenue Share (%), by Operation Type 2025 & 2033
- Figure 66: Australia and New Zealand TIC Market For The Metals And Minerals Industry Volume Share (%), by Operation Type 2025 & 2033
- Figure 67: Australia and New Zealand TIC Market For The Metals And Minerals Industry Revenue (Million), by Service Type 2025 & 2033
- Figure 68: Australia and New Zealand TIC Market For The Metals And Minerals Industry Volume (Billion), by Service Type 2025 & 2033
- Figure 69: Australia and New Zealand TIC Market For The Metals And Minerals Industry Revenue Share (%), by Service Type 2025 & 2033
- Figure 70: Australia and New Zealand TIC Market For The Metals And Minerals Industry Volume Share (%), by Service Type 2025 & 2033
- Figure 71: Australia and New Zealand TIC Market For The Metals And Minerals Industry Revenue (Million), by Material Type 2025 & 2033
- Figure 72: Australia and New Zealand TIC Market For The Metals And Minerals Industry Volume (Billion), by Material Type 2025 & 2033
- Figure 73: Australia and New Zealand TIC Market For The Metals And Minerals Industry Revenue Share (%), by Material Type 2025 & 2033
- Figure 74: Australia and New Zealand TIC Market For The Metals And Minerals Industry Volume Share (%), by Material Type 2025 & 2033
- Figure 75: Australia and New Zealand TIC Market For The Metals And Minerals Industry Revenue (Million), by End-user Industry 2025 & 2033
- Figure 76: Australia and New Zealand TIC Market For The Metals And Minerals Industry Volume (Billion), by End-user Industry 2025 & 2033
- Figure 77: Australia and New Zealand TIC Market For The Metals And Minerals Industry Revenue Share (%), by End-user Industry 2025 & 2033
- Figure 78: Australia and New Zealand TIC Market For The Metals And Minerals Industry Volume Share (%), by End-user Industry 2025 & 2033
- Figure 79: Australia and New Zealand TIC Market For The Metals And Minerals Industry Revenue (Million), by Country 2025 & 2033
- Figure 80: Australia and New Zealand TIC Market For The Metals And Minerals Industry Volume (Billion), by Country 2025 & 2033
- Figure 81: Australia and New Zealand TIC Market For The Metals And Minerals Industry Revenue Share (%), by Country 2025 & 2033
- Figure 82: Australia and New Zealand TIC Market For The Metals And Minerals Industry Volume Share (%), by Country 2025 & 2033
- Figure 83: Latin America TIC Market For The Metals And Minerals Industry Revenue (Million), by Operation Type 2025 & 2033
- Figure 84: Latin America TIC Market For The Metals And Minerals Industry Volume (Billion), by Operation Type 2025 & 2033
- Figure 85: Latin America TIC Market For The Metals And Minerals Industry Revenue Share (%), by Operation Type 2025 & 2033
- Figure 86: Latin America TIC Market For The Metals And Minerals Industry Volume Share (%), by Operation Type 2025 & 2033
- Figure 87: Latin America TIC Market For The Metals And Minerals Industry Revenue (Million), by Service Type 2025 & 2033
- Figure 88: Latin America TIC Market For The Metals And Minerals Industry Volume (Billion), by Service Type 2025 & 2033
- Figure 89: Latin America TIC Market For The Metals And Minerals Industry Revenue Share (%), by Service Type 2025 & 2033
- Figure 90: Latin America TIC Market For The Metals And Minerals Industry Volume Share (%), by Service Type 2025 & 2033
- Figure 91: Latin America TIC Market For The Metals And Minerals Industry Revenue (Million), by Material Type 2025 & 2033
- Figure 92: Latin America TIC Market For The Metals And Minerals Industry Volume (Billion), by Material Type 2025 & 2033
- Figure 93: Latin America TIC Market For The Metals And Minerals Industry Revenue Share (%), by Material Type 2025 & 2033
- Figure 94: Latin America TIC Market For The Metals And Minerals Industry Volume Share (%), by Material Type 2025 & 2033
- Figure 95: Latin America TIC Market For The Metals And Minerals Industry Revenue (Million), by End-user Industry 2025 & 2033
- Figure 96: Latin America TIC Market For The Metals And Minerals Industry Volume (Billion), by End-user Industry 2025 & 2033
- Figure 97: Latin America TIC Market For The Metals And Minerals Industry Revenue Share (%), by End-user Industry 2025 & 2033
- Figure 98: Latin America TIC Market For The Metals And Minerals Industry Volume Share (%), by End-user Industry 2025 & 2033
- Figure 99: Latin America TIC Market For The Metals And Minerals Industry Revenue (Million), by Country 2025 & 2033
- Figure 100: Latin America TIC Market For The Metals And Minerals Industry Volume (Billion), by Country 2025 & 2033
- Figure 101: Latin America TIC Market For The Metals And Minerals Industry Revenue Share (%), by Country 2025 & 2033
- Figure 102: Latin America TIC Market For The Metals And Minerals Industry Volume Share (%), by Country 2025 & 2033
- Figure 103: Middle East and Africa TIC Market For The Metals And Minerals Industry Revenue (Million), by Operation Type 2025 & 2033
- Figure 104: Middle East and Africa TIC Market For The Metals And Minerals Industry Volume (Billion), by Operation Type 2025 & 2033
- Figure 105: Middle East and Africa TIC Market For The Metals And Minerals Industry Revenue Share (%), by Operation Type 2025 & 2033
- Figure 106: Middle East and Africa TIC Market For The Metals And Minerals Industry Volume Share (%), by Operation Type 2025 & 2033
- Figure 107: Middle East and Africa TIC Market For The Metals And Minerals Industry Revenue (Million), by Service Type 2025 & 2033
- Figure 108: Middle East and Africa TIC Market For The Metals And Minerals Industry Volume (Billion), by Service Type 2025 & 2033
- Figure 109: Middle East and Africa TIC Market For The Metals And Minerals Industry Revenue Share (%), by Service Type 2025 & 2033
- Figure 110: Middle East and Africa TIC Market For The Metals And Minerals Industry Volume Share (%), by Service Type 2025 & 2033
- Figure 111: Middle East and Africa TIC Market For The Metals And Minerals Industry Revenue (Million), by Material Type 2025 & 2033
- Figure 112: Middle East and Africa TIC Market For The Metals And Minerals Industry Volume (Billion), by Material Type 2025 & 2033
- Figure 113: Middle East and Africa TIC Market For The Metals And Minerals Industry Revenue Share (%), by Material Type 2025 & 2033
- Figure 114: Middle East and Africa TIC Market For The Metals And Minerals Industry Volume Share (%), by Material Type 2025 & 2033
- Figure 115: Middle East and Africa TIC Market For The Metals And Minerals Industry Revenue (Million), by End-user Industry 2025 & 2033
- Figure 116: Middle East and Africa TIC Market For The Metals And Minerals Industry Volume (Billion), by End-user Industry 2025 & 2033
- Figure 117: Middle East and Africa TIC Market For The Metals And Minerals Industry Revenue Share (%), by End-user Industry 2025 & 2033
- Figure 118: Middle East and Africa TIC Market For The Metals And Minerals Industry Volume Share (%), by End-user Industry 2025 & 2033
- Figure 119: Middle East and Africa TIC Market For The Metals And Minerals Industry Revenue (Million), by Country 2025 & 2033
- Figure 120: Middle East and Africa TIC Market For The Metals And Minerals Industry Volume (Billion), by Country 2025 & 2033
- Figure 121: Middle East and Africa TIC Market For The Metals And Minerals Industry Revenue Share (%), by Country 2025 & 2033
- Figure 122: Middle East and Africa TIC Market For The Metals And Minerals Industry Volume Share (%), by Country 2025 & 2033
List of Tables
- Table 1: Global TIC Market For The Metals And Minerals Industry Revenue Million Forecast, by Operation Type 2020 & 2033
- Table 2: Global TIC Market For The Metals And Minerals Industry Volume Billion Forecast, by Operation Type 2020 & 2033
- Table 3: Global TIC Market For The Metals And Minerals Industry Revenue Million Forecast, by Service Type 2020 & 2033
- Table 4: Global TIC Market For The Metals And Minerals Industry Volume Billion Forecast, by Service Type 2020 & 2033
- Table 5: Global TIC Market For The Metals And Minerals Industry Revenue Million Forecast, by Material Type 2020 & 2033
- Table 6: Global TIC Market For The Metals And Minerals Industry Volume Billion Forecast, by Material Type 2020 & 2033
- Table 7: Global TIC Market For The Metals And Minerals Industry Revenue Million Forecast, by End-user Industry 2020 & 2033
- Table 8: Global TIC Market For The Metals And Minerals Industry Volume Billion Forecast, by End-user Industry 2020 & 2033
- Table 9: Global TIC Market For The Metals And Minerals Industry Revenue Million Forecast, by Region 2020 & 2033
- Table 10: Global TIC Market For The Metals And Minerals Industry Volume Billion Forecast, by Region 2020 & 2033
- Table 11: Global TIC Market For The Metals And Minerals Industry Revenue Million Forecast, by Operation Type 2020 & 2033
- Table 12: Global TIC Market For The Metals And Minerals Industry Volume Billion Forecast, by Operation Type 2020 & 2033
- Table 13: Global TIC Market For The Metals And Minerals Industry Revenue Million Forecast, by Service Type 2020 & 2033
- Table 14: Global TIC Market For The Metals And Minerals Industry Volume Billion Forecast, by Service Type 2020 & 2033
- Table 15: Global TIC Market For The Metals And Minerals Industry Revenue Million Forecast, by Material Type 2020 & 2033
- Table 16: Global TIC Market For The Metals And Minerals Industry Volume Billion Forecast, by Material Type 2020 & 2033
- Table 17: Global TIC Market For The Metals And Minerals Industry Revenue Million Forecast, by End-user Industry 2020 & 2033
- Table 18: Global TIC Market For The Metals And Minerals Industry Volume Billion Forecast, by End-user Industry 2020 & 2033
- Table 19: Global TIC Market For The Metals And Minerals Industry Revenue Million Forecast, by Country 2020 & 2033
- Table 20: Global TIC Market For The Metals And Minerals Industry Volume Billion Forecast, by Country 2020 & 2033
- Table 21: United States TIC Market For The Metals And Minerals Industry Revenue (Million) Forecast, by Application 2020 & 2033
- Table 22: United States TIC Market For The Metals And Minerals Industry Volume (Billion) Forecast, by Application 2020 & 2033
- Table 23: Canada TIC Market For The Metals And Minerals Industry Revenue (Million) Forecast, by Application 2020 & 2033
- Table 24: Canada TIC Market For The Metals And Minerals Industry Volume (Billion) Forecast, by Application 2020 & 2033
- Table 25: Global TIC Market For The Metals And Minerals Industry Revenue Million Forecast, by Operation Type 2020 & 2033
- Table 26: Global TIC Market For The Metals And Minerals Industry Volume Billion Forecast, by Operation Type 2020 & 2033
- Table 27: Global TIC Market For The Metals And Minerals Industry Revenue Million Forecast, by Service Type 2020 & 2033
- Table 28: Global TIC Market For The Metals And Minerals Industry Volume Billion Forecast, by Service Type 2020 & 2033
- Table 29: Global TIC Market For The Metals And Minerals Industry Revenue Million Forecast, by Material Type 2020 & 2033
- Table 30: Global TIC Market For The Metals And Minerals Industry Volume Billion Forecast, by Material Type 2020 & 2033
- Table 31: Global TIC Market For The Metals And Minerals Industry Revenue Million Forecast, by End-user Industry 2020 & 2033
- Table 32: Global TIC Market For The Metals And Minerals Industry Volume Billion Forecast, by End-user Industry 2020 & 2033
- Table 33: Global TIC Market For The Metals And Minerals Industry Revenue Million Forecast, by Country 2020 & 2033
- Table 34: Global TIC Market For The Metals And Minerals Industry Volume Billion Forecast, by Country 2020 & 2033
- Table 35: United Kingdom TIC Market For The Metals And Minerals Industry Revenue (Million) Forecast, by Application 2020 & 2033
- Table 36: United Kingdom TIC Market For The Metals And Minerals Industry Volume (Billion) Forecast, by Application 2020 & 2033
- Table 37: Germany TIC Market For The Metals And Minerals Industry Revenue (Million) Forecast, by Application 2020 & 2033
- Table 38: Germany TIC Market For The Metals And Minerals Industry Volume (Billion) Forecast, by Application 2020 & 2033
- Table 39: France TIC Market For The Metals And Minerals Industry Revenue (Million) Forecast, by Application 2020 & 2033
- Table 40: France TIC Market For The Metals And Minerals Industry Volume (Billion) Forecast, by Application 2020 & 2033
- Table 41: Global TIC Market For The Metals And Minerals Industry Revenue Million Forecast, by Operation Type 2020 & 2033
- Table 42: Global TIC Market For The Metals And Minerals Industry Volume Billion Forecast, by Operation Type 2020 & 2033
- Table 43: Global TIC Market For The Metals And Minerals Industry Revenue Million Forecast, by Service Type 2020 & 2033
- Table 44: Global TIC Market For The Metals And Minerals Industry Volume Billion Forecast, by Service Type 2020 & 2033
- Table 45: Global TIC Market For The Metals And Minerals Industry Revenue Million Forecast, by Material Type 2020 & 2033
- Table 46: Global TIC Market For The Metals And Minerals Industry Volume Billion Forecast, by Material Type 2020 & 2033
- Table 47: Global TIC Market For The Metals And Minerals Industry Revenue Million Forecast, by End-user Industry 2020 & 2033
- Table 48: Global TIC Market For The Metals And Minerals Industry Volume Billion Forecast, by End-user Industry 2020 & 2033
- Table 49: Global TIC Market For The Metals And Minerals Industry Revenue Million Forecast, by Country 2020 & 2033
- Table 50: Global TIC Market For The Metals And Minerals Industry Volume Billion Forecast, by Country 2020 & 2033
- Table 51: China TIC Market For The Metals And Minerals Industry Revenue (Million) Forecast, by Application 2020 & 2033
- Table 52: China TIC Market For The Metals And Minerals Industry Volume (Billion) Forecast, by Application 2020 & 2033
- Table 53: Japan TIC Market For The Metals And Minerals Industry Revenue (Million) Forecast, by Application 2020 & 2033
- Table 54: Japan TIC Market For The Metals And Minerals Industry Volume (Billion) Forecast, by Application 2020 & 2033
- Table 55: South Korea TIC Market For The Metals And Minerals Industry Revenue (Million) Forecast, by Application 2020 & 2033
- Table 56: South Korea TIC Market For The Metals And Minerals Industry Volume (Billion) Forecast, by Application 2020 & 2033
- Table 57: South East Asia TIC Market For The Metals And Minerals Industry Revenue (Million) Forecast, by Application 2020 & 2033
- Table 58: South East Asia TIC Market For The Metals And Minerals Industry Volume (Billion) Forecast, by Application 2020 & 2033
- Table 59: India TIC Market For The Metals And Minerals Industry Revenue (Million) Forecast, by Application 2020 & 2033
- Table 60: India TIC Market For The Metals And Minerals Industry Volume (Billion) Forecast, by Application 2020 & 2033
- Table 61: Global TIC Market For The Metals And Minerals Industry Revenue Million Forecast, by Operation Type 2020 & 2033
- Table 62: Global TIC Market For The Metals And Minerals Industry Volume Billion Forecast, by Operation Type 2020 & 2033
- Table 63: Global TIC Market For The Metals And Minerals Industry Revenue Million Forecast, by Service Type 2020 & 2033
- Table 64: Global TIC Market For The Metals And Minerals Industry Volume Billion Forecast, by Service Type 2020 & 2033
- Table 65: Global TIC Market For The Metals And Minerals Industry Revenue Million Forecast, by Material Type 2020 & 2033
- Table 66: Global TIC Market For The Metals And Minerals Industry Volume Billion Forecast, by Material Type 2020 & 2033
- Table 67: Global TIC Market For The Metals And Minerals Industry Revenue Million Forecast, by End-user Industry 2020 & 2033
- Table 68: Global TIC Market For The Metals And Minerals Industry Volume Billion Forecast, by End-user Industry 2020 & 2033
- Table 69: Global TIC Market For The Metals And Minerals Industry Revenue Million Forecast, by Country 2020 & 2033
- Table 70: Global TIC Market For The Metals And Minerals Industry Volume Billion Forecast, by Country 2020 & 2033
- Table 71: Global TIC Market For The Metals And Minerals Industry Revenue Million Forecast, by Operation Type 2020 & 2033
- Table 72: Global TIC Market For The Metals And Minerals Industry Volume Billion Forecast, by Operation Type 2020 & 2033
- Table 73: Global TIC Market For The Metals And Minerals Industry Revenue Million Forecast, by Service Type 2020 & 2033
- Table 74: Global TIC Market For The Metals And Minerals Industry Volume Billion Forecast, by Service Type 2020 & 2033
- Table 75: Global TIC Market For The Metals And Minerals Industry Revenue Million Forecast, by Material Type 2020 & 2033
- Table 76: Global TIC Market For The Metals And Minerals Industry Volume Billion Forecast, by Material Type 2020 & 2033
- Table 77: Global TIC Market For The Metals And Minerals Industry Revenue Million Forecast, by End-user Industry 2020 & 2033
- Table 78: Global TIC Market For The Metals And Minerals Industry Volume Billion Forecast, by End-user Industry 2020 & 2033
- Table 79: Global TIC Market For The Metals And Minerals Industry Revenue Million Forecast, by Country 2020 & 2033
- Table 80: Global TIC Market For The Metals And Minerals Industry Volume Billion Forecast, by Country 2020 & 2033
- Table 81: Global TIC Market For The Metals And Minerals Industry Revenue Million Forecast, by Operation Type 2020 & 2033
- Table 82: Global TIC Market For The Metals And Minerals Industry Volume Billion Forecast, by Operation Type 2020 & 2033
- Table 83: Global TIC Market For The Metals And Minerals Industry Revenue Million Forecast, by Service Type 2020 & 2033
- Table 84: Global TIC Market For The Metals And Minerals Industry Volume Billion Forecast, by Service Type 2020 & 2033
- Table 85: Global TIC Market For The Metals And Minerals Industry Revenue Million Forecast, by Material Type 2020 & 2033
- Table 86: Global TIC Market For The Metals And Minerals Industry Volume Billion Forecast, by Material Type 2020 & 2033
- Table 87: Global TIC Market For The Metals And Minerals Industry Revenue Million Forecast, by End-user Industry 2020 & 2033
- Table 88: Global TIC Market For The Metals And Minerals Industry Volume Billion Forecast, by End-user Industry 2020 & 2033
- Table 89: Global TIC Market For The Metals And Minerals Industry Revenue Million Forecast, by Country 2020 & 2033
- Table 90: Global TIC Market For The Metals And Minerals Industry Volume Billion Forecast, by Country 2020 & 2033
Frequently Asked Questions
1. What is the projected Compound Annual Growth Rate (CAGR) of the TIC Market For The Metals And Minerals Industry?
The projected CAGR is approximately 4.30%.
2. Which companies are prominent players in the TIC Market For The Metals And Minerals Industry?
Key companies in the market include SGS SA, Bureau Veritas SA, Intertek Group PLC, TUV SUD, DEKRA SE, ALS Limited, Applus+, Eurofins Scientific SE, DNV Group AS, Element Materials Technology Group Limited, Mistras Group Inc, Kiwa NV, UL Solutions Inc, Rina SPA, Qima, Westmoreland Mechanical Testing and Research Inc, Laboratory Testing Inc, NSL Analytical Services Inc, IMR Test Labs (Curtiss Wright Corporation), Applied Technical Services LLC*List Not Exhaustive.
3. What are the main segments of the TIC Market For The Metals And Minerals Industry?
The market segments include Operation Type, Service Type, Material Type, End-user Industry.
4. Can you provide details about the market size?
The market size is estimated to be USD 19.53 Million as of 2022.
5. What are some drivers contributing to market growth?
Rising Demand For Critical Minerals; Government Regulations and Mandates to Ensure Product Safety and Environmental Protection.
6. What are the notable trends driving market growth?
Construction Industry to be the Largest End User.
7. Are there any restraints impacting market growth?
Rising Demand For Critical Minerals; Government Regulations and Mandates to Ensure Product Safety and Environmental Protection.
8. Can you provide examples of recent developments in the market?
August 2024: Element Materials Technology has invested USD 13 million to bolster its Canadian operations. This investment will launch of two new laboratories in Toronto, Ontario. One of these is an advanced life sciences laboratory focusing on pharmaceutical testing. The upgraded facility boasts enhancements across various departments, such as metals testing and materials characterization, positioning Element to better cater to the surging demands of the pharmaceutical and biotechnology sectors.June 2024: UL Solutions Inc. announced plans to build a new facility called the Advanced Automotive and Battery Testing Center in Pyeongtaek, Gyeonggi-do, Korea. This initiative aims to enhance the existing battery testing capacity of UL Solutions in the region while also incorporating EV charger testing and various other capabilities. It is projected to commence operations in the latter part of 2025. The primary goals of this venture include bolstering Korea's EV industry, addressing the growing demand from both new and current clients, and streamlining the process of safety and performance testing as well as other related services.March 2024: Applus+ played a prominent role in the technical supervision of the project for the construction of the 220 kV Transmission Line Derivation L-2264 between the Ishcayucro and Raurapata substations. This project's scope encompassed the construction of a single-circuit 220 kV transmission line and a new GIS 220/33/22.9 kV substation in Raurapata. The line, with a length of 28.3 km, uses ACSR 591mm2 conductor and lattice steel structures.
9. What pricing options are available for accessing the report?
Pricing options include single-user, multi-user, and enterprise licenses priced at USD 4750, USD 5250, and USD 8750 respectively.
10. Is the market size provided in terms of value or volume?
The market size is provided in terms of value, measured in Million and volume, measured in Billion.
11. Are there any specific market keywords associated with the report?
Yes, the market keyword associated with the report is "TIC Market For The Metals And Minerals Industry," which aids in identifying and referencing the specific market segment covered.
12. How do I determine which pricing option suits my needs best?
The pricing options vary based on user requirements and access needs. Individual users may opt for single-user licenses, while businesses requiring broader access may choose multi-user or enterprise licenses for cost-effective access to the report.
13. Are there any additional resources or data provided in the TIC Market For The Metals And Minerals Industry report?
While the report offers comprehensive insights, it's advisable to review the specific contents or supplementary materials provided to ascertain if additional resources or data are available.
14. How can I stay updated on further developments or reports in the TIC Market For The Metals And Minerals Industry?
To stay informed about further developments, trends, and reports in the TIC Market For The Metals And Minerals Industry, consider subscribing to industry newsletters, following relevant companies and organizations, or regularly checking reputable industry news sources and publications.
Methodology
Step 1 - Identification of Relevant Samples Size from Population Database


Step 2 - Approaches for Defining Global Market Size (Value, Volume* & Price*)

Note*: In applicable scenarios
Step 3 - Data Sources
Primary Research
- Web Analytics
- Survey Reports
- Research Institute
- Latest Research Reports
- Opinion Leaders
Secondary Research
- Annual Reports
- White Paper
- Latest Press Release
- Industry Association
- Paid Database
- Investor Presentations

Step 4 - Data Triangulation
Involves using different sources of information in order to increase the validity of a study
These sources are likely to be stakeholders in a program - participants, other researchers, program staff, other community members, and so on.
Then we put all data in single framework & apply various statistical tools to find out the dynamic on the market.
During the analysis stage, feedback from the stakeholder groups would be compared to determine areas of agreement as well as areas of divergence