

Key Insights
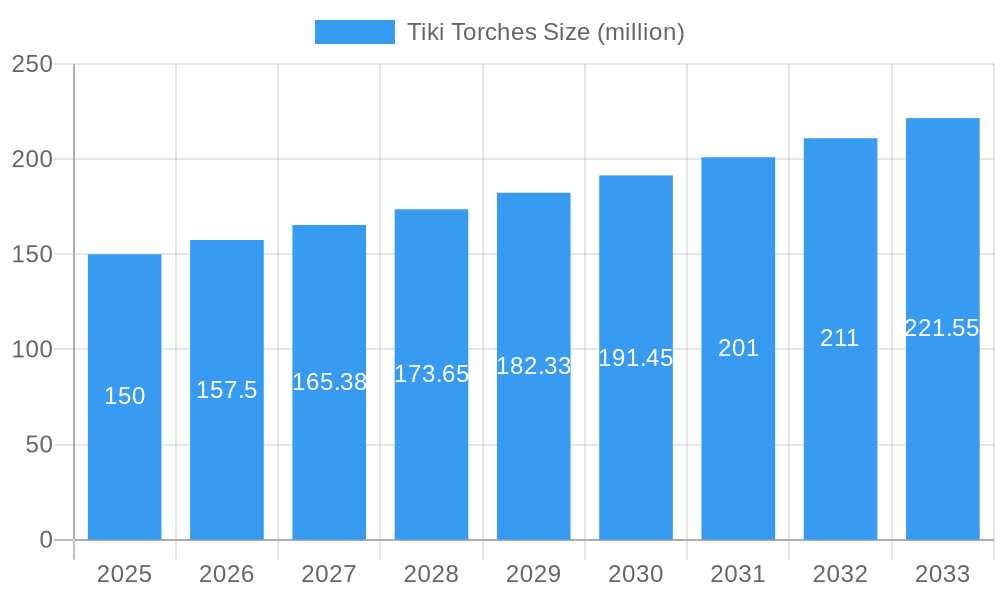
The global tiki torch market, while exhibiting a niche appeal, demonstrates consistent growth fueled by several key factors. The market's value is estimated at $150 million in 2025, projecting a Compound Annual Growth Rate (CAGR) of 5% from 2025 to 2033. This growth is driven primarily by increasing demand for outdoor lighting and ambiance solutions, particularly in residential settings and hospitality venues like resorts and restaurants. The rising popularity of backyard entertaining and the aesthetic appeal of tiki torches, evoking a sense of tropical relaxation, contribute significantly to this trend. Furthermore, the introduction of innovative designs incorporating sustainable materials and energy-efficient LED lighting is attracting environmentally conscious consumers. However, fluctuating raw material prices and the presence of substitute lighting options pose challenges to market expansion. Segment-wise, while specific data is unavailable, it's reasonable to assume a significant share is held by residential consumers, followed by the hospitality sector. Companies like Lamplight Farms Inc. and Firefly Fuels Inc. are likely major players, capitalizing on design innovation and brand recognition. Geographical distribution will vary, with regions like North America and Europe expected to hold larger market shares due to higher disposable incomes and preference for outdoor living.
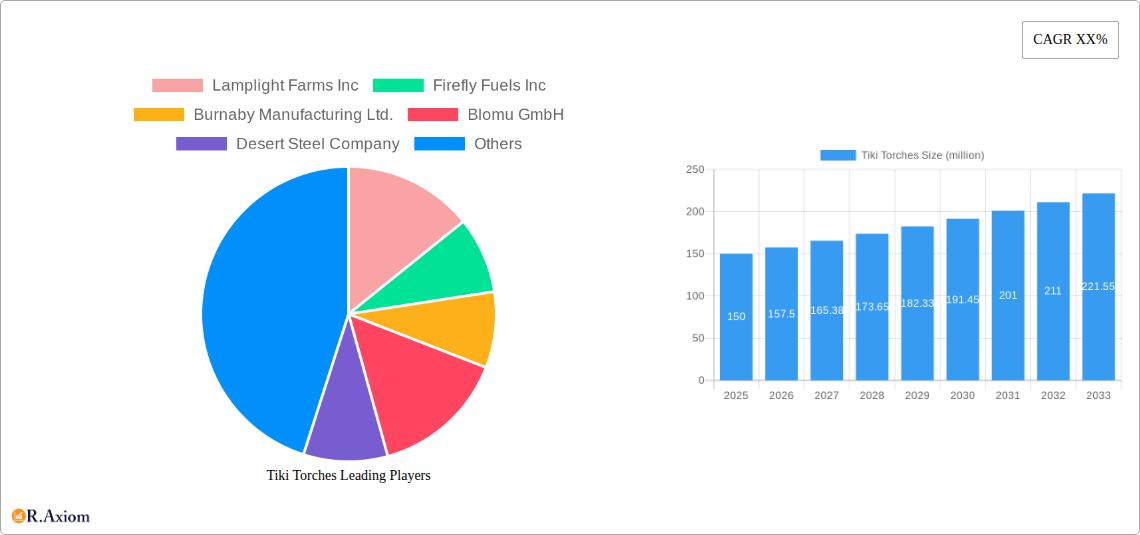
Tiki Torches Market Size (In Million)
The forecast period (2025-2033) anticipates continued market growth, although the rate might fluctuate based on economic conditions and consumer spending patterns. The historical period (2019-2024) likely showed moderate growth, influenced by pre-pandemic spending habits and the subsequent shift in consumer priorities during lockdowns. The market will likely see increased competition from more eco-friendly alternatives and companies offering premium features like automated lighting and integrated pest control. Maintaining a balance between affordability, aesthetic appeal, and sustainable practices will be key to success for companies in this market. The current market leaders will likely consolidate their position by investing in product diversification, targeted marketing, and expanding their distribution networks.
Tiki Torches Company Market Share
Tiki Torches Market: A Comprehensive Report (2019-2033)
This comprehensive report provides an in-depth analysis of the global Tiki Torches market, offering invaluable insights for industry stakeholders, investors, and businesses seeking to capitalize on emerging opportunities. The report covers the period from 2019 to 2033, with a focus on the forecast period from 2025 to 2033, using 2025 as the base year and estimated year. The total market value is projected to reach millions of dollars by 2033.
Tiki Torches Market Concentration & Innovation
This section analyzes the level of market concentration within the Tiki Torches industry, identifying key players and assessing their market share. Innovation drivers, including technological advancements and evolving consumer preferences, are examined. We assess the impact of regulatory frameworks, the presence of product substitutes, prevalent end-user trends, and mergers and acquisitions (M&A) activities on market dynamics. The report incorporates data on M&A deal values (xx million USD) and market share percentages for major players.
- Market Concentration: The market exhibits a moderately concentrated structure, with the top five players holding approximately xx% of the total market share in 2025.
- Innovation Drivers: The increasing demand for aesthetically pleasing and eco-friendly outdoor lighting solutions fuels innovation. This includes the development of sustainable fuel sources and improved torch designs.
- Regulatory Frameworks: Regulations concerning fuel safety and environmental impact significantly influence market dynamics. Compliance costs and restrictions on certain materials affect production and pricing.
- Product Substitutes: LED lighting and other outdoor lighting options pose a competitive challenge to Tiki torches.
- End-User Trends: Growing popularity of outdoor entertaining and a desire for creating relaxing ambiances drive demand for Tiki torches.
- M&A Activities: The report details significant M&A activities in the industry during the study period, analyzing their impact on market consolidation and competitive landscape.
Tiki Torches Industry Trends & Insights
This section delves into the key trends shaping the Tiki Torches market. Market growth drivers, technological disruptions, evolving consumer preferences, and competitive dynamics are thoroughly analyzed. Specific metrics, including the Compound Annual Growth Rate (CAGR) and market penetration rates, provide quantitative insights into market performance and potential. The forecast period (2025-2033) projects a CAGR of xx%, driven by factors such as increasing disposable incomes and the rise of e-commerce. Market penetration is expected to reach xx% by 2033. Specific trends such as the growing preference for solar-powered options and the increasing adoption of smart lighting features will also be discussed.
Dominant Markets & Segments in Tiki Torches
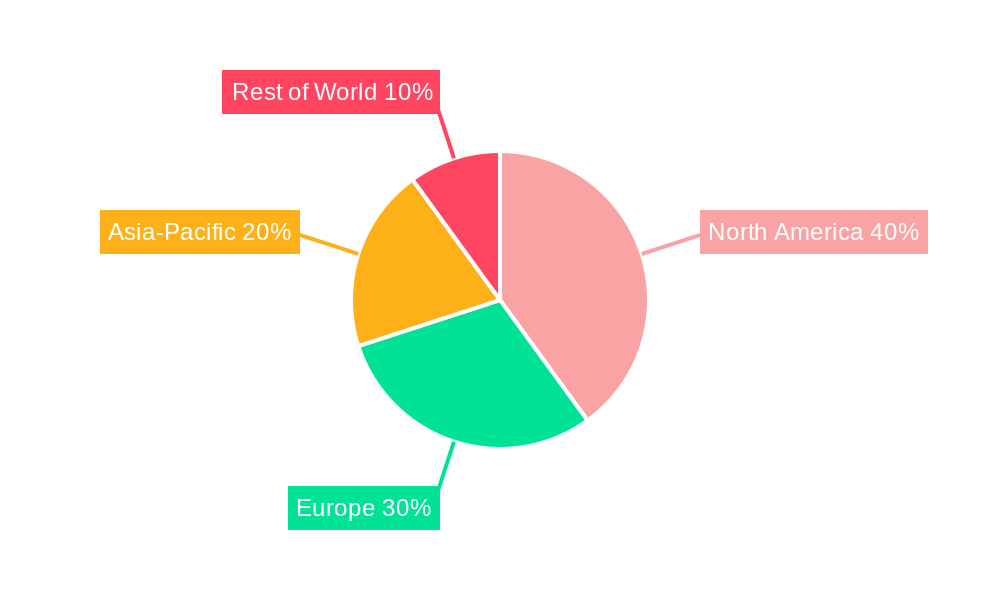
This section identifies the leading regions, countries, and segments within the Tiki Torches market. A detailed dominance analysis highlights the key factors driving market leadership in each segment. The analysis includes a discussion of economic policies, infrastructure development, and consumer behavior. The North American market holds a significant share, fueled by strong consumer demand for outdoor recreational products.
- Key Drivers of Dominance (North America):
- High disposable incomes
- Strong preference for outdoor living
- Well-developed retail infrastructure
- Favorable regulatory environment
- Detailed Dominance Analysis: The report provides a detailed analysis of market share, growth trends, and competitive intensity within the dominant regions and segments.
Tiki Torches Product Developments
This section summarizes recent product innovations, applications, and competitive advantages in the Tiki Torches market. It focuses on technological trends, such as the integration of smart technology and the development of sustainable fuel options, and their impact on market fit and competitiveness. New designs focusing on safety and ease of use are also discussed.
Report Scope & Segmentation Analysis
The report provides a detailed segmentation analysis of the Tiki Torches market. Segments are analyzed based on various factors, such as product type (e.g., size, fuel type), distribution channel (e.g., online, offline), and end-user (e.g., residential, commercial). Each segment’s growth projections, market size, and competitive dynamics are presented. For example, the residential segment is expected to witness a significant growth rate, due to rising demand for aesthetic home decor and outdoor living.
Key Drivers of Tiki Torches Growth
This section outlines the key factors driving growth in the Tiki Torches market. It focuses on technological advancements (e.g., development of long-lasting fuel sources, smart features), economic factors (e.g., rising disposable incomes, increased tourism), and favorable regulatory environments.
Challenges in the Tiki Torches Sector
This section discusses the challenges and restraints affecting the Tiki Torches market. This includes regulatory hurdles (e.g., fuel safety regulations), supply chain disruptions, and intense competition from substitute products. The report quantifies the impact of these challenges on market growth. Increased fuel costs and supply chain bottlenecks resulting from recent global events are also analyzed.
Emerging Opportunities in Tiki Torches
This section highlights emerging trends and opportunities in the Tiki Torches market, including the growing demand for eco-friendly options, smart lighting integration, and expansion into new geographic markets. The potential for premiumization of products and the growing demand in emerging markets are also discussed.
Leading Players in the Tiki Torches Market
- Lamplight Farms Inc
- Firefly Fuels Inc
- Burnaby Manufacturing Ltd.
- Blomu GmbH
- Desert Steel Company
- H Potter Company
- Mayo Hardware Pty Ltd
- Bobe Water and Fire LLC
- FOCUS Industries Incorporated
- Worthington Industries Inc.
Key Developments in Tiki Torches Industry
- 2022 Q3: Lamplight Farms Inc. launched a new line of solar-powered Tiki torches.
- 2023 Q1: Firefly Fuels Inc. introduced a biofuel blend for Tiki torches, reducing environmental impact.
- 2024 Q2: A significant merger occurred between two smaller Tiki torch manufacturers. (Further details are available within the full report).
Strategic Outlook for Tiki Torches Market
The Tiki Torches market is poised for sustained growth in the coming years, driven by several factors. Increasing consumer spending on home improvement and outdoor entertainment, combined with the development of innovative and sustainable products, will continue to fuel market expansion. Opportunities exist for companies to capitalize on emerging trends by focusing on product diversification, eco-friendly materials, and smart technology integration. The market is projected to reach millions of USD in revenue by 2033, presenting significant opportunities for market participants.
Tiki Torches Segmentation
-
1. Application
- 1.1. Online Sales
- 1.2. Offliine Sales
-
2. Types
- 2.1. Gas/Oil Tiki Torches
- 2.2. Electric Tiki Torches
- 2.3. Solar Powered Tiki Torches
- 2.4. Others
Tiki Torches Segmentation By Geography
-
1. North America
- 1.1. United States
- 1.2. Canada
- 1.3. Mexico
-
2. South America
- 2.1. Brazil
- 2.2. Argentina
- 2.3. Rest of South America
-
3. Europe
- 3.1. United Kingdom
- 3.2. Germany
- 3.3. France
- 3.4. Italy
- 3.5. Spain
- 3.6. Russia
- 3.7. Benelux
- 3.8. Nordics
- 3.9. Rest of Europe
-
4. Middle East & Africa
- 4.1. Turkey
- 4.2. Israel
- 4.3. GCC
- 4.4. North Africa
- 4.5. South Africa
- 4.6. Rest of Middle East & Africa
-
5. Asia Pacific
- 5.1. China
- 5.2. India
- 5.3. Japan
- 5.4. South Korea
- 5.5. ASEAN
- 5.6. Oceania
- 5.7. Rest of Asia Pacific
Tiki Torches Regional Market Share
Geographic Coverage of Tiki Torches
Tiki Torches REPORT HIGHLIGHTS
| Aspects | Details |
|---|---|
| Study Period | 2020-2034 |
| Base Year | 2025 |
| Estimated Year | 2026 |
| Forecast Period | 2026-2034 |
| Historical Period | 2020-2025 |
| Growth Rate | CAGR of XX% from 2020-2034 |
| Segmentation |
|
Table of Contents
- 1. Introduction
- 1.1. Research Scope
- 1.2. Market Segmentation
- 1.3. Research Methodology
- 1.4. Definitions and Assumptions
- 2. Executive Summary
- 2.1. Introduction
- 3. Market Dynamics
- 3.1. Introduction
- 3.2. Market Drivers
- 3.3. Market Restrains
- 3.4. Market Trends
- 4. Market Factor Analysis
- 4.1. Porters Five Forces
- 4.2. Supply/Value Chain
- 4.3. PESTEL analysis
- 4.4. Market Entropy
- 4.5. Patent/Trademark Analysis
- 5. Global Tiki Torches Analysis, Insights and Forecast, 2020-2032
- 5.1. Market Analysis, Insights and Forecast - by Application
- 5.1.1. Online Sales
- 5.1.2. Offliine Sales
- 5.2. Market Analysis, Insights and Forecast - by Types
- 5.2.1. Gas/Oil Tiki Torches
- 5.2.2. Electric Tiki Torches
- 5.2.3. Solar Powered Tiki Torches
- 5.2.4. Others
- 5.3. Market Analysis, Insights and Forecast - by Region
- 5.3.1. North America
- 5.3.2. South America
- 5.3.3. Europe
- 5.3.4. Middle East & Africa
- 5.3.5. Asia Pacific
- 5.1. Market Analysis, Insights and Forecast - by Application
- 6. North America Tiki Torches Analysis, Insights and Forecast, 2020-2032
- 6.1. Market Analysis, Insights and Forecast - by Application
- 6.1.1. Online Sales
- 6.1.2. Offliine Sales
- 6.2. Market Analysis, Insights and Forecast - by Types
- 6.2.1. Gas/Oil Tiki Torches
- 6.2.2. Electric Tiki Torches
- 6.2.3. Solar Powered Tiki Torches
- 6.2.4. Others
- 6.1. Market Analysis, Insights and Forecast - by Application
- 7. South America Tiki Torches Analysis, Insights and Forecast, 2020-2032
- 7.1. Market Analysis, Insights and Forecast - by Application
- 7.1.1. Online Sales
- 7.1.2. Offliine Sales
- 7.2. Market Analysis, Insights and Forecast - by Types
- 7.2.1. Gas/Oil Tiki Torches
- 7.2.2. Electric Tiki Torches
- 7.2.3. Solar Powered Tiki Torches
- 7.2.4. Others
- 7.1. Market Analysis, Insights and Forecast - by Application
- 8. Europe Tiki Torches Analysis, Insights and Forecast, 2020-2032
- 8.1. Market Analysis, Insights and Forecast - by Application
- 8.1.1. Online Sales
- 8.1.2. Offliine Sales
- 8.2. Market Analysis, Insights and Forecast - by Types
- 8.2.1. Gas/Oil Tiki Torches
- 8.2.2. Electric Tiki Torches
- 8.2.3. Solar Powered Tiki Torches
- 8.2.4. Others
- 8.1. Market Analysis, Insights and Forecast - by Application
- 9. Middle East & Africa Tiki Torches Analysis, Insights and Forecast, 2020-2032
- 9.1. Market Analysis, Insights and Forecast - by Application
- 9.1.1. Online Sales
- 9.1.2. Offliine Sales
- 9.2. Market Analysis, Insights and Forecast - by Types
- 9.2.1. Gas/Oil Tiki Torches
- 9.2.2. Electric Tiki Torches
- 9.2.3. Solar Powered Tiki Torches
- 9.2.4. Others
- 9.1. Market Analysis, Insights and Forecast - by Application
- 10. Asia Pacific Tiki Torches Analysis, Insights and Forecast, 2020-2032
- 10.1. Market Analysis, Insights and Forecast - by Application
- 10.1.1. Online Sales
- 10.1.2. Offliine Sales
- 10.2. Market Analysis, Insights and Forecast - by Types
- 10.2.1. Gas/Oil Tiki Torches
- 10.2.2. Electric Tiki Torches
- 10.2.3. Solar Powered Tiki Torches
- 10.2.4. Others
- 10.1. Market Analysis, Insights and Forecast - by Application
- 11. Competitive Analysis
- 11.1. Global Market Share Analysis 2025
- 11.2. Company Profiles
- 11.2.1 Lamplight Farms Inc
- 11.2.1.1. Overview
- 11.2.1.2. Products
- 11.2.1.3. SWOT Analysis
- 11.2.1.4. Recent Developments
- 11.2.1.5. Financials (Based on Availability)
- 11.2.2 Firefly Fuels Inc
- 11.2.2.1. Overview
- 11.2.2.2. Products
- 11.2.2.3. SWOT Analysis
- 11.2.2.4. Recent Developments
- 11.2.2.5. Financials (Based on Availability)
- 11.2.3 Burnaby Manufacturing Ltd.
- 11.2.3.1. Overview
- 11.2.3.2. Products
- 11.2.3.3. SWOT Analysis
- 11.2.3.4. Recent Developments
- 11.2.3.5. Financials (Based on Availability)
- 11.2.4 Blomu GmbH
- 11.2.4.1. Overview
- 11.2.4.2. Products
- 11.2.4.3. SWOT Analysis
- 11.2.4.4. Recent Developments
- 11.2.4.5. Financials (Based on Availability)
- 11.2.5 Desert Steel Company
- 11.2.5.1. Overview
- 11.2.5.2. Products
- 11.2.5.3. SWOT Analysis
- 11.2.5.4. Recent Developments
- 11.2.5.5. Financials (Based on Availability)
- 11.2.6 H Potter Company
- 11.2.6.1. Overview
- 11.2.6.2. Products
- 11.2.6.3. SWOT Analysis
- 11.2.6.4. Recent Developments
- 11.2.6.5. Financials (Based on Availability)
- 11.2.7 Mayo Hardware Pty Ltd
- 11.2.7.1. Overview
- 11.2.7.2. Products
- 11.2.7.3. SWOT Analysis
- 11.2.7.4. Recent Developments
- 11.2.7.5. Financials (Based on Availability)
- 11.2.8 Bobe Water and Fire LLC
- 11.2.8.1. Overview
- 11.2.8.2. Products
- 11.2.8.3. SWOT Analysis
- 11.2.8.4. Recent Developments
- 11.2.8.5. Financials (Based on Availability)
- 11.2.9 FOCUS Industries Incorporated
- 11.2.9.1. Overview
- 11.2.9.2. Products
- 11.2.9.3. SWOT Analysis
- 11.2.9.4. Recent Developments
- 11.2.9.5. Financials (Based on Availability)
- 11.2.10 Worthington Industries Inc.
- 11.2.10.1. Overview
- 11.2.10.2. Products
- 11.2.10.3. SWOT Analysis
- 11.2.10.4. Recent Developments
- 11.2.10.5. Financials (Based on Availability)
- 11.2.1 Lamplight Farms Inc
List of Figures
- Figure 1: Global Tiki Torches Revenue Breakdown (million, %) by Region 2025 & 2033
- Figure 2: Global Tiki Torches Volume Breakdown (K, %) by Region 2025 & 2033
- Figure 3: North America Tiki Torches Revenue (million), by Application 2025 & 2033
- Figure 4: North America Tiki Torches Volume (K), by Application 2025 & 2033
- Figure 5: North America Tiki Torches Revenue Share (%), by Application 2025 & 2033
- Figure 6: North America Tiki Torches Volume Share (%), by Application 2025 & 2033
- Figure 7: North America Tiki Torches Revenue (million), by Types 2025 & 2033
- Figure 8: North America Tiki Torches Volume (K), by Types 2025 & 2033
- Figure 9: North America Tiki Torches Revenue Share (%), by Types 2025 & 2033
- Figure 10: North America Tiki Torches Volume Share (%), by Types 2025 & 2033
- Figure 11: North America Tiki Torches Revenue (million), by Country 2025 & 2033
- Figure 12: North America Tiki Torches Volume (K), by Country 2025 & 2033
- Figure 13: North America Tiki Torches Revenue Share (%), by Country 2025 & 2033
- Figure 14: North America Tiki Torches Volume Share (%), by Country 2025 & 2033
- Figure 15: South America Tiki Torches Revenue (million), by Application 2025 & 2033
- Figure 16: South America Tiki Torches Volume (K), by Application 2025 & 2033
- Figure 17: South America Tiki Torches Revenue Share (%), by Application 2025 & 2033
- Figure 18: South America Tiki Torches Volume Share (%), by Application 2025 & 2033
- Figure 19: South America Tiki Torches Revenue (million), by Types 2025 & 2033
- Figure 20: South America Tiki Torches Volume (K), by Types 2025 & 2033
- Figure 21: South America Tiki Torches Revenue Share (%), by Types 2025 & 2033
- Figure 22: South America Tiki Torches Volume Share (%), by Types 2025 & 2033
- Figure 23: South America Tiki Torches Revenue (million), by Country 2025 & 2033
- Figure 24: South America Tiki Torches Volume (K), by Country 2025 & 2033
- Figure 25: South America Tiki Torches Revenue Share (%), by Country 2025 & 2033
- Figure 26: South America Tiki Torches Volume Share (%), by Country 2025 & 2033
- Figure 27: Europe Tiki Torches Revenue (million), by Application 2025 & 2033
- Figure 28: Europe Tiki Torches Volume (K), by Application 2025 & 2033
- Figure 29: Europe Tiki Torches Revenue Share (%), by Application 2025 & 2033
- Figure 30: Europe Tiki Torches Volume Share (%), by Application 2025 & 2033
- Figure 31: Europe Tiki Torches Revenue (million), by Types 2025 & 2033
- Figure 32: Europe Tiki Torches Volume (K), by Types 2025 & 2033
- Figure 33: Europe Tiki Torches Revenue Share (%), by Types 2025 & 2033
- Figure 34: Europe Tiki Torches Volume Share (%), by Types 2025 & 2033
- Figure 35: Europe Tiki Torches Revenue (million), by Country 2025 & 2033
- Figure 36: Europe Tiki Torches Volume (K), by Country 2025 & 2033
- Figure 37: Europe Tiki Torches Revenue Share (%), by Country 2025 & 2033
- Figure 38: Europe Tiki Torches Volume Share (%), by Country 2025 & 2033
- Figure 39: Middle East & Africa Tiki Torches Revenue (million), by Application 2025 & 2033
- Figure 40: Middle East & Africa Tiki Torches Volume (K), by Application 2025 & 2033
- Figure 41: Middle East & Africa Tiki Torches Revenue Share (%), by Application 2025 & 2033
- Figure 42: Middle East & Africa Tiki Torches Volume Share (%), by Application 2025 & 2033
- Figure 43: Middle East & Africa Tiki Torches Revenue (million), by Types 2025 & 2033
- Figure 44: Middle East & Africa Tiki Torches Volume (K), by Types 2025 & 2033
- Figure 45: Middle East & Africa Tiki Torches Revenue Share (%), by Types 2025 & 2033
- Figure 46: Middle East & Africa Tiki Torches Volume Share (%), by Types 2025 & 2033
- Figure 47: Middle East & Africa Tiki Torches Revenue (million), by Country 2025 & 2033
- Figure 48: Middle East & Africa Tiki Torches Volume (K), by Country 2025 & 2033
- Figure 49: Middle East & Africa Tiki Torches Revenue Share (%), by Country 2025 & 2033
- Figure 50: Middle East & Africa Tiki Torches Volume Share (%), by Country 2025 & 2033
- Figure 51: Asia Pacific Tiki Torches Revenue (million), by Application 2025 & 2033
- Figure 52: Asia Pacific Tiki Torches Volume (K), by Application 2025 & 2033
- Figure 53: Asia Pacific Tiki Torches Revenue Share (%), by Application 2025 & 2033
- Figure 54: Asia Pacific Tiki Torches Volume Share (%), by Application 2025 & 2033
- Figure 55: Asia Pacific Tiki Torches Revenue (million), by Types 2025 & 2033
- Figure 56: Asia Pacific Tiki Torches Volume (K), by Types 2025 & 2033
- Figure 57: Asia Pacific Tiki Torches Revenue Share (%), by Types 2025 & 2033
- Figure 58: Asia Pacific Tiki Torches Volume Share (%), by Types 2025 & 2033
- Figure 59: Asia Pacific Tiki Torches Revenue (million), by Country 2025 & 2033
- Figure 60: Asia Pacific Tiki Torches Volume (K), by Country 2025 & 2033
- Figure 61: Asia Pacific Tiki Torches Revenue Share (%), by Country 2025 & 2033
- Figure 62: Asia Pacific Tiki Torches Volume Share (%), by Country 2025 & 2033
List of Tables
- Table 1: Global Tiki Torches Revenue million Forecast, by Application 2020 & 2033
- Table 2: Global Tiki Torches Volume K Forecast, by Application 2020 & 2033
- Table 3: Global Tiki Torches Revenue million Forecast, by Types 2020 & 2033
- Table 4: Global Tiki Torches Volume K Forecast, by Types 2020 & 2033
- Table 5: Global Tiki Torches Revenue million Forecast, by Region 2020 & 2033
- Table 6: Global Tiki Torches Volume K Forecast, by Region 2020 & 2033
- Table 7: Global Tiki Torches Revenue million Forecast, by Application 2020 & 2033
- Table 8: Global Tiki Torches Volume K Forecast, by Application 2020 & 2033
- Table 9: Global Tiki Torches Revenue million Forecast, by Types 2020 & 2033
- Table 10: Global Tiki Torches Volume K Forecast, by Types 2020 & 2033
- Table 11: Global Tiki Torches Revenue million Forecast, by Country 2020 & 2033
- Table 12: Global Tiki Torches Volume K Forecast, by Country 2020 & 2033
- Table 13: United States Tiki Torches Revenue (million) Forecast, by Application 2020 & 2033
- Table 14: United States Tiki Torches Volume (K) Forecast, by Application 2020 & 2033
- Table 15: Canada Tiki Torches Revenue (million) Forecast, by Application 2020 & 2033
- Table 16: Canada Tiki Torches Volume (K) Forecast, by Application 2020 & 2033
- Table 17: Mexico Tiki Torches Revenue (million) Forecast, by Application 2020 & 2033
- Table 18: Mexico Tiki Torches Volume (K) Forecast, by Application 2020 & 2033
- Table 19: Global Tiki Torches Revenue million Forecast, by Application 2020 & 2033
- Table 20: Global Tiki Torches Volume K Forecast, by Application 2020 & 2033
- Table 21: Global Tiki Torches Revenue million Forecast, by Types 2020 & 2033
- Table 22: Global Tiki Torches Volume K Forecast, by Types 2020 & 2033
- Table 23: Global Tiki Torches Revenue million Forecast, by Country 2020 & 2033
- Table 24: Global Tiki Torches Volume K Forecast, by Country 2020 & 2033
- Table 25: Brazil Tiki Torches Revenue (million) Forecast, by Application 2020 & 2033
- Table 26: Brazil Tiki Torches Volume (K) Forecast, by Application 2020 & 2033
- Table 27: Argentina Tiki Torches Revenue (million) Forecast, by Application 2020 & 2033
- Table 28: Argentina Tiki Torches Volume (K) Forecast, by Application 2020 & 2033
- Table 29: Rest of South America Tiki Torches Revenue (million) Forecast, by Application 2020 & 2033
- Table 30: Rest of South America Tiki Torches Volume (K) Forecast, by Application 2020 & 2033
- Table 31: Global Tiki Torches Revenue million Forecast, by Application 2020 & 2033
- Table 32: Global Tiki Torches Volume K Forecast, by Application 2020 & 2033
- Table 33: Global Tiki Torches Revenue million Forecast, by Types 2020 & 2033
- Table 34: Global Tiki Torches Volume K Forecast, by Types 2020 & 2033
- Table 35: Global Tiki Torches Revenue million Forecast, by Country 2020 & 2033
- Table 36: Global Tiki Torches Volume K Forecast, by Country 2020 & 2033
- Table 37: United Kingdom Tiki Torches Revenue (million) Forecast, by Application 2020 & 2033
- Table 38: United Kingdom Tiki Torches Volume (K) Forecast, by Application 2020 & 2033
- Table 39: Germany Tiki Torches Revenue (million) Forecast, by Application 2020 & 2033
- Table 40: Germany Tiki Torches Volume (K) Forecast, by Application 2020 & 2033
- Table 41: France Tiki Torches Revenue (million) Forecast, by Application 2020 & 2033
- Table 42: France Tiki Torches Volume (K) Forecast, by Application 2020 & 2033
- Table 43: Italy Tiki Torches Revenue (million) Forecast, by Application 2020 & 2033
- Table 44: Italy Tiki Torches Volume (K) Forecast, by Application 2020 & 2033
- Table 45: Spain Tiki Torches Revenue (million) Forecast, by Application 2020 & 2033
- Table 46: Spain Tiki Torches Volume (K) Forecast, by Application 2020 & 2033
- Table 47: Russia Tiki Torches Revenue (million) Forecast, by Application 2020 & 2033
- Table 48: Russia Tiki Torches Volume (K) Forecast, by Application 2020 & 2033
- Table 49: Benelux Tiki Torches Revenue (million) Forecast, by Application 2020 & 2033
- Table 50: Benelux Tiki Torches Volume (K) Forecast, by Application 2020 & 2033
- Table 51: Nordics Tiki Torches Revenue (million) Forecast, by Application 2020 & 2033
- Table 52: Nordics Tiki Torches Volume (K) Forecast, by Application 2020 & 2033
- Table 53: Rest of Europe Tiki Torches Revenue (million) Forecast, by Application 2020 & 2033
- Table 54: Rest of Europe Tiki Torches Volume (K) Forecast, by Application 2020 & 2033
- Table 55: Global Tiki Torches Revenue million Forecast, by Application 2020 & 2033
- Table 56: Global Tiki Torches Volume K Forecast, by Application 2020 & 2033
- Table 57: Global Tiki Torches Revenue million Forecast, by Types 2020 & 2033
- Table 58: Global Tiki Torches Volume K Forecast, by Types 2020 & 2033
- Table 59: Global Tiki Torches Revenue million Forecast, by Country 2020 & 2033
- Table 60: Global Tiki Torches Volume K Forecast, by Country 2020 & 2033
- Table 61: Turkey Tiki Torches Revenue (million) Forecast, by Application 2020 & 2033
- Table 62: Turkey Tiki Torches Volume (K) Forecast, by Application 2020 & 2033
- Table 63: Israel Tiki Torches Revenue (million) Forecast, by Application 2020 & 2033
- Table 64: Israel Tiki Torches Volume (K) Forecast, by Application 2020 & 2033
- Table 65: GCC Tiki Torches Revenue (million) Forecast, by Application 2020 & 2033
- Table 66: GCC Tiki Torches Volume (K) Forecast, by Application 2020 & 2033
- Table 67: North Africa Tiki Torches Revenue (million) Forecast, by Application 2020 & 2033
- Table 68: North Africa Tiki Torches Volume (K) Forecast, by Application 2020 & 2033
- Table 69: South Africa Tiki Torches Revenue (million) Forecast, by Application 2020 & 2033
- Table 70: South Africa Tiki Torches Volume (K) Forecast, by Application 2020 & 2033
- Table 71: Rest of Middle East & Africa Tiki Torches Revenue (million) Forecast, by Application 2020 & 2033
- Table 72: Rest of Middle East & Africa Tiki Torches Volume (K) Forecast, by Application 2020 & 2033
- Table 73: Global Tiki Torches Revenue million Forecast, by Application 2020 & 2033
- Table 74: Global Tiki Torches Volume K Forecast, by Application 2020 & 2033
- Table 75: Global Tiki Torches Revenue million Forecast, by Types 2020 & 2033
- Table 76: Global Tiki Torches Volume K Forecast, by Types 2020 & 2033
- Table 77: Global Tiki Torches Revenue million Forecast, by Country 2020 & 2033
- Table 78: Global Tiki Torches Volume K Forecast, by Country 2020 & 2033
- Table 79: China Tiki Torches Revenue (million) Forecast, by Application 2020 & 2033
- Table 80: China Tiki Torches Volume (K) Forecast, by Application 2020 & 2033
- Table 81: India Tiki Torches Revenue (million) Forecast, by Application 2020 & 2033
- Table 82: India Tiki Torches Volume (K) Forecast, by Application 2020 & 2033
- Table 83: Japan Tiki Torches Revenue (million) Forecast, by Application 2020 & 2033
- Table 84: Japan Tiki Torches Volume (K) Forecast, by Application 2020 & 2033
- Table 85: South Korea Tiki Torches Revenue (million) Forecast, by Application 2020 & 2033
- Table 86: South Korea Tiki Torches Volume (K) Forecast, by Application 2020 & 2033
- Table 87: ASEAN Tiki Torches Revenue (million) Forecast, by Application 2020 & 2033
- Table 88: ASEAN Tiki Torches Volume (K) Forecast, by Application 2020 & 2033
- Table 89: Oceania Tiki Torches Revenue (million) Forecast, by Application 2020 & 2033
- Table 90: Oceania Tiki Torches Volume (K) Forecast, by Application 2020 & 2033
- Table 91: Rest of Asia Pacific Tiki Torches Revenue (million) Forecast, by Application 2020 & 2033
- Table 92: Rest of Asia Pacific Tiki Torches Volume (K) Forecast, by Application 2020 & 2033
Frequently Asked Questions
1. What is the projected Compound Annual Growth Rate (CAGR) of the Tiki Torches?
The projected CAGR is approximately XX%.
2. Which companies are prominent players in the Tiki Torches?
Key companies in the market include Lamplight Farms Inc, Firefly Fuels Inc, Burnaby Manufacturing Ltd., Blomu GmbH, Desert Steel Company, H Potter Company, Mayo Hardware Pty Ltd, Bobe Water and Fire LLC, FOCUS Industries Incorporated, Worthington Industries Inc..
3. What are the main segments of the Tiki Torches?
The market segments include Application, Types.
4. Can you provide details about the market size?
The market size is estimated to be USD XXX million as of 2022.
5. What are some drivers contributing to market growth?
N/A
6. What are the notable trends driving market growth?
N/A
7. Are there any restraints impacting market growth?
N/A
8. Can you provide examples of recent developments in the market?
N/A
9. What pricing options are available for accessing the report?
Pricing options include single-user, multi-user, and enterprise licenses priced at USD 3350.00, USD 5025.00, and USD 6700.00 respectively.
10. Is the market size provided in terms of value or volume?
The market size is provided in terms of value, measured in million and volume, measured in K.
11. Are there any specific market keywords associated with the report?
Yes, the market keyword associated with the report is "Tiki Torches," which aids in identifying and referencing the specific market segment covered.
12. How do I determine which pricing option suits my needs best?
The pricing options vary based on user requirements and access needs. Individual users may opt for single-user licenses, while businesses requiring broader access may choose multi-user or enterprise licenses for cost-effective access to the report.
13. Are there any additional resources or data provided in the Tiki Torches report?
While the report offers comprehensive insights, it's advisable to review the specific contents or supplementary materials provided to ascertain if additional resources or data are available.
14. How can I stay updated on further developments or reports in the Tiki Torches?
To stay informed about further developments, trends, and reports in the Tiki Torches, consider subscribing to industry newsletters, following relevant companies and organizations, or regularly checking reputable industry news sources and publications.
Methodology
Step 1 - Identification of Relevant Samples Size from Population Database


Step 2 - Approaches for Defining Global Market Size (Value, Volume* & Price*)

Note*: In applicable scenarios
Step 3 - Data Sources
Primary Research
- Web Analytics
- Survey Reports
- Research Institute
- Latest Research Reports
- Opinion Leaders
Secondary Research
- Annual Reports
- White Paper
- Latest Press Release
- Industry Association
- Paid Database
- Investor Presentations

Step 4 - Data Triangulation
Involves using different sources of information in order to increase the validity of a study
These sources are likely to be stakeholders in a program - participants, other researchers, program staff, other community members, and so on.
Then we put all data in single framework & apply various statistical tools to find out the dynamic on the market.
During the analysis stage, feedback from the stakeholder groups would be compared to determine areas of agreement as well as areas of divergence