

Key Insights
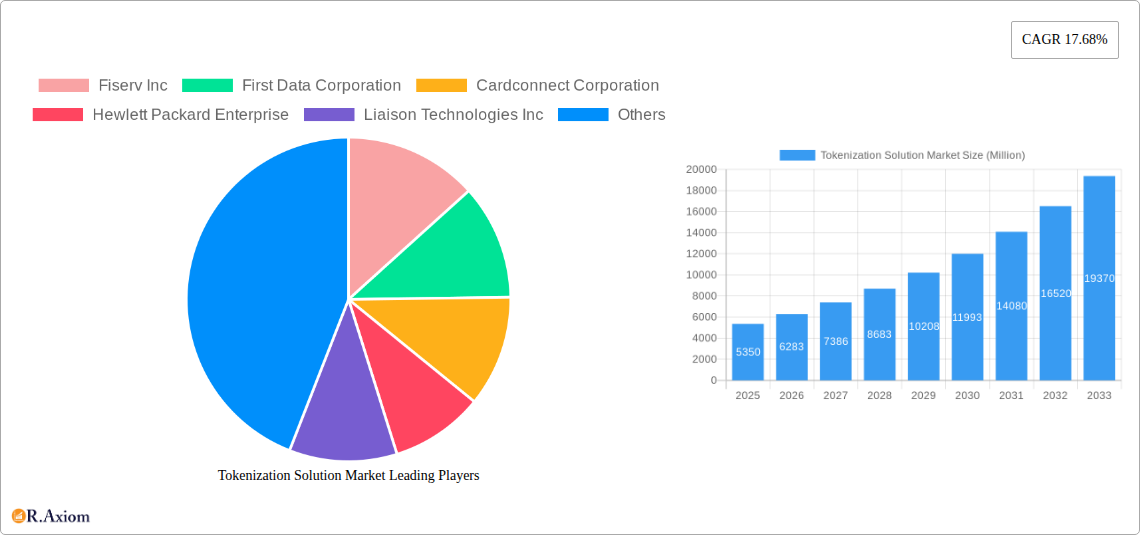
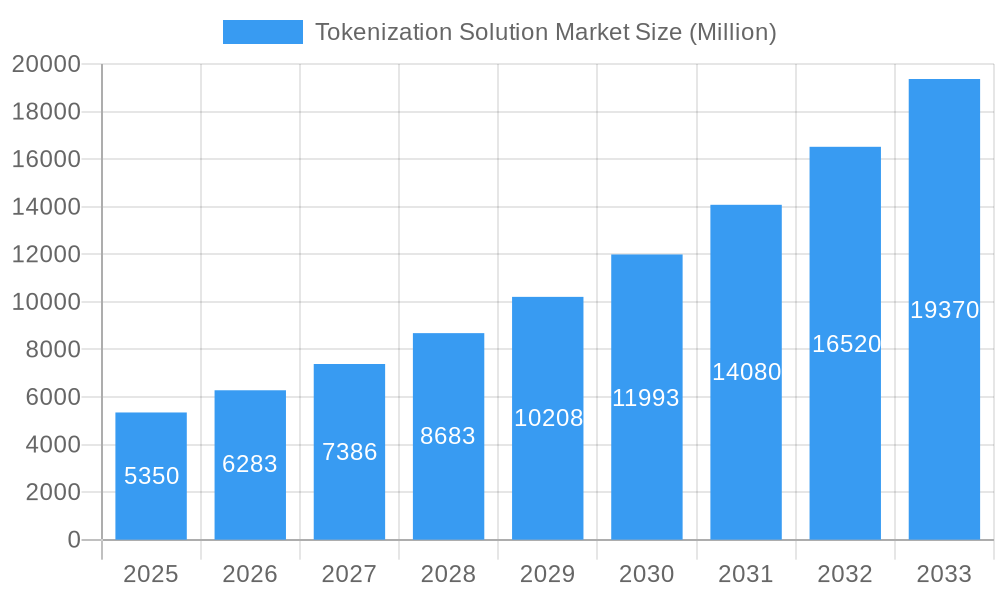
The global tokenization solution market, valued at $5.35 billion in 2025, is projected to experience robust growth, driven by the increasing adoption of cloud-based solutions and the rising need for enhanced data security across diverse industries. The Compound Annual Growth Rate (CAGR) of 17.68% from 2025 to 2033 indicates significant market expansion. Key drivers include the growing concerns over data breaches and regulatory compliance mandates like GDPR and CCPA, fueling demand for secure data handling methods. The rising adoption of digital payment systems and the expanding e-commerce sector further contribute to market growth. Market segmentation reveals that cloud-based deployments are gaining traction due to their scalability and cost-effectiveness, while the BFSI (Banking, Financial Services, and Insurance) sector represents a major end-user industry segment. Competition is intense, with established players like Fiserv, First Data, and Thales alongside emerging technology companies vying for market share. Geographical analysis shows North America currently holds a dominant position, but the Asia-Pacific region is expected to exhibit faster growth due to the increasing digitalization initiatives across countries like India and China. The continuous development of advanced tokenization technologies and their integration with other cybersecurity solutions will likely shape future market trends. The market is expected to surpass $20 billion by 2033.
Tokenization Solution Market Market Size (In Billion)
The market's growth trajectory is further influenced by several factors. Challenges such as the complexity of implementing tokenization solutions and the need for skilled professionals to manage these systems act as restraints. However, the ongoing advancements in artificial intelligence (AI) and machine learning (ML) technologies are expected to improve the efficiency and effectiveness of tokenization, overcoming some of these challenges. The increasing adoption of Internet of Things (IoT) devices and the rise of big data analytics will also contribute to increased demand for robust data security solutions like tokenization. Furthermore, the rising awareness among businesses about the importance of data protection and privacy is expected to drive the adoption of tokenization solutions across various sectors. The strategic partnerships and mergers and acquisitions within the market will continue to shape its competitive landscape.
Tokenization Solution Market Company Market Share
This in-depth report provides a comprehensive analysis of the Tokenization Solution Market, covering market size, growth projections, key segments, leading players, and emerging trends from 2019 to 2033. The study period spans 2019-2033, with 2025 as the base and estimated year. The forecast period is 2025-2033, and the historical period is 2019-2024. This report is invaluable for industry stakeholders, investors, and businesses seeking to understand and capitalize on the opportunities within this rapidly evolving market.
Tokenization Solution Market Concentration & Innovation
The Tokenization Solution Market exhibits a moderately concentrated landscape, with several major players holding significant market share. While precise market share figures for individual companies remain proprietary, key players like Fiserv Inc, First Data Corporation, and others contribute significantly to the overall market value. The market is characterized by ongoing innovation, driven by advancements in blockchain technology, increasing regulatory clarity in certain jurisdictions, and the growing demand for secure and efficient data management solutions across various industries. The emergence of new solutions, like those utilizing the Ethereum blockchain for carbon footprint tracking (as evidenced by EY's OpsChain ESG), fuels this innovation.
Mergers and acquisitions (M&A) activity plays a crucial role in shaping market dynamics. While precise M&A deal values are unavailable publicly for all transactions, we estimate that M&A activity in this sector exceeded xx Million in the past five years, driving consolidation and the introduction of new capabilities within established players.
- Key Innovation Drivers: Blockchain technology advancements, regulatory clarity, increasing demand for secure data management.
- Regulatory Frameworks: Varying regulatory landscapes across different regions influence market growth.
- Product Substitutes: Traditional data security and management solutions pose a competitive threat.
- End-User Trends: Growing adoption of digital technologies across various sectors is driving demand.
- M&A Activity: Consolidation is increasing, with estimated M&A activity exceeding xx Million over the past five years.
Tokenization Solution Market Industry Trends & Insights
The Tokenization Solution Market is experiencing robust growth, driven by increasing digitalization, the need for enhanced data security, and the rising adoption of blockchain technology across multiple sectors. The market is projected to achieve a Compound Annual Growth Rate (CAGR) of xx% during the forecast period (2025-2033). Market penetration is steadily increasing, particularly in sectors like BFSI (Banking, Financial Services, and Insurance) and retail & e-commerce, where the demand for secure payment processing and data management is high. This growth is further fueled by technological disruptions, including improvements in blockchain scalability and interoperability, and the emergence of new use cases for tokenization, such as digital identity and supply chain management. Consumer preferences are shifting towards more secure and transparent digital transactions, creating a favorable environment for the growth of tokenization solutions. Competitive dynamics are intense, with existing players constantly innovating and new entrants emerging, leading to a dynamic and evolving market.
Dominant Markets & Segments in Tokenization Solution Market
The North American region currently holds the largest market share in the Tokenization Solution Market, driven by factors such as early adoption of blockchain technology, a robust regulatory environment (in some areas), and a strong presence of key players. However, the Asia-Pacific region is experiencing rapid growth, fueled by increasing digitalization and economic development.
By Type:
- Solutions: This segment holds a larger market share compared to services, driven by the need for comprehensive and integrated solutions for tokenization.
- Services: The services segment is expected to witness significant growth due to rising demand for specialized consulting and implementation support.
By Deployment:
- Cloud: The cloud deployment model dominates, offering scalability, cost-effectiveness, and ease of access.
- On-Premise: While smaller, the on-premise deployment remains relevant for organizations with stringent data security and compliance requirements.
By End-User Industry:
- BFSI: This sector is a major adopter of tokenization solutions due to high security requirements and the need for efficient transaction processing.
- Retail & E-commerce: Growing online transactions are driving demand for secure payment gateways and fraud prevention solutions.
- Other End-User Industries: Healthcare, Government, and other sectors are increasingly adopting tokenization for data security and process optimization. Growth in these sectors is expected to accelerate over the forecast period.
Tokenization Solution Market Product Developments
Recent product innovations focus on improving interoperability, scalability, and security of tokenization solutions. This includes the development of new protocols and standards that enable seamless integration with existing systems and the creation of solutions that address specific industry needs. The market is witnessing the emergence of specialized tokenization platforms that cater to specific industries, such as supply chain management and digital identity. These developments are enhancing the market fit of tokenization solutions, making them more accessible and appealing to a wider range of users.
Report Scope & Segmentation Analysis
This report segments the Tokenization Solution Market by Type (Solutions, Services), Deployment (On-Premise, Cloud), and End-User Industry (Retail & E-commerce, Transportation & Logistics, BFSI, IT & Telecommunications, Healthcare, Government, Energy & Utilities, Other End-User Industries). Each segment's growth projections, market size, and competitive dynamics are analyzed in detail within the full report. The BFSI segment is anticipated to maintain the largest market share throughout the forecast period, driven by regulatory mandates and security concerns. The cloud deployment model is expected to experience faster growth due to its scalability and cost advantages.
Key Drivers of Tokenization Solution Market Growth
The growth of the Tokenization Solution Market is propelled by several key factors:
- Technological advancements: Improvements in blockchain technology, such as increased scalability and interoperability, are driving wider adoption.
- Increasing demand for data security: The rising number of cyberattacks is prompting organizations to adopt more secure data management solutions.
- Regulatory support: Government initiatives supporting the development and adoption of blockchain technology are creating a more favorable environment.
Challenges in the Tokenization Solution Market Sector
Several challenges hinder the market's growth:
- Regulatory uncertainty: Varying regulatory frameworks across different jurisdictions create uncertainty and hinder market expansion.
- Lack of standardization: The absence of industry-wide standards makes interoperability challenging.
- Technological limitations: Scalability and interoperability issues of existing blockchain platforms remain a concern.
Emerging Opportunities in Tokenization Solution Market
Significant opportunities exist within the Tokenization Solution Market:
- Expansion into new markets: Emerging economies are presenting new growth opportunities due to increasing digitalization.
- Development of innovative applications: Tokenization is finding applications in various industries beyond finance, such as supply chain management and digital identity.
- Integration with other technologies: The integration of tokenization with other technologies, such as IoT and AI, can create new possibilities.
Leading Players in the Tokenization Solution Market Market
- Fiserv Inc
- First Data Corporation
- Cardconnect Corporation
- Hewlett Packard Enterprise
- Liaison Technologies Inc
- Thales Group
- Ciphercloud Incorporation
- Broadcom Inc
- Paymetric Inc (A Worldpay Company)
- Cybersource Corporation
- Protegrity USA Inc
- 3delta Systems Inc
- Tokenex LLC *List Not Exhaustive
Key Developments in Tokenization Solution Market Industry
- May 2023: EY launched EY OpsChain ESG, a blockchain-based solution using tokenization for carbon emission tracking.
- April 2022: Newrl introduced tokenized equity alternatives for unlisted firms in India, enabling ESOP solutions.
Strategic Outlook for Tokenization Solution Market Market
The Tokenization Solution Market is poised for significant growth over the next decade, driven by the increasing adoption of blockchain technology across various industries. Emerging trends like the integration of tokenization with other technologies and the expansion into new markets will further fuel market growth. The market presents significant opportunities for businesses to develop innovative solutions and capitalize on the growing demand for secure and efficient data management.
Tokenization Solution Market Segmentation
-
1. Type
- 1.1. Solutions
- 1.2. Services
-
2. Deployment
- 2.1. On-Premise
- 2.2. Cloud
-
3. End-User Industry
- 3.1. Retail & E-commerce
- 3.2. Transportation & Logistics
- 3.3. BFSI
- 3.4. IT & Telecommunications
- 3.5. Healthcare
- 3.6. Government
- 3.7. Energy & Utilities
- 3.8. Other End-User Industries
Tokenization Solution Market Segmentation By Geography
-
1. North America
- 1.1. United States
- 1.2. Canada
-
2. Europe
- 2.1. United Kingdom
- 2.2. Germany
- 2.3. France
-
3. Asia
- 3.1. China
- 3.2. India
- 4. Australia and New Zealand
-
5. Latin America
- 5.1. Brazil
- 5.2. Mexico
- 5.3. Argentina
- 6. Middle East
-
7. United Arab Emirates
- 7.1. Saudi Arabia
- 7.2. South Africa
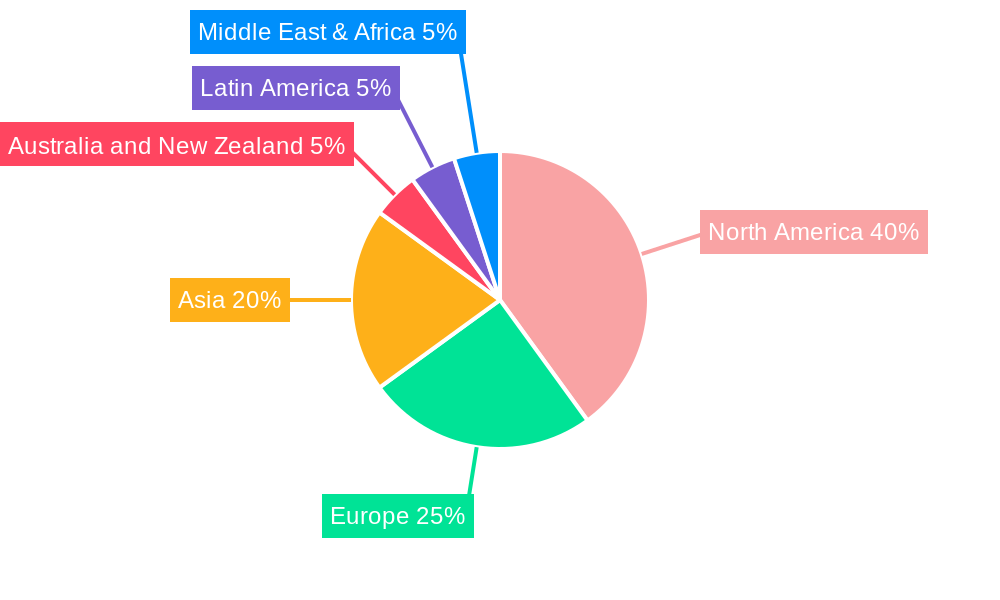
Tokenization Solution Market Regional Market Share
Geographic Coverage of Tokenization Solution Market
Tokenization Solution Market REPORT HIGHLIGHTS
| Aspects | Details |
|---|---|
| Study Period | 2020-2034 |
| Base Year | 2025 |
| Estimated Year | 2026 |
| Forecast Period | 2026-2034 |
| Historical Period | 2020-2025 |
| Growth Rate | CAGR of 17.68% from 2020-2034 |
| Segmentation |
|
Table of Contents
- 1. Introduction
- 1.1. Research Scope
- 1.2. Market Segmentation
- 1.3. Research Objective
- 1.4. Definitions and Assumptions
- 2. Executive Summary
- 2.1. Market Snapshot
- 3. Market Dynamics
- 3.1. Market Drivers
- 3.2. Market Restrains
- 3.3. Market Trends
- 3.4. Market Opportunities
- 4. Market Factor Analysis
- 4.1. Porters Five Forces
- 4.1.1. Bargaining Power of Suppliers
- 4.1.2. Bargaining Power of Buyers
- 4.1.3. Threat of New Entrants
- 4.1.4. Threat of Substitutes
- 4.1.5. Competitive Rivalry
- 4.2. PESTEL analysis
- 4.3. BCG Analysis
- 4.3.1. Stars (High Growth, High Market Share)
- 4.3.2. Cash Cows (Low Growth, High Market Share)
- 4.3.3. Question Mark (High Growth, Low Market Share)
- 4.3.4. Dogs (Low Growth, Low Market Share)
- 4.4. Ansoff Matrix Analysis
- 4.5. Supply Chain Analysis
- 4.6. Regulatory Landscape
- 4.7. Current Market Potential and Opportunity Assessment (TAM–SAM–SOM Framework)
- 4.8. RAX Analyst Note
- 4.1. Porters Five Forces
- 5. Market Analysis, Insights and Forecast 2021-2033
- 5.1. Market Analysis, Insights and Forecast - by Type
- 5.1.1. Solutions
- 5.1.2. Services
- 5.2. Market Analysis, Insights and Forecast - by Deployment
- 5.2.1. On-Premise
- 5.2.2. Cloud
- 5.3. Market Analysis, Insights and Forecast - by End-User Industry
- 5.3.1. Retail & E-commerce
- 5.3.2. Transportation & Logistics
- 5.3.3. BFSI
- 5.3.4. IT & Telecommunications
- 5.3.5. Healthcare
- 5.3.6. Government
- 5.3.7. Energy & Utilities
- 5.3.8. Other End-User Industries
- 5.4. Market Analysis, Insights and Forecast - by Region
- 5.4.1. North America
- 5.4.2. Europe
- 5.4.3. Asia
- 5.4.4. Australia and New Zealand
- 5.4.5. Latin America
- 5.4.6. Middle East
- 5.4.7. United Arab Emirates
- 5.1. Market Analysis, Insights and Forecast - by Type
- 6. Global Tokenization Solution Market Analysis, Insights and Forecast, 2021-2033
- 6.1. Market Analysis, Insights and Forecast - by Type
- 6.1.1. Solutions
- 6.1.2. Services
- 6.2. Market Analysis, Insights and Forecast - by Deployment
- 6.2.1. On-Premise
- 6.2.2. Cloud
- 6.3. Market Analysis, Insights and Forecast - by End-User Industry
- 6.3.1. Retail & E-commerce
- 6.3.2. Transportation & Logistics
- 6.3.3. BFSI
- 6.3.4. IT & Telecommunications
- 6.3.5. Healthcare
- 6.3.6. Government
- 6.3.7. Energy & Utilities
- 6.3.8. Other End-User Industries
- 6.1. Market Analysis, Insights and Forecast - by Type
- 7. North America Tokenization Solution Market Analysis, Insights and Forecast, 2020-2032
- 7.1. Market Analysis, Insights and Forecast - by Type
- 7.1.1. Solutions
- 7.1.2. Services
- 7.2. Market Analysis, Insights and Forecast - by Deployment
- 7.2.1. On-Premise
- 7.2.2. Cloud
- 7.3. Market Analysis, Insights and Forecast - by End-User Industry
- 7.3.1. Retail & E-commerce
- 7.3.2. Transportation & Logistics
- 7.3.3. BFSI
- 7.3.4. IT & Telecommunications
- 7.3.5. Healthcare
- 7.3.6. Government
- 7.3.7. Energy & Utilities
- 7.3.8. Other End-User Industries
- 7.1. Market Analysis, Insights and Forecast - by Type
- 8. Europe Tokenization Solution Market Analysis, Insights and Forecast, 2020-2032
- 8.1. Market Analysis, Insights and Forecast - by Type
- 8.1.1. Solutions
- 8.1.2. Services
- 8.2. Market Analysis, Insights and Forecast - by Deployment
- 8.2.1. On-Premise
- 8.2.2. Cloud
- 8.3. Market Analysis, Insights and Forecast - by End-User Industry
- 8.3.1. Retail & E-commerce
- 8.3.2. Transportation & Logistics
- 8.3.3. BFSI
- 8.3.4. IT & Telecommunications
- 8.3.5. Healthcare
- 8.3.6. Government
- 8.3.7. Energy & Utilities
- 8.3.8. Other End-User Industries
- 8.1. Market Analysis, Insights and Forecast - by Type
- 9. Asia Tokenization Solution Market Analysis, Insights and Forecast, 2020-2032
- 9.1. Market Analysis, Insights and Forecast - by Type
- 9.1.1. Solutions
- 9.1.2. Services
- 9.2. Market Analysis, Insights and Forecast - by Deployment
- 9.2.1. On-Premise
- 9.2.2. Cloud
- 9.3. Market Analysis, Insights and Forecast - by End-User Industry
- 9.3.1. Retail & E-commerce
- 9.3.2. Transportation & Logistics
- 9.3.3. BFSI
- 9.3.4. IT & Telecommunications
- 9.3.5. Healthcare
- 9.3.6. Government
- 9.3.7. Energy & Utilities
- 9.3.8. Other End-User Industries
- 9.1. Market Analysis, Insights and Forecast - by Type
- 10. Australia and New Zealand Tokenization Solution Market Analysis, Insights and Forecast, 2020-2032
- 10.1. Market Analysis, Insights and Forecast - by Type
- 10.1.1. Solutions
- 10.1.2. Services
- 10.2. Market Analysis, Insights and Forecast - by Deployment
- 10.2.1. On-Premise
- 10.2.2. Cloud
- 10.3. Market Analysis, Insights and Forecast - by End-User Industry
- 10.3.1. Retail & E-commerce
- 10.3.2. Transportation & Logistics
- 10.3.3. BFSI
- 10.3.4. IT & Telecommunications
- 10.3.5. Healthcare
- 10.3.6. Government
- 10.3.7. Energy & Utilities
- 10.3.8. Other End-User Industries
- 10.1. Market Analysis, Insights and Forecast - by Type
- 11. Latin America Tokenization Solution Market Analysis, Insights and Forecast, 2020-2032
- 11.1. Market Analysis, Insights and Forecast - by Type
- 11.1.1. Solutions
- 11.1.2. Services
- 11.2. Market Analysis, Insights and Forecast - by Deployment
- 11.2.1. On-Premise
- 11.2.2. Cloud
- 11.3. Market Analysis, Insights and Forecast - by End-User Industry
- 11.3.1. Retail & E-commerce
- 11.3.2. Transportation & Logistics
- 11.3.3. BFSI
- 11.3.4. IT & Telecommunications
- 11.3.5. Healthcare
- 11.3.6. Government
- 11.3.7. Energy & Utilities
- 11.3.8. Other End-User Industries
- 11.1. Market Analysis, Insights and Forecast - by Type
- 12. Middle East Tokenization Solution Market Analysis, Insights and Forecast, 2020-2032
- 12.1. Market Analysis, Insights and Forecast - by Type
- 12.1.1. Solutions
- 12.1.2. Services
- 12.2. Market Analysis, Insights and Forecast - by Deployment
- 12.2.1. On-Premise
- 12.2.2. Cloud
- 12.3. Market Analysis, Insights and Forecast - by End-User Industry
- 12.3.1. Retail & E-commerce
- 12.3.2. Transportation & Logistics
- 12.3.3. BFSI
- 12.3.4. IT & Telecommunications
- 12.3.5. Healthcare
- 12.3.6. Government
- 12.3.7. Energy & Utilities
- 12.3.8. Other End-User Industries
- 12.1. Market Analysis, Insights and Forecast - by Type
- 13. United Arab Emirates Tokenization Solution Market Analysis, Insights and Forecast, 2020-2032
- 13.1. Market Analysis, Insights and Forecast - by Type
- 13.1.1. Solutions
- 13.1.2. Services
- 13.2. Market Analysis, Insights and Forecast - by Deployment
- 13.2.1. On-Premise
- 13.2.2. Cloud
- 13.3. Market Analysis, Insights and Forecast - by End-User Industry
- 13.3.1. Retail & E-commerce
- 13.3.2. Transportation & Logistics
- 13.3.3. BFSI
- 13.3.4. IT & Telecommunications
- 13.3.5. Healthcare
- 13.3.6. Government
- 13.3.7. Energy & Utilities
- 13.3.8. Other End-User Industries
- 13.1. Market Analysis, Insights and Forecast - by Type
- 14. Competitive Analysis
- 14.1. Company Profiles
- 14.1.1 Fiserv Inc
- 14.1.1.1. Company Overview
- 14.1.1.2. Products
- 14.1.1.3. Company Financials
- 14.1.1.4. SWOT Analysis
- 14.1.2 First Data Corporation
- 14.1.2.1. Company Overview
- 14.1.2.2. Products
- 14.1.2.3. Company Financials
- 14.1.2.4. SWOT Analysis
- 14.1.3 Cardconnect Corporation
- 14.1.3.1. Company Overview
- 14.1.3.2. Products
- 14.1.3.3. Company Financials
- 14.1.3.4. SWOT Analysis
- 14.1.4 Hewlett Packard Enterprise
- 14.1.4.1. Company Overview
- 14.1.4.2. Products
- 14.1.4.3. Company Financials
- 14.1.4.4. SWOT Analysis
- 14.1.5 Liaison Technologies Inc
- 14.1.5.1. Company Overview
- 14.1.5.2. Products
- 14.1.5.3. Company Financials
- 14.1.5.4. SWOT Analysis
- 14.1.6 Thales Group
- 14.1.6.1. Company Overview
- 14.1.6.2. Products
- 14.1.6.3. Company Financials
- 14.1.6.4. SWOT Analysis
- 14.1.7 Ciphercloud Incorporation
- 14.1.7.1. Company Overview
- 14.1.7.2. Products
- 14.1.7.3. Company Financials
- 14.1.7.4. SWOT Analysis
- 14.1.8 Broadcom Inc
- 14.1.8.1. Company Overview
- 14.1.8.2. Products
- 14.1.8.3. Company Financials
- 14.1.8.4. SWOT Analysis
- 14.1.9 Paymetric Inc (A Worldpay Company)
- 14.1.9.1. Company Overview
- 14.1.9.2. Products
- 14.1.9.3. Company Financials
- 14.1.9.4. SWOT Analysis
- 14.1.10 Cybersource Corporation
- 14.1.10.1. Company Overview
- 14.1.10.2. Products
- 14.1.10.3. Company Financials
- 14.1.10.4. SWOT Analysis
- 14.1.11 Protegrity USA Inc
- 14.1.11.1. Company Overview
- 14.1.11.2. Products
- 14.1.11.3. Company Financials
- 14.1.11.4. SWOT Analysis
- 14.1.12 3delta Systems Inc
- 14.1.12.1. Company Overview
- 14.1.12.2. Products
- 14.1.12.3. Company Financials
- 14.1.12.4. SWOT Analysis
- 14.1.13 Tokenex LLC*List Not Exhaustive
- 14.1.13.1. Company Overview
- 14.1.13.2. Products
- 14.1.13.3. Company Financials
- 14.1.13.4. SWOT Analysis
- 14.1.1 Fiserv Inc
- 14.2. Market Entropy
- 14.2.1 Company's Key Areas Served
- 14.2.2 Recent Developments
- 14.3. Company Market Share Analysis 2025
- 14.3.1 Top 5 Companies Market Share Analysis
- 14.3.2 Top 3 Companies Market Share Analysis
- 14.4. List of Potential Customers
- 15. Research Methodology
List of Figures
- Figure 1: Global Tokenization Solution Market Revenue Breakdown (Million, %) by Region 2025 & 2033
- Figure 2: North America Tokenization Solution Market Revenue (Million), by Type 2025 & 2033
- Figure 3: North America Tokenization Solution Market Revenue Share (%), by Type 2025 & 2033
- Figure 4: North America Tokenization Solution Market Revenue (Million), by Deployment 2025 & 2033
- Figure 5: North America Tokenization Solution Market Revenue Share (%), by Deployment 2025 & 2033
- Figure 6: North America Tokenization Solution Market Revenue (Million), by End-User Industry 2025 & 2033
- Figure 7: North America Tokenization Solution Market Revenue Share (%), by End-User Industry 2025 & 2033
- Figure 8: North America Tokenization Solution Market Revenue (Million), by Country 2025 & 2033
- Figure 9: North America Tokenization Solution Market Revenue Share (%), by Country 2025 & 2033
- Figure 10: Europe Tokenization Solution Market Revenue (Million), by Type 2025 & 2033
- Figure 11: Europe Tokenization Solution Market Revenue Share (%), by Type 2025 & 2033
- Figure 12: Europe Tokenization Solution Market Revenue (Million), by Deployment 2025 & 2033
- Figure 13: Europe Tokenization Solution Market Revenue Share (%), by Deployment 2025 & 2033
- Figure 14: Europe Tokenization Solution Market Revenue (Million), by End-User Industry 2025 & 2033
- Figure 15: Europe Tokenization Solution Market Revenue Share (%), by End-User Industry 2025 & 2033
- Figure 16: Europe Tokenization Solution Market Revenue (Million), by Country 2025 & 2033
- Figure 17: Europe Tokenization Solution Market Revenue Share (%), by Country 2025 & 2033
- Figure 18: Asia Tokenization Solution Market Revenue (Million), by Type 2025 & 2033
- Figure 19: Asia Tokenization Solution Market Revenue Share (%), by Type 2025 & 2033
- Figure 20: Asia Tokenization Solution Market Revenue (Million), by Deployment 2025 & 2033
- Figure 21: Asia Tokenization Solution Market Revenue Share (%), by Deployment 2025 & 2033
- Figure 22: Asia Tokenization Solution Market Revenue (Million), by End-User Industry 2025 & 2033
- Figure 23: Asia Tokenization Solution Market Revenue Share (%), by End-User Industry 2025 & 2033
- Figure 24: Asia Tokenization Solution Market Revenue (Million), by Country 2025 & 2033
- Figure 25: Asia Tokenization Solution Market Revenue Share (%), by Country 2025 & 2033
- Figure 26: Australia and New Zealand Tokenization Solution Market Revenue (Million), by Type 2025 & 2033
- Figure 27: Australia and New Zealand Tokenization Solution Market Revenue Share (%), by Type 2025 & 2033
- Figure 28: Australia and New Zealand Tokenization Solution Market Revenue (Million), by Deployment 2025 & 2033
- Figure 29: Australia and New Zealand Tokenization Solution Market Revenue Share (%), by Deployment 2025 & 2033
- Figure 30: Australia and New Zealand Tokenization Solution Market Revenue (Million), by End-User Industry 2025 & 2033
- Figure 31: Australia and New Zealand Tokenization Solution Market Revenue Share (%), by End-User Industry 2025 & 2033
- Figure 32: Australia and New Zealand Tokenization Solution Market Revenue (Million), by Country 2025 & 2033
- Figure 33: Australia and New Zealand Tokenization Solution Market Revenue Share (%), by Country 2025 & 2033
- Figure 34: Latin America Tokenization Solution Market Revenue (Million), by Type 2025 & 2033
- Figure 35: Latin America Tokenization Solution Market Revenue Share (%), by Type 2025 & 2033
- Figure 36: Latin America Tokenization Solution Market Revenue (Million), by Deployment 2025 & 2033
- Figure 37: Latin America Tokenization Solution Market Revenue Share (%), by Deployment 2025 & 2033
- Figure 38: Latin America Tokenization Solution Market Revenue (Million), by End-User Industry 2025 & 2033
- Figure 39: Latin America Tokenization Solution Market Revenue Share (%), by End-User Industry 2025 & 2033
- Figure 40: Latin America Tokenization Solution Market Revenue (Million), by Country 2025 & 2033
- Figure 41: Latin America Tokenization Solution Market Revenue Share (%), by Country 2025 & 2033
- Figure 42: Middle East Tokenization Solution Market Revenue (Million), by Type 2025 & 2033
- Figure 43: Middle East Tokenization Solution Market Revenue Share (%), by Type 2025 & 2033
- Figure 44: Middle East Tokenization Solution Market Revenue (Million), by Deployment 2025 & 2033
- Figure 45: Middle East Tokenization Solution Market Revenue Share (%), by Deployment 2025 & 2033
- Figure 46: Middle East Tokenization Solution Market Revenue (Million), by End-User Industry 2025 & 2033
- Figure 47: Middle East Tokenization Solution Market Revenue Share (%), by End-User Industry 2025 & 2033
- Figure 48: Middle East Tokenization Solution Market Revenue (Million), by Country 2025 & 2033
- Figure 49: Middle East Tokenization Solution Market Revenue Share (%), by Country 2025 & 2033
- Figure 50: United Arab Emirates Tokenization Solution Market Revenue (Million), by Type 2025 & 2033
- Figure 51: United Arab Emirates Tokenization Solution Market Revenue Share (%), by Type 2025 & 2033
- Figure 52: United Arab Emirates Tokenization Solution Market Revenue (Million), by Deployment 2025 & 2033
- Figure 53: United Arab Emirates Tokenization Solution Market Revenue Share (%), by Deployment 2025 & 2033
- Figure 54: United Arab Emirates Tokenization Solution Market Revenue (Million), by End-User Industry 2025 & 2033
- Figure 55: United Arab Emirates Tokenization Solution Market Revenue Share (%), by End-User Industry 2025 & 2033
- Figure 56: United Arab Emirates Tokenization Solution Market Revenue (Million), by Country 2025 & 2033
- Figure 57: United Arab Emirates Tokenization Solution Market Revenue Share (%), by Country 2025 & 2033
List of Tables
- Table 1: Global Tokenization Solution Market Revenue Million Forecast, by Type 2020 & 2033
- Table 2: Global Tokenization Solution Market Revenue Million Forecast, by Deployment 2020 & 2033
- Table 3: Global Tokenization Solution Market Revenue Million Forecast, by End-User Industry 2020 & 2033
- Table 4: Global Tokenization Solution Market Revenue Million Forecast, by Region 2020 & 2033
- Table 5: Global Tokenization Solution Market Revenue Million Forecast, by Type 2020 & 2033
- Table 6: Global Tokenization Solution Market Revenue Million Forecast, by Deployment 2020 & 2033
- Table 7: Global Tokenization Solution Market Revenue Million Forecast, by End-User Industry 2020 & 2033
- Table 8: Global Tokenization Solution Market Revenue Million Forecast, by Country 2020 & 2033
- Table 9: United States Tokenization Solution Market Revenue (Million) Forecast, by Application 2020 & 2033
- Table 10: Canada Tokenization Solution Market Revenue (Million) Forecast, by Application 2020 & 2033
- Table 11: Global Tokenization Solution Market Revenue Million Forecast, by Type 2020 & 2033
- Table 12: Global Tokenization Solution Market Revenue Million Forecast, by Deployment 2020 & 2033
- Table 13: Global Tokenization Solution Market Revenue Million Forecast, by End-User Industry 2020 & 2033
- Table 14: Global Tokenization Solution Market Revenue Million Forecast, by Country 2020 & 2033
- Table 15: United Kingdom Tokenization Solution Market Revenue (Million) Forecast, by Application 2020 & 2033
- Table 16: Germany Tokenization Solution Market Revenue (Million) Forecast, by Application 2020 & 2033
- Table 17: France Tokenization Solution Market Revenue (Million) Forecast, by Application 2020 & 2033
- Table 18: Global Tokenization Solution Market Revenue Million Forecast, by Type 2020 & 2033
- Table 19: Global Tokenization Solution Market Revenue Million Forecast, by Deployment 2020 & 2033
- Table 20: Global Tokenization Solution Market Revenue Million Forecast, by End-User Industry 2020 & 2033
- Table 21: Global Tokenization Solution Market Revenue Million Forecast, by Country 2020 & 2033
- Table 22: China Tokenization Solution Market Revenue (Million) Forecast, by Application 2020 & 2033
- Table 23: India Tokenization Solution Market Revenue (Million) Forecast, by Application 2020 & 2033
- Table 24: Global Tokenization Solution Market Revenue Million Forecast, by Type 2020 & 2033
- Table 25: Global Tokenization Solution Market Revenue Million Forecast, by Deployment 2020 & 2033
- Table 26: Global Tokenization Solution Market Revenue Million Forecast, by End-User Industry 2020 & 2033
- Table 27: Global Tokenization Solution Market Revenue Million Forecast, by Country 2020 & 2033
- Table 28: Global Tokenization Solution Market Revenue Million Forecast, by Type 2020 & 2033
- Table 29: Global Tokenization Solution Market Revenue Million Forecast, by Deployment 2020 & 2033
- Table 30: Global Tokenization Solution Market Revenue Million Forecast, by End-User Industry 2020 & 2033
- Table 31: Global Tokenization Solution Market Revenue Million Forecast, by Country 2020 & 2033
- Table 32: Brazil Tokenization Solution Market Revenue (Million) Forecast, by Application 2020 & 2033
- Table 33: Mexico Tokenization Solution Market Revenue (Million) Forecast, by Application 2020 & 2033
- Table 34: Argentina Tokenization Solution Market Revenue (Million) Forecast, by Application 2020 & 2033
- Table 35: Global Tokenization Solution Market Revenue Million Forecast, by Type 2020 & 2033
- Table 36: Global Tokenization Solution Market Revenue Million Forecast, by Deployment 2020 & 2033
- Table 37: Global Tokenization Solution Market Revenue Million Forecast, by End-User Industry 2020 & 2033
- Table 38: Global Tokenization Solution Market Revenue Million Forecast, by Country 2020 & 2033
- Table 39: Global Tokenization Solution Market Revenue Million Forecast, by Type 2020 & 2033
- Table 40: Global Tokenization Solution Market Revenue Million Forecast, by Deployment 2020 & 2033
- Table 41: Global Tokenization Solution Market Revenue Million Forecast, by End-User Industry 2020 & 2033
- Table 42: Global Tokenization Solution Market Revenue Million Forecast, by Country 2020 & 2033
- Table 43: Saudi Arabia Tokenization Solution Market Revenue (Million) Forecast, by Application 2020 & 2033
- Table 44: South Africa Tokenization Solution Market Revenue (Million) Forecast, by Application 2020 & 2033
Frequently Asked Questions
1. What is the projected Compound Annual Growth Rate (CAGR) of the Tokenization Solution Market?
The projected CAGR is approximately 17.68%.
2. Which companies are prominent players in the Tokenization Solution Market?
Key companies in the market include Fiserv Inc, First Data Corporation, Cardconnect Corporation, Hewlett Packard Enterprise, Liaison Technologies Inc, Thales Group, Ciphercloud Incorporation, Broadcom Inc, Paymetric Inc (A Worldpay Company), Cybersource Corporation, Protegrity USA Inc, 3delta Systems Inc, Tokenex LLC*List Not Exhaustive.
3. What are the main segments of the Tokenization Solution Market?
The market segments include Type, Deployment, End-User Industry.
4. Can you provide details about the market size?
The market size is estimated to be USD 5.35 Million as of 2022.
5. What are some drivers contributing to market growth?
Growing Demand for Secure Payment Gateways; Rising Adoption in E-commerce and Mobile payments; Growing Government Regulations On Data Security.
6. What are the notable trends driving market growth?
BFSI to hold the largest market size.
7. Are there any restraints impacting market growth?
Addressing Vulnerabilities From EMV Standards; Lack of Awareness Due to Similar Products.
8. Can you provide examples of recent developments in the market?
May 2023 - The EY company announced that EY OpsChain ESG is now usable in beta form on the EY Blockchain SaaS platform. The new solution, created on the Ethereum blockchain, would give businesses that find it difficult to precisely measure and manage their carbon footprint a single, verified picture of CO2 emissions (CO2e). Through tokenization, it will also give customers, business partners, and regulators the transparency required to trace emissions and carbon credits throughout an ecosystem.
9. What pricing options are available for accessing the report?
Pricing options include single-user, multi-user, and enterprise licenses priced at USD 4750, USD 5250, and USD 8750 respectively.
10. Is the market size provided in terms of value or volume?
The market size is provided in terms of value, measured in Million.
11. Are there any specific market keywords associated with the report?
Yes, the market keyword associated with the report is "Tokenization Solution Market," which aids in identifying and referencing the specific market segment covered.
12. How do I determine which pricing option suits my needs best?
The pricing options vary based on user requirements and access needs. Individual users may opt for single-user licenses, while businesses requiring broader access may choose multi-user or enterprise licenses for cost-effective access to the report.
13. Are there any additional resources or data provided in the Tokenization Solution Market report?
While the report offers comprehensive insights, it's advisable to review the specific contents or supplementary materials provided to ascertain if additional resources or data are available.
14. How can I stay updated on further developments or reports in the Tokenization Solution Market?
To stay informed about further developments, trends, and reports in the Tokenization Solution Market, consider subscribing to industry newsletters, following relevant companies and organizations, or regularly checking reputable industry news sources and publications.
Methodology
Step 1 - Identification of Relevant Samples Size from Population Database


Step 2 - Approaches for Defining Global Market Size (Value, Volume* & Price*)

Note*: In applicable scenarios
Step 3 - Data Sources
Primary Research
- Web Analytics
- Survey Reports
- Research Institute
- Latest Research Reports
- Opinion Leaders
Secondary Research
- Annual Reports
- White Paper
- Latest Press Release
- Industry Association
- Paid Database
- Investor Presentations

Step 4 - Data Triangulation
Involves using different sources of information in order to increase the validity of a study
These sources are likely to be stakeholders in a program - participants, other researchers, program staff, other community members, and so on.
Then we put all data in single framework & apply various statistical tools to find out the dynamic on the market.
During the analysis stage, feedback from the stakeholder groups would be compared to determine areas of agreement as well as areas of divergence