
Key Insights
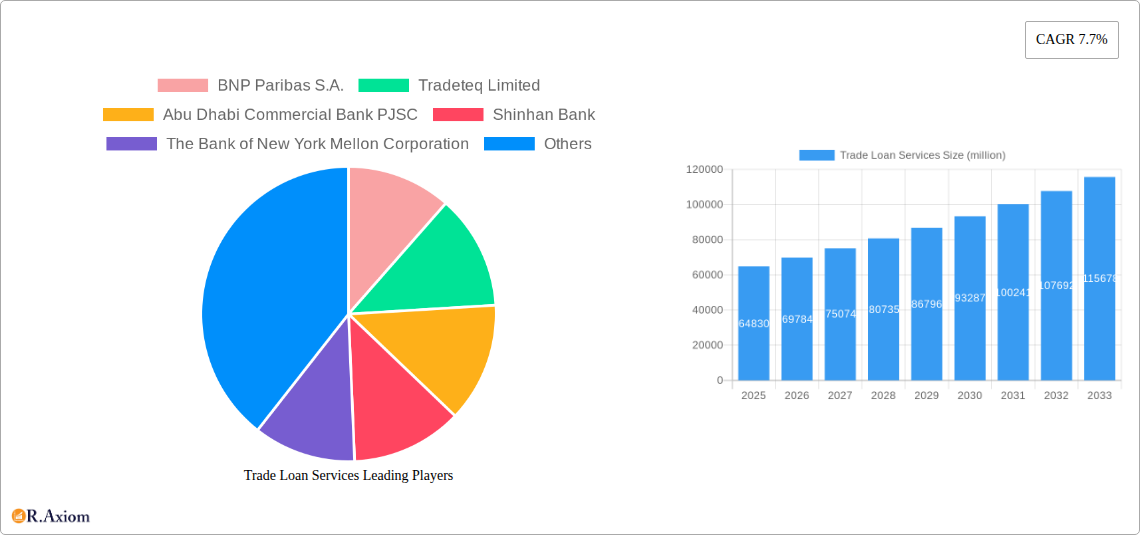
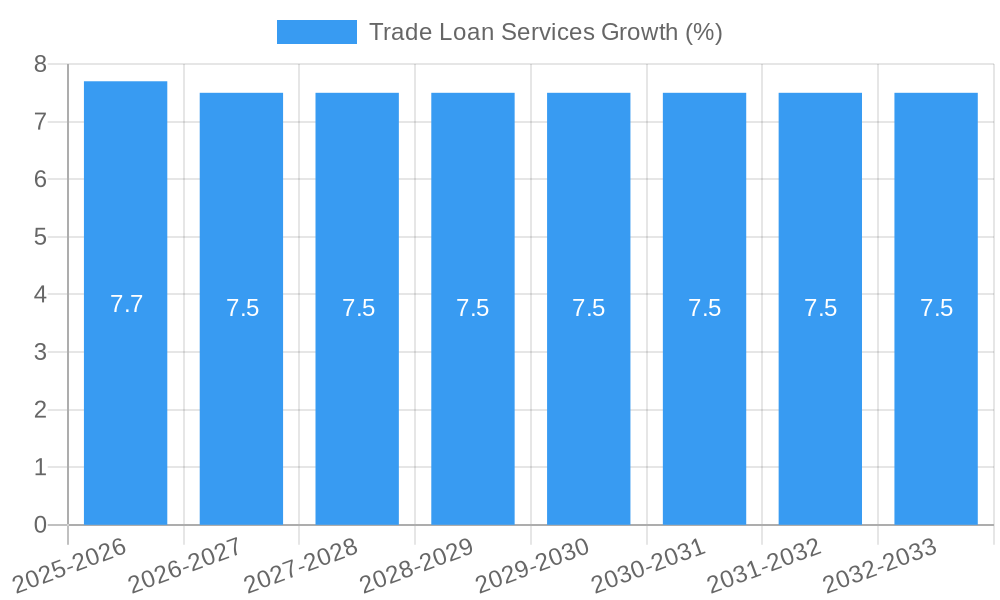
The global Trade Loan Services market is projected for robust growth, reaching an estimated market size of $64,830 million by 2025. This expansion is underpinned by a healthy Compound Annual Growth Rate (CAGR) of 7.7%, indicating sustained demand and increasing adoption of these essential financial instruments. The market is driven by the fundamental need to finance international and domestic trade, facilitating the flow of goods and services across borders and within economies. Key drivers include the increasing volume of global trade, the growing complexity of supply chains, and the persistent need for working capital among exporters and importers to manage payment terms and mitigate risks. Financial institutions are continuously innovating to offer more flexible and accessible trade finance solutions, catering to the diverse needs of businesses of all sizes.
The market is segmented by application into Exporters, Importers, and Traders, reflecting the primary beneficiaries of trade loan services. By type, the services are offered by Banks, Credit Unions, and Other financial entities, with traditional banking institutions holding a significant share while credit unions and fintech providers increasingly contribute to market dynamics. Emerging trends indicate a growing preference for digital trade finance platforms, enhancing efficiency and reducing turnaround times. The integration of blockchain technology for improved transparency and security, along with the rise of supply chain finance solutions, are also shaping the market's future. While the growth is substantial, potential restraints could include stringent regulatory frameworks, geopolitical uncertainties impacting trade flows, and the inherent credit risks associated with trade finance. However, the overarching trend points towards a dynamic and expanding market, with significant opportunities for financial service providers and businesses alike.
This comprehensive report delves into the global Trade Loan Services market, offering an in-depth analysis of its dynamics, trends, and future trajectory. Covering a study period from 2019 to 2033, with a base year of 2025 and a forecast period extending from 2025 to 2033, this report provides actionable insights for stakeholders across the financial and trade ecosystems.
Trade Loan Services Market Concentration & Innovation
The global Trade Loan Services market exhibits a moderate level of concentration, characterized by the presence of a few dominant financial institutions alongside a growing number of specialized fintech players. Innovation is a key differentiator, driven by the increasing demand for faster, more transparent, and digitally-enabled trade finance solutions. Regulatory frameworks are constantly evolving to combat financial crime and ensure market stability, influencing product development and operational strategies. While direct product substitutes for trade loans are limited, the increasing adoption of alternative financing methods and digital platforms presents an indirect competitive pressure. End-user trends are shifting towards greater reliance on digital channels for application, processing, and management of trade finance instruments. Mergers and acquisitions (M&A) activities are observed as companies seek to expand their service offerings, geographical reach, and technological capabilities. The aggregate value of M&A deals in the trade finance technology and services sector is estimated to be in the tens of millions of dollars annually.
- Market Share Distribution: Large multinational banks hold a significant share, estimated at over 70%, while specialized trade finance providers and fintech companies are rapidly gaining ground, potentially reaching 20% by the forecast period.
- Innovation Drivers:
- Digitalization of trade processes
- Blockchain and distributed ledger technology (DLT) for enhanced security and efficiency
- Artificial intelligence (AI) and machine learning (ML) for risk assessment and fraud detection
- API integrations for seamless connectivity with enterprise resource planning (ERP) systems.
- M&A Activities: Strategic acquisitions focus on acquiring technology platforms, expanding into new markets, and consolidating market positions. Deal values often range from several million to tens of millions of dollars, depending on the strategic importance and technological capabilities of the target company.
Trade Loan Services Industry Trends & Insights
The Trade Loan Services industry is experiencing robust growth, projected to achieve a Compound Annual Growth Rate (CAGR) of approximately 7.5% over the forecast period. This expansion is propelled by several interconnected trends. Firstly, the increasing volume and complexity of global trade transactions necessitate sophisticated financing solutions. Exporters and importers alike require readily accessible and tailored credit facilities to manage working capital, mitigate risks, and facilitate cross-border commerce. Technological disruptions are fundamentally reshaping the industry, with a significant push towards digitalization and automation. Platforms leveraging AI, blockchain, and APIs are streamlining the trade loan application, approval, and disbursement processes, reducing turnaround times and operational costs. This digital transformation is also enhancing transparency and security, addressing long-standing concerns within the trade finance ecosystem. Consumer preferences, or rather end-user preferences in this B2B context, are increasingly aligned with digital-first experiences, demanding intuitive interfaces, real-time updates, and efficient customer support. This has led to a surge in demand for online trade finance portals and mobile-enabled solutions. Competitive dynamics are intensifying as traditional banks invest heavily in technology to compete with agile fintech disruptors. The market penetration of digital trade finance solutions is expected to reach over 60% by 2030, reflecting a significant shift in how businesses access and utilize trade loans.
Dominant Markets & Segments in Trade Loan Services
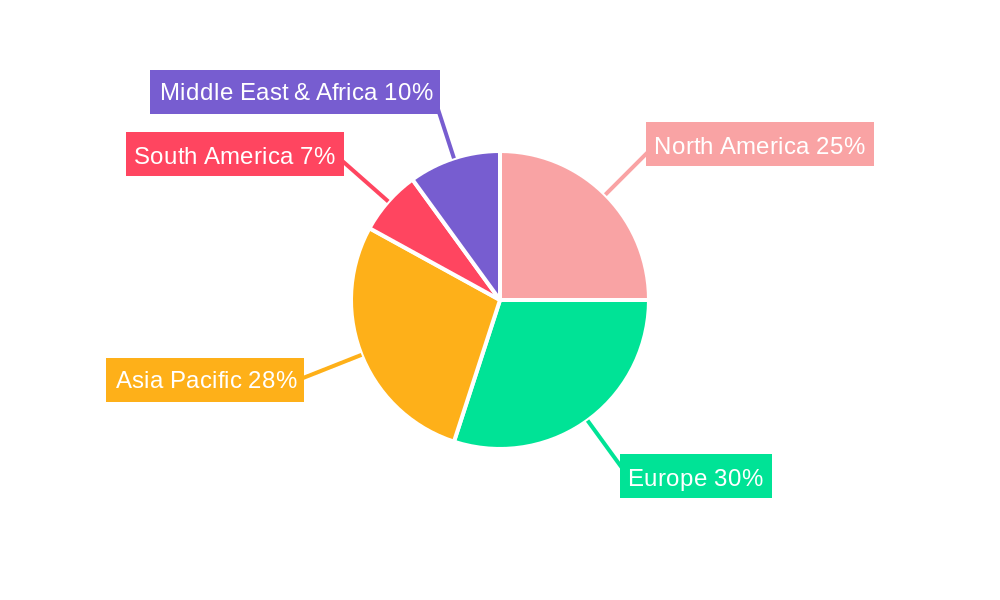
The global Trade Loan Services market is dominated by a few key regions and segments, driven by underlying economic policies, robust trade infrastructure, and evolving financial regulations. Asia-Pacific, particularly China and India, is emerging as a dominant force due to its substantial manufacturing output, burgeoning export-import activities, and increasing adoption of digital financial services. The region's economic policies consistently favor trade facilitation, supported by significant investments in port infrastructure and logistics networks. European markets, with established financial hubs like London and Frankfurt, continue to hold a strong position due to their deep capital markets and sophisticated regulatory environments. North America remains a crucial market, driven by strong trade ties and a high degree of financial innovation.
Within the application segment, Importers represent the largest and most dynamic segment. Their demand for trade loans is intrinsically linked to the volume of goods and services they procure internationally. Economic upturns, increased consumer demand, and the diversification of supply chains directly translate into higher requirements for import financing. Exporters form the second-largest segment, driven by the need for working capital to fund production, manage receivables, and mitigate political and commercial risks associated with international sales. The increasing complexity of global supply chains and the demand for faster payment terms are key growth catalysts for this segment. Traders, while a smaller segment, play a vital role in arbitrage and supply chain optimization, often requiring flexible and swift financing solutions.
In terms of type, Banks remain the dominant players, commanding a substantial market share due to their established infrastructure, regulatory compliance, and ability to offer a wide spectrum of financial products. Their deep relationships with corporate clients and their role as trusted intermediaries in international trade secure their leading position. Credit Unions, while a smaller segment, are increasingly focusing on trade finance solutions for their small and medium-sized enterprise (SME) client base, offering personalized services and competitive rates. The Others segment, encompassing fintech companies, specialized trade finance providers, and digital platforms, is experiencing the fastest growth, driven by technological innovation, agility, and a focus on niche market segments.
- Key Drivers of Dominance:
- Economic Policies: Government initiatives promoting exports, facilitating imports, and creating a favorable business environment.
- Trade Volume: High levels of international trade activity, driven by global demand and supply chain dynamics.
- Financial Infrastructure: Well-developed banking systems, capital markets, and payment networks.
- Technological Adoption: Increasing use of digital platforms for trade finance operations.
- Regulatory Environment: Clear and supportive regulations for trade and finance.
Trade Loan Services Product Developments
Recent product developments in Trade Loan Services are largely centered on enhancing efficiency, transparency, and accessibility through digital innovation. Companies are introducing AI-powered platforms for automated risk assessment and credit scoring, significantly reducing processing times for loan applications. The integration of blockchain technology is leading to the development of secure and immutable digital trade documents, streamlining the verification process and mitigating fraud. Furthermore, the creation of integrated digital ecosystems allows for seamless connectivity between banks, businesses, and logistics providers, offering end-to-end trade finance solutions. These innovations provide competitive advantages by lowering costs, improving user experience, and enabling faster disbursement of funds, catering to the growing demand for agile and responsive trade finance.
Report Scope & Segmentation Analysis
This report analyzes the global Trade Loan Services market segmented by application and type. The Application segment includes Exporters, Importers, and Traders. Exporters are businesses selling goods and services internationally, requiring loans for production and working capital. Importers are businesses purchasing goods and services from abroad, needing finance for procurement and payment. Traders are intermediaries facilitating transactions between buyers and sellers, often requiring agile financing for inventory management and arbitrage. The Type segment comprises Banks, Credit Unions, and Others. Banks, traditional financial institutions, offer comprehensive trade finance solutions. Credit Unions, while smaller, cater to specific member needs. The "Others" category includes fintech companies, alternative lenders, and technology providers specializing in trade finance.
- Exporters: Projected to see a CAGR of 6.8% from 2025-2033, with a market size estimated at over twenty million dollars in 2025. Competitive dynamics are driven by access to competitive rates and tailored working capital solutions.
- Importers: Expected to experience a CAGR of 7.9% from 2025-2033, with a market size estimated at over thirty million dollars in 2025. Key growth drivers include the increasing volume of global trade and the need for efficient payment mechanisms.
- Traders: Anticipated CAGR of 7.2% from 2025-2033, with a market size estimated at over ten million dollars in 2025. Growth is fueled by the demand for flexible and rapid financing to support diverse trading operations.
- Banks: Expected to maintain dominance with a CAGR of 7.0% from 2025-2033, holding an estimated market share of over sixty-five percent in 2025. Their strength lies in established trust and comprehensive product offerings.
- Credit Unions: Projected CAGR of 6.5% from 2025-2033, with a focus on niche markets and personalized services. Their market share is estimated at around five percent in 2025.
- Others: Poised for the highest growth with a CAGR of 9.2% from 2025-2033, driven by technological innovation and agility. Their market share is estimated to reach over twenty-eight percent in 2025.
Key Drivers of Trade Loan Services Growth
The growth of the Trade Loan Services market is propelled by a confluence of factors. Technological advancements are at the forefront, with digitalization and automation of trade finance processes significantly enhancing efficiency and reducing costs. This includes the adoption of AI for risk assessment and blockchain for secure transaction recording. Economic growth and globalization continue to drive cross-border trade, directly increasing the demand for financing. As economies expand and international trade volumes rise, so does the need for working capital, letters of credit, and other trade finance instruments. Favorable regulatory environments that promote trade facilitation and financial inclusion also act as significant catalysts. Governments worldwide are implementing policies to streamline trade processes and encourage the use of trade finance.
Challenges in the Trade Loan Services Sector
Despite the positive outlook, the Trade Loan Services sector faces several significant challenges. Regulatory hurdles and compliance costs remain a primary concern, with stringent anti-money laundering (AML) and know-your-customer (KYC) regulations requiring substantial investment and operational rigor. Cybersecurity threats pose a continuous risk, as the increasing digitalization of trade finance makes systems vulnerable to data breaches and fraudulent activities, potentially impacting transaction integrity. Counterparty risk and credit risk in volatile global economic conditions can lead to increased defaults, impacting lenders' profitability. Furthermore, competition from new entrants and alternative financing models puts pressure on traditional players to innovate and adapt, while complex supply chain disruptions, as seen in recent years, can impact the timely execution of trade deals and repayment schedules.
Emerging Opportunities in Trade Loan Services
Emerging opportunities in the Trade Loan Services market are driven by technological innovation and evolving global trade dynamics. The increasing adoption of digital trade finance platforms powered by AI and blockchain presents a significant opportunity to enhance efficiency, reduce costs, and improve transparency for SMEs. There is a growing demand for supply chain finance solutions that extend financing beyond immediate trade partners, improving liquidity across the entire value chain. The expansion of emerging markets and their increasing integration into global trade networks offers untapped potential for trade loan services. Furthermore, the development of specialized financing products tailored to specific industries or trade routes can unlock new revenue streams and cater to niche market demands.
Leading Players in the Trade Loan Services Market
- BNP Paribas S.A.
- Tradeteq Limited
- Abu Dhabi Commercial Bank PJSC
- Shinhan Bank
- The Bank of New York Mellon Corporation
- Commerzbank AG
- The Australia and New Zealand Banking Group Limited
- Societe Generale S.A.
- Finastra
- Asseco Poland SA
- The State Bank of India
- Goldman Sachs Group Inc
- Asian Development Bank
- Banco Santander SA
- JPMorgan Chase & Co.
- Citigroup Inc.
- Bank of America Corp
- HSBC Holdings Plc
- Euler Hermes
- Crédit Agricole Group
Key Developments in Trade Loan Services Industry
- 2023: Finastra launches its next-generation trade finance platform, incorporating enhanced AI capabilities for automated risk assessment and faster onboarding.
- 2023: Tradeteq Limited announces a strategic partnership with a major European bank to deploy its blockchain-based trade finance solution, aiming to reduce settlement times by 50%.
- 2024: Euler Hermes enhances its trade credit insurance offerings with digital tools for real-time risk monitoring and claims processing, benefiting exporters.
- 2024: Asian Development Bank collaborates with several financial institutions to pilot a digital trade finance platform aimed at increasing accessibility for SMEs in Southeast Asia.
- 2024: JPMorgan Chase & Co. invests heavily in expanding its digital trade finance capabilities, focusing on API integrations to connect with client ERP systems.
- 2024: The State Bank of India streamlines its trade loan application process by introducing an end-to-end digital portal, reducing manual interventions and processing time.
- 2024: HSBC Holdings Plc expands its green trade finance offerings, supporting businesses involved in sustainable supply chains and environmental initiatives.
- 2025: Commerzbank AG and Societe Generale S.A. explore potential collaboration on a cross-border digital trade finance initiative, aiming to harmonize documentation and processes.
- 2025: The Australia and New Zealand Banking Group Limited announces a significant upgrade to its trade finance platform, focusing on enhanced security features and real-time transaction tracking.
- 2025: Abu Dhabi Commercial Bank PJSC integrates advanced analytics into its trade loan services to provide more personalized risk insights and financing options to its corporate clients.
Strategic Outlook for Trade Loan Services Market
The strategic outlook for the Trade Loan Services market is characterized by a strong emphasis on digital transformation, customer-centric solutions, and sustainable finance. The continued adoption of advanced technologies like AI and blockchain will be critical for driving operational efficiencies and enhancing security. The increasing demand for integrated trade finance platforms that offer seamless connectivity and end-to-end processing presents a significant opportunity for growth. Furthermore, as global trade continues to evolve, there will be a growing need for innovative and flexible financing solutions that cater to the specific needs of various industries and market segments, including a heightened focus on green trade finance initiatives supporting sustainable business practices.
Trade Loan Services Segmentation
-
1. Application
- 1.1. Exporters
- 1.2. Importers
- 1.3. Traders
-
2. Type
- 2.1. Banks
- 2.2. Credit Unions
- 2.3. Others
Trade Loan Services Segmentation By Geography
-
1. North America
- 1.1. United States
- 1.2. Canada
- 1.3. Mexico
-
2. South America
- 2.1. Brazil
- 2.2. Argentina
- 2.3. Rest of South America
-
3. Europe
- 3.1. United Kingdom
- 3.2. Germany
- 3.3. France
- 3.4. Italy
- 3.5. Spain
- 3.6. Russia
- 3.7. Benelux
- 3.8. Nordics
- 3.9. Rest of Europe
-
4. Middle East & Africa
- 4.1. Turkey
- 4.2. Israel
- 4.3. GCC
- 4.4. North Africa
- 4.5. South Africa
- 4.6. Rest of Middle East & Africa
-
5. Asia Pacific
- 5.1. China
- 5.2. India
- 5.3. Japan
- 5.4. South Korea
- 5.5. ASEAN
- 5.6. Oceania
- 5.7. Rest of Asia Pacific
Trade Loan Services REPORT HIGHLIGHTS
| Aspects | Details |
|---|---|
| Study Period | 2019-2033 |
| Base Year | 2024 |
| Estimated Year | 2025 |
| Forecast Period | 2025-2033 |
| Historical Period | 2019-2024 |
| Growth Rate | CAGR of 7.7% from 2019-2033 |
| Segmentation |
|
Table of Contents
- 1. Introduction
- 1.1. Research Scope
- 1.2. Market Segmentation
- 1.3. Research Methodology
- 1.4. Definitions and Assumptions
- 2. Executive Summary
- 2.1. Introduction
- 3. Market Dynamics
- 3.1. Introduction
- 3.2. Market Drivers
- 3.3. Market Restrains
- 3.4. Market Trends
- 4. Market Factor Analysis
- 4.1. Porters Five Forces
- 4.2. Supply/Value Chain
- 4.3. PESTEL analysis
- 4.4. Market Entropy
- 4.5. Patent/Trademark Analysis
- 5. Global Trade Loan Services Analysis, Insights and Forecast, 2019-2031
- 5.1. Market Analysis, Insights and Forecast - by Application
- 5.1.1. Exporters
- 5.1.2. Importers
- 5.1.3. Traders
- 5.2. Market Analysis, Insights and Forecast - by Type
- 5.2.1. Banks
- 5.2.2. Credit Unions
- 5.2.3. Others
- 5.3. Market Analysis, Insights and Forecast - by Region
- 5.3.1. North America
- 5.3.2. South America
- 5.3.3. Europe
- 5.3.4. Middle East & Africa
- 5.3.5. Asia Pacific
- 5.1. Market Analysis, Insights and Forecast - by Application
- 6. North America Trade Loan Services Analysis, Insights and Forecast, 2019-2031
- 6.1. Market Analysis, Insights and Forecast - by Application
- 6.1.1. Exporters
- 6.1.2. Importers
- 6.1.3. Traders
- 6.2. Market Analysis, Insights and Forecast - by Type
- 6.2.1. Banks
- 6.2.2. Credit Unions
- 6.2.3. Others
- 6.1. Market Analysis, Insights and Forecast - by Application
- 7. South America Trade Loan Services Analysis, Insights and Forecast, 2019-2031
- 7.1. Market Analysis, Insights and Forecast - by Application
- 7.1.1. Exporters
- 7.1.2. Importers
- 7.1.3. Traders
- 7.2. Market Analysis, Insights and Forecast - by Type
- 7.2.1. Banks
- 7.2.2. Credit Unions
- 7.2.3. Others
- 7.1. Market Analysis, Insights and Forecast - by Application
- 8. Europe Trade Loan Services Analysis, Insights and Forecast, 2019-2031
- 8.1. Market Analysis, Insights and Forecast - by Application
- 8.1.1. Exporters
- 8.1.2. Importers
- 8.1.3. Traders
- 8.2. Market Analysis, Insights and Forecast - by Type
- 8.2.1. Banks
- 8.2.2. Credit Unions
- 8.2.3. Others
- 8.1. Market Analysis, Insights and Forecast - by Application
- 9. Middle East & Africa Trade Loan Services Analysis, Insights and Forecast, 2019-2031
- 9.1. Market Analysis, Insights and Forecast - by Application
- 9.1.1. Exporters
- 9.1.2. Importers
- 9.1.3. Traders
- 9.2. Market Analysis, Insights and Forecast - by Type
- 9.2.1. Banks
- 9.2.2. Credit Unions
- 9.2.3. Others
- 9.1. Market Analysis, Insights and Forecast - by Application
- 10. Asia Pacific Trade Loan Services Analysis, Insights and Forecast, 2019-2031
- 10.1. Market Analysis, Insights and Forecast - by Application
- 10.1.1. Exporters
- 10.1.2. Importers
- 10.1.3. Traders
- 10.2. Market Analysis, Insights and Forecast - by Type
- 10.2.1. Banks
- 10.2.2. Credit Unions
- 10.2.3. Others
- 10.1. Market Analysis, Insights and Forecast - by Application
- 11. Competitive Analysis
- 11.1. Global Market Share Analysis 2024
- 11.2. Company Profiles
- 11.2.1 BNP Paribas S.A.
- 11.2.1.1. Overview
- 11.2.1.2. Products
- 11.2.1.3. SWOT Analysis
- 11.2.1.4. Recent Developments
- 11.2.1.5. Financials (Based on Availability)
- 11.2.2 Tradeteq Limited
- 11.2.2.1. Overview
- 11.2.2.2. Products
- 11.2.2.3. SWOT Analysis
- 11.2.2.4. Recent Developments
- 11.2.2.5. Financials (Based on Availability)
- 11.2.3 Abu Dhabi Commercial Bank PJSC
- 11.2.3.1. Overview
- 11.2.3.2. Products
- 11.2.3.3. SWOT Analysis
- 11.2.3.4. Recent Developments
- 11.2.3.5. Financials (Based on Availability)
- 11.2.4 Shinhan Bank
- 11.2.4.1. Overview
- 11.2.4.2. Products
- 11.2.4.3. SWOT Analysis
- 11.2.4.4. Recent Developments
- 11.2.4.5. Financials (Based on Availability)
- 11.2.5 The Bank of New York Mellon Corporation
- 11.2.5.1. Overview
- 11.2.5.2. Products
- 11.2.5.3. SWOT Analysis
- 11.2.5.4. Recent Developments
- 11.2.5.5. Financials (Based on Availability)
- 11.2.6 Commerzbank AG
- 11.2.6.1. Overview
- 11.2.6.2. Products
- 11.2.6.3. SWOT Analysis
- 11.2.6.4. Recent Developments
- 11.2.6.5. Financials (Based on Availability)
- 11.2.7 The Australia and New Zealand Banking Group Limited
- 11.2.7.1. Overview
- 11.2.7.2. Products
- 11.2.7.3. SWOT Analysis
- 11.2.7.4. Recent Developments
- 11.2.7.5. Financials (Based on Availability)
- 11.2.8 Societe Generale S.A.
- 11.2.8.1. Overview
- 11.2.8.2. Products
- 11.2.8.3. SWOT Analysis
- 11.2.8.4. Recent Developments
- 11.2.8.5. Financials (Based on Availability)
- 11.2.9 Finastra
- 11.2.9.1. Overview
- 11.2.9.2. Products
- 11.2.9.3. SWOT Analysis
- 11.2.9.4. Recent Developments
- 11.2.9.5. Financials (Based on Availability)
- 11.2.10 Asseco Poland SA
- 11.2.10.1. Overview
- 11.2.10.2. Products
- 11.2.10.3. SWOT Analysis
- 11.2.10.4. Recent Developments
- 11.2.10.5. Financials (Based on Availability)
- 11.2.11 The State Bank of India
- 11.2.11.1. Overview
- 11.2.11.2. Products
- 11.2.11.3. SWOT Analysis
- 11.2.11.4. Recent Developments
- 11.2.11.5. Financials (Based on Availability)
- 11.2.12 Goldman Sachs Group Inc
- 11.2.12.1. Overview
- 11.2.12.2. Products
- 11.2.12.3. SWOT Analysis
- 11.2.12.4. Recent Developments
- 11.2.12.5. Financials (Based on Availability)
- 11.2.13 Asian Development Bank
- 11.2.13.1. Overview
- 11.2.13.2. Products
- 11.2.13.3. SWOT Analysis
- 11.2.13.4. Recent Developments
- 11.2.13.5. Financials (Based on Availability)
- 11.2.14 Banco Santander SA
- 11.2.14.1. Overview
- 11.2.14.2. Products
- 11.2.14.3. SWOT Analysis
- 11.2.14.4. Recent Developments
- 11.2.14.5. Financials (Based on Availability)
- 11.2.15 JPMorgan Chase & Co.
- 11.2.15.1. Overview
- 11.2.15.2. Products
- 11.2.15.3. SWOT Analysis
- 11.2.15.4. Recent Developments
- 11.2.15.5. Financials (Based on Availability)
- 11.2.16 Citigroup Inc.
- 11.2.16.1. Overview
- 11.2.16.2. Products
- 11.2.16.3. SWOT Analysis
- 11.2.16.4. Recent Developments
- 11.2.16.5. Financials (Based on Availability)
- 11.2.17 Bank of America Corp
- 11.2.17.1. Overview
- 11.2.17.2. Products
- 11.2.17.3. SWOT Analysis
- 11.2.17.4. Recent Developments
- 11.2.17.5. Financials (Based on Availability)
- 11.2.18 HSBC Holdings Plc
- 11.2.18.1. Overview
- 11.2.18.2. Products
- 11.2.18.3. SWOT Analysis
- 11.2.18.4. Recent Developments
- 11.2.18.5. Financials (Based on Availability)
- 11.2.19 Euler Hermes
- 11.2.19.1. Overview
- 11.2.19.2. Products
- 11.2.19.3. SWOT Analysis
- 11.2.19.4. Recent Developments
- 11.2.19.5. Financials (Based on Availability)
- 11.2.20 Crédit Agricole Group
- 11.2.20.1. Overview
- 11.2.20.2. Products
- 11.2.20.3. SWOT Analysis
- 11.2.20.4. Recent Developments
- 11.2.20.5. Financials (Based on Availability)
- 11.2.1 BNP Paribas S.A.
List of Figures
- Figure 1: Global Trade Loan Services Revenue Breakdown (million, %) by Region 2024 & 2032
- Figure 2: North America Trade Loan Services Revenue (million), by Application 2024 & 2032
- Figure 3: North America Trade Loan Services Revenue Share (%), by Application 2024 & 2032
- Figure 4: North America Trade Loan Services Revenue (million), by Type 2024 & 2032
- Figure 5: North America Trade Loan Services Revenue Share (%), by Type 2024 & 2032
- Figure 6: North America Trade Loan Services Revenue (million), by Country 2024 & 2032
- Figure 7: North America Trade Loan Services Revenue Share (%), by Country 2024 & 2032
- Figure 8: South America Trade Loan Services Revenue (million), by Application 2024 & 2032
- Figure 9: South America Trade Loan Services Revenue Share (%), by Application 2024 & 2032
- Figure 10: South America Trade Loan Services Revenue (million), by Type 2024 & 2032
- Figure 11: South America Trade Loan Services Revenue Share (%), by Type 2024 & 2032
- Figure 12: South America Trade Loan Services Revenue (million), by Country 2024 & 2032
- Figure 13: South America Trade Loan Services Revenue Share (%), by Country 2024 & 2032
- Figure 14: Europe Trade Loan Services Revenue (million), by Application 2024 & 2032
- Figure 15: Europe Trade Loan Services Revenue Share (%), by Application 2024 & 2032
- Figure 16: Europe Trade Loan Services Revenue (million), by Type 2024 & 2032
- Figure 17: Europe Trade Loan Services Revenue Share (%), by Type 2024 & 2032
- Figure 18: Europe Trade Loan Services Revenue (million), by Country 2024 & 2032
- Figure 19: Europe Trade Loan Services Revenue Share (%), by Country 2024 & 2032
- Figure 20: Middle East & Africa Trade Loan Services Revenue (million), by Application 2024 & 2032
- Figure 21: Middle East & Africa Trade Loan Services Revenue Share (%), by Application 2024 & 2032
- Figure 22: Middle East & Africa Trade Loan Services Revenue (million), by Type 2024 & 2032
- Figure 23: Middle East & Africa Trade Loan Services Revenue Share (%), by Type 2024 & 2032
- Figure 24: Middle East & Africa Trade Loan Services Revenue (million), by Country 2024 & 2032
- Figure 25: Middle East & Africa Trade Loan Services Revenue Share (%), by Country 2024 & 2032
- Figure 26: Asia Pacific Trade Loan Services Revenue (million), by Application 2024 & 2032
- Figure 27: Asia Pacific Trade Loan Services Revenue Share (%), by Application 2024 & 2032
- Figure 28: Asia Pacific Trade Loan Services Revenue (million), by Type 2024 & 2032
- Figure 29: Asia Pacific Trade Loan Services Revenue Share (%), by Type 2024 & 2032
- Figure 30: Asia Pacific Trade Loan Services Revenue (million), by Country 2024 & 2032
- Figure 31: Asia Pacific Trade Loan Services Revenue Share (%), by Country 2024 & 2032
List of Tables
- Table 1: Global Trade Loan Services Revenue million Forecast, by Region 2019 & 2032
- Table 2: Global Trade Loan Services Revenue million Forecast, by Application 2019 & 2032
- Table 3: Global Trade Loan Services Revenue million Forecast, by Type 2019 & 2032
- Table 4: Global Trade Loan Services Revenue million Forecast, by Region 2019 & 2032
- Table 5: Global Trade Loan Services Revenue million Forecast, by Application 2019 & 2032
- Table 6: Global Trade Loan Services Revenue million Forecast, by Type 2019 & 2032
- Table 7: Global Trade Loan Services Revenue million Forecast, by Country 2019 & 2032
- Table 8: United States Trade Loan Services Revenue (million) Forecast, by Application 2019 & 2032
- Table 9: Canada Trade Loan Services Revenue (million) Forecast, by Application 2019 & 2032
- Table 10: Mexico Trade Loan Services Revenue (million) Forecast, by Application 2019 & 2032
- Table 11: Global Trade Loan Services Revenue million Forecast, by Application 2019 & 2032
- Table 12: Global Trade Loan Services Revenue million Forecast, by Type 2019 & 2032
- Table 13: Global Trade Loan Services Revenue million Forecast, by Country 2019 & 2032
- Table 14: Brazil Trade Loan Services Revenue (million) Forecast, by Application 2019 & 2032
- Table 15: Argentina Trade Loan Services Revenue (million) Forecast, by Application 2019 & 2032
- Table 16: Rest of South America Trade Loan Services Revenue (million) Forecast, by Application 2019 & 2032
- Table 17: Global Trade Loan Services Revenue million Forecast, by Application 2019 & 2032
- Table 18: Global Trade Loan Services Revenue million Forecast, by Type 2019 & 2032
- Table 19: Global Trade Loan Services Revenue million Forecast, by Country 2019 & 2032
- Table 20: United Kingdom Trade Loan Services Revenue (million) Forecast, by Application 2019 & 2032
- Table 21: Germany Trade Loan Services Revenue (million) Forecast, by Application 2019 & 2032
- Table 22: France Trade Loan Services Revenue (million) Forecast, by Application 2019 & 2032
- Table 23: Italy Trade Loan Services Revenue (million) Forecast, by Application 2019 & 2032
- Table 24: Spain Trade Loan Services Revenue (million) Forecast, by Application 2019 & 2032
- Table 25: Russia Trade Loan Services Revenue (million) Forecast, by Application 2019 & 2032
- Table 26: Benelux Trade Loan Services Revenue (million) Forecast, by Application 2019 & 2032
- Table 27: Nordics Trade Loan Services Revenue (million) Forecast, by Application 2019 & 2032
- Table 28: Rest of Europe Trade Loan Services Revenue (million) Forecast, by Application 2019 & 2032
- Table 29: Global Trade Loan Services Revenue million Forecast, by Application 2019 & 2032
- Table 30: Global Trade Loan Services Revenue million Forecast, by Type 2019 & 2032
- Table 31: Global Trade Loan Services Revenue million Forecast, by Country 2019 & 2032
- Table 32: Turkey Trade Loan Services Revenue (million) Forecast, by Application 2019 & 2032
- Table 33: Israel Trade Loan Services Revenue (million) Forecast, by Application 2019 & 2032
- Table 34: GCC Trade Loan Services Revenue (million) Forecast, by Application 2019 & 2032
- Table 35: North Africa Trade Loan Services Revenue (million) Forecast, by Application 2019 & 2032
- Table 36: South Africa Trade Loan Services Revenue (million) Forecast, by Application 2019 & 2032
- Table 37: Rest of Middle East & Africa Trade Loan Services Revenue (million) Forecast, by Application 2019 & 2032
- Table 38: Global Trade Loan Services Revenue million Forecast, by Application 2019 & 2032
- Table 39: Global Trade Loan Services Revenue million Forecast, by Type 2019 & 2032
- Table 40: Global Trade Loan Services Revenue million Forecast, by Country 2019 & 2032
- Table 41: China Trade Loan Services Revenue (million) Forecast, by Application 2019 & 2032
- Table 42: India Trade Loan Services Revenue (million) Forecast, by Application 2019 & 2032
- Table 43: Japan Trade Loan Services Revenue (million) Forecast, by Application 2019 & 2032
- Table 44: South Korea Trade Loan Services Revenue (million) Forecast, by Application 2019 & 2032
- Table 45: ASEAN Trade Loan Services Revenue (million) Forecast, by Application 2019 & 2032
- Table 46: Oceania Trade Loan Services Revenue (million) Forecast, by Application 2019 & 2032
- Table 47: Rest of Asia Pacific Trade Loan Services Revenue (million) Forecast, by Application 2019 & 2032
Frequently Asked Questions
1. What is the projected Compound Annual Growth Rate (CAGR) of the Trade Loan Services?
The projected CAGR is approximately 7.7%.
2. Which companies are prominent players in the Trade Loan Services?
Key companies in the market include BNP Paribas S.A., Tradeteq Limited, Abu Dhabi Commercial Bank PJSC, Shinhan Bank, The Bank of New York Mellon Corporation, Commerzbank AG, The Australia and New Zealand Banking Group Limited, Societe Generale S.A., Finastra, Asseco Poland SA, The State Bank of India, Goldman Sachs Group Inc, Asian Development Bank, Banco Santander SA, JPMorgan Chase & Co., Citigroup Inc., Bank of America Corp, HSBC Holdings Plc, Euler Hermes, Crédit Agricole Group.
3. What are the main segments of the Trade Loan Services?
The market segments include Application, Type.
4. Can you provide details about the market size?
The market size is estimated to be USD 64830 million as of 2022.
5. What are some drivers contributing to market growth?
N/A
6. What are the notable trends driving market growth?
N/A
7. Are there any restraints impacting market growth?
N/A
8. Can you provide examples of recent developments in the market?
N/A
9. What pricing options are available for accessing the report?
Pricing options include single-user, multi-user, and enterprise licenses priced at USD 2900.00, USD 4350.00, and USD 5800.00 respectively.
10. Is the market size provided in terms of value or volume?
The market size is provided in terms of value, measured in million.
11. Are there any specific market keywords associated with the report?
Yes, the market keyword associated with the report is "Trade Loan Services," which aids in identifying and referencing the specific market segment covered.
12. How do I determine which pricing option suits my needs best?
The pricing options vary based on user requirements and access needs. Individual users may opt for single-user licenses, while businesses requiring broader access may choose multi-user or enterprise licenses for cost-effective access to the report.
13. Are there any additional resources or data provided in the Trade Loan Services report?
While the report offers comprehensive insights, it's advisable to review the specific contents or supplementary materials provided to ascertain if additional resources or data are available.
14. How can I stay updated on further developments or reports in the Trade Loan Services?
To stay informed about further developments, trends, and reports in the Trade Loan Services, consider subscribing to industry newsletters, following relevant companies and organizations, or regularly checking reputable industry news sources and publications.
Methodology
Step 1 - Identification of Relevant Samples Size from Population Database


Step 2 - Approaches for Defining Global Market Size (Value, Volume* & Price*)

Note*: In applicable scenarios
Step 3 - Data Sources
Primary Research
- Web Analytics
- Survey Reports
- Research Institute
- Latest Research Reports
- Opinion Leaders
Secondary Research
- Annual Reports
- White Paper
- Latest Press Release
- Industry Association
- Paid Database
- Investor Presentations

Step 4 - Data Triangulation
Involves using different sources of information in order to increase the validity of a study
These sources are likely to be stakeholders in a program - participants, other researchers, program staff, other community members, and so on.
Then we put all data in single framework & apply various statistical tools to find out the dynamic on the market.
During the analysis stage, feedback from the stakeholder groups would be compared to determine areas of agreement as well as areas of divergence


