

Key Insights
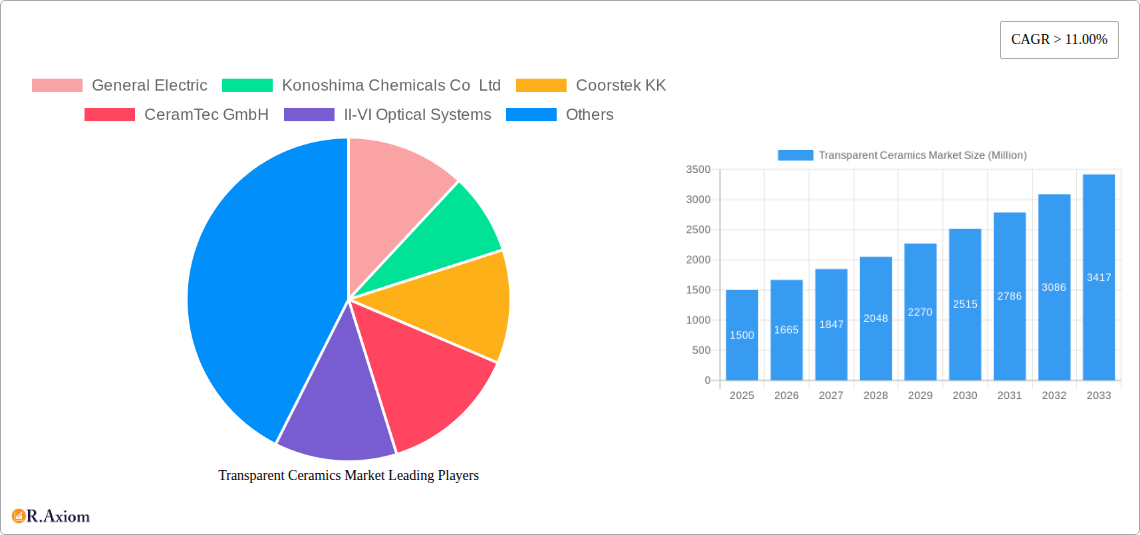
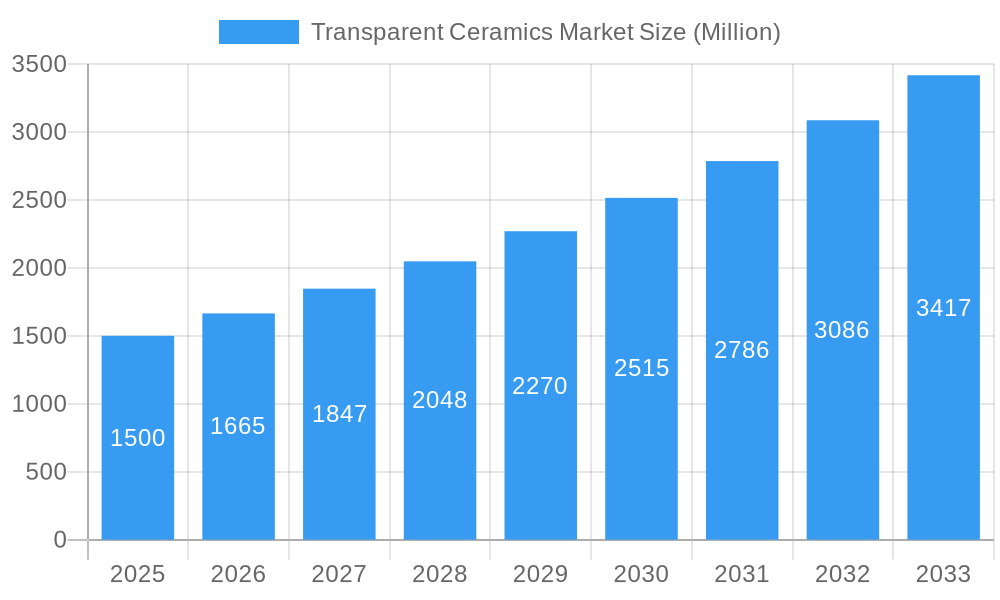
The transparent ceramics market is experiencing robust growth, projected to maintain a Compound Annual Growth Rate (CAGR) exceeding 11% from 2025 to 2033. This expansion is driven by increasing demand across diverse sectors, notably aerospace and defense, where high-performance optical components are crucial. The healthcare industry's adoption of transparent ceramics for advanced medical devices, coupled with growing applications in consumer goods (e.g., high-end displays) and the energy sector (e.g., high-power lasers), further fuels market expansion. Key material segments include sapphire, Yttrium Aluminum Garnet (YAG), and others, each catering to specific application needs. The crystalline structure segment currently holds a larger market share due to its superior optical properties and durability compared to non-crystalline counterparts. Significant regional growth is expected from Asia-Pacific, particularly China and India, driven by rapid industrialization and increasing investment in advanced technologies. However, challenges such as high manufacturing costs and the complexity of producing large, high-quality components could slightly temper the overall growth rate. Competition among established players like General Electric, Coorstek KK, and CeramTec GmbH, alongside emerging companies, is intensifying, pushing innovation and cost reduction strategies.
Transparent Ceramics Market Market Size (In Billion)
The market's future trajectory hinges on technological advancements focusing on enhanced material properties (e.g., improved transparency and durability), cost-effective manufacturing processes, and the expansion of applications in emerging fields such as augmented reality and 5G communication infrastructure. Companies are actively pursuing strategic partnerships and investments in R&D to capitalize on these opportunities. The development of specialized coatings and surface treatments to improve the performance and longevity of transparent ceramic components is another key area of innovation. Furthermore, stringent regulations regarding material safety and environmental impact are likely to influence market dynamics in the coming years, emphasizing the need for sustainable manufacturing practices within the industry. Considering the aforementioned factors, the transparent ceramics market is poised for significant expansion in the next decade.
Transparent Ceramics Market Company Market Share
Transparent Ceramics Market: A Comprehensive Report (2019-2033)
This in-depth report provides a comprehensive analysis of the Transparent Ceramics Market, offering valuable insights for stakeholders across the value chain. The study covers the period 2019-2033, with a focus on the forecast period 2025-2033 and a base year of 2025. The report leverages extensive primary and secondary research to deliver actionable intelligence on market dynamics, growth drivers, challenges, and emerging opportunities. Projected market values are presented in Millions (USD).
Transparent Ceramics Market Market Concentration & Innovation
The Transparent Ceramics market is characterized by a moderately concentrated structure, with a few dominant players holding substantial market influence. While specific market share data remains proprietary, industry leaders such as General Electric, Saint-Gobain Group, and SCHOTT AG are prominent, particularly in established sectors like Aerospace and Defense. Alongside these giants, a vibrant ecosystem of smaller, specialized companies contributes to the market by focusing on niche applications and pioneering material innovations.
Innovation is the lifeblood of this market. Continuous research and development efforts are dedicated to refining material properties, including enhancing transparency, increasing strength, and improving thermal stability, thereby unlocking new application frontiers. Regulatory landscapes, especially concerning safety and environmental standards, significantly shape material selection and manufacturing methodologies. The competitive pressure from substitute materials like advanced polymers and specialized glasses compels a perpetual drive for innovation to maintain a competitive edge. Furthermore, evolving end-user demands, particularly the pursuit of lighter, stronger, and more efficient materials in critical sectors such as aerospace and healthcare, are key stimulants for transparent ceramic adoption. Mergers and acquisitions (M&A) have been a moderate but strategic aspect of this market, with average deal values of approximately **[Insert Average M&A Deal Value]** Million per transaction observed between 2021 and 2024. These strategic moves are primarily aimed at broadening product portfolios, acquiring cutting-edge technologies, and expanding market reach.
- Key Metrics:
- Market Concentration (Herfindahl-Hirschman Index): [Insert HHI Value]
- Average M&A Deal Value (2021-2024): [Insert Average M&A Deal Value] Million
- Number of M&A Deals (2021-2024): [Insert Number of M&A Deals]
Transparent Ceramics Market Industry Trends & Insights
The Transparent Ceramics market is on a trajectory of robust expansion, with a projected Compound Annual Growth Rate (CAGR) of [Insert CAGR Percentage]% anticipated between 2025 and 2033. This significant growth is propelled by a confluence of factors. The increasing integration of transparent ceramics into high-growth sectors like aerospace and defense, driven by the imperative for lightweight yet high-strength components, is a primary catalyst. Concurrently, advancements in synthesis techniques and surface modification methods are substantially enhancing material performance and broadening the scope of potential applications. Consumer preferences for products that are both durable and aesthetically appealing are also contributing to market demand in segments such as consumer goods and healthcare. Competitive dynamics within the market are characterized by intense rivalry among established players, alongside the emergence of agile new entrants who are carving out niches through specialized applications or novel material development. Furthermore, growing market penetration in nascent applications, including energy (specifically solar cells) and advanced electronics, is a significant contributor to overall market expansion. The market penetration rate for transparent ceramics within the consumer electronics sector is conservatively estimated to reach [Insert Consumer Electronics Penetration Percentage]% by 2033.
Dominant Markets & Segments in Transparent Ceramics Market
The Aerospace and Defense segment represents the largest application area for transparent ceramics, accounting for approximately xx% of the market in 2025. This dominance is driven by the stringent requirements for high-strength, lightweight, and optically clear materials in aircraft windows, laser systems, and other defense applications. Geographically, North America and Europe currently hold the largest market shares due to high technological advancements, strong industrial base, and significant government investments in R&D. However, the Asia-Pacific region is projected to experience the fastest growth rate, driven by increasing industrialization, economic growth, and substantial investments in infrastructure projects.
Key Drivers for Dominance:
- Aerospace & Defense: High demand for lightweight and durable materials in aircraft, spacecraft, and defense systems.
- North America & Europe: Established technological infrastructure, strong R&D investments, and mature aerospace industries.
- Asia-Pacific: Rapid economic growth, expanding industrialization, and increasing infrastructure development.
Material Segment Dominance: Sapphire dominates the material segment, driven by its excellent transparency, hardness, and thermal conductivity. However, YAG and Aluminum Oxynitride are gaining traction in specific niche applications.
Transparent Ceramics Market Product Developments
Recent product innovations in the Transparent Ceramics market are heavily focused on the development of materials with superior attributes, such as enhanced impact resistance, a higher refractive index, and improved thermal stability. Exploration of novel applications is actively underway, spanning high-power lasers, sophisticated biomedical devices, and advanced optical systems. These advancements underscore the relentless pursuit of superior performance and the expansion of the application spectrum for these advanced materials. The introduction of more cost-effective manufacturing processes and refined surface finishing techniques has also played a pivotal role in accelerating market adoption and accessibility.
Report Scope & Segmentation Analysis
This report segments the Transparent Ceramics market by material (Sapphire, Yttrium Aluminum Garnet (YAG), Aluminum Oxynitride, Yttria-stabilized zirconia (YSZ), Spinel, Other Materials), application (Aerospace and Defense, Mechanical and Chemical, Healthcare, Consumer Goods, Energy, Other Applications), and structure (Crystalline, Non-crystalline). Each segment's market size, growth projections, and competitive landscape are analyzed in detail. For example, the Sapphire segment is expected to maintain strong growth due to its wide-ranging applications, while the YAG segment is projected to witness significant growth driven by its use in lasers and medical imaging. Similarly, the Aerospace and Defense application segment is predicted to dominate overall market value, followed by Healthcare and Mechanical & Chemical.
Key Drivers of Transparent Ceramics Market Growth
The growth trajectory of the Transparent Ceramics market is predominantly influenced by the escalating demand for high-performance materials across a wide array of applications. Technological breakthroughs, particularly in the development of novel synthesis and processing techniques, are instrumental in enhancing material properties and unlocking new application possibilities. Government regulations that promote the adoption of lighter, more energy-efficient materials in specific industries, such as the automotive sector, are further bolstering market expansion. Finally, the increasing integration of transparent ceramics in emerging technologies, including renewable energy solutions and advanced electronics, presents substantial and promising growth opportunities.
Challenges in the Transparent Ceramics Market Sector
The high cost of production and processing of transparent ceramics presents a major challenge. Supply chain disruptions and the limited availability of raw materials can also impact market growth. Intense competition from substitute materials and the need for specialized manufacturing equipment create further barriers. These factors constrain market penetration, particularly in price-sensitive applications.
Emerging Opportunities in Transparent Ceramics Market
Emerging opportunities lie in the development of new applications in advanced technologies like microelectronics, high-power lasers, and optoelectronics. The exploration of new materials with enhanced properties and the development of cost-effective manufacturing processes provide further growth potential. Expansion into emerging markets and strategic partnerships with end-users also offer significant opportunities.
Leading Players in the Transparent Ceramics Market Market
- General Electric
- Konoshima Chemicals Co Ltd
- Coorstek KK
- CeramTec GmbH
- II-VI Optical Systems
- Koninklijke Philips N V
- Surmet Corporation
- Saint-Gobain Group
- Cilas
- OptoCity (www.optocity.com)
- CeraNova
- Deisenroth Engineering GmbH
- AGC Inc
- SCHOTT AG
Key Developments in Transparent Ceramics Market Industry
- 2022-Q4: SCHOTT AG announced a new production facility for high-quality sapphire crystals.
- 2023-Q1: General Electric partnered with a leading materials research institute to develop advanced ceramic composites.
- 2023-Q3: II-VI Optical Systems launched a new line of transparent ceramic lenses for high-power laser applications. (Further details require specific company news release information)
Strategic Outlook for Transparent Ceramics Market Market
The Transparent Ceramics market is poised for continued growth, driven by technological advancements, expanding applications, and increasing investments in R&D. The focus on developing innovative materials with enhanced performance characteristics and cost-effective manufacturing processes will be crucial for future market success. Strategic partnerships and collaborations between material suppliers and end-users will also play a key role in driving market expansion. The market's growth trajectory is expected to remain positive throughout the forecast period, fueled by sustained demand across diverse industries.
Transparent Ceramics Market Segmentation
-
1. Structure
- 1.1. Crystalline
- 1.2. Non-crystalline
-
2. Material
- 2.1. Sapphire
- 2.2. Yttrium Aluminum Garnet (YAG)
- 2.3. Aluminum Oxynitride
- 2.4. Yttria-stabilized zirconia (YSZ)
- 2.5. Spinel
- 2.6. Other Materials
-
3. Application
- 3.1. Aerospace and Defense
- 3.2. Mechanical and Chemical
- 3.3. Healthcare
- 3.4. Consumer Goods
- 3.5. Energy
- 3.6. Other Applications
Transparent Ceramics Market Segmentation By Geography
-
1. Asia Pacific
- 1.1. China
- 1.2. India
- 1.3. Japan
- 1.4. South Korea
- 1.5. Australia
- 2. Rest of Asia Pacific
-
3. North America
- 3.1. United States
- 3.2. Canada
- 3.3. Mexico
- 3.4. Rest of North America
-
4. Europe
- 4.1. Germany
- 4.2. United Kingdom
- 4.3. Italy
- 4.4. France
- 4.5. Rest of Europe
-
5. South America
- 5.1. Brazil
- 5.2. Argentina
- 5.3. Rest of South America
-
6. Middle East and Africa
- 6.1. Saudi Arabia
- 6.2. South Africa
- 6.3. Rest of Middle East and Africa
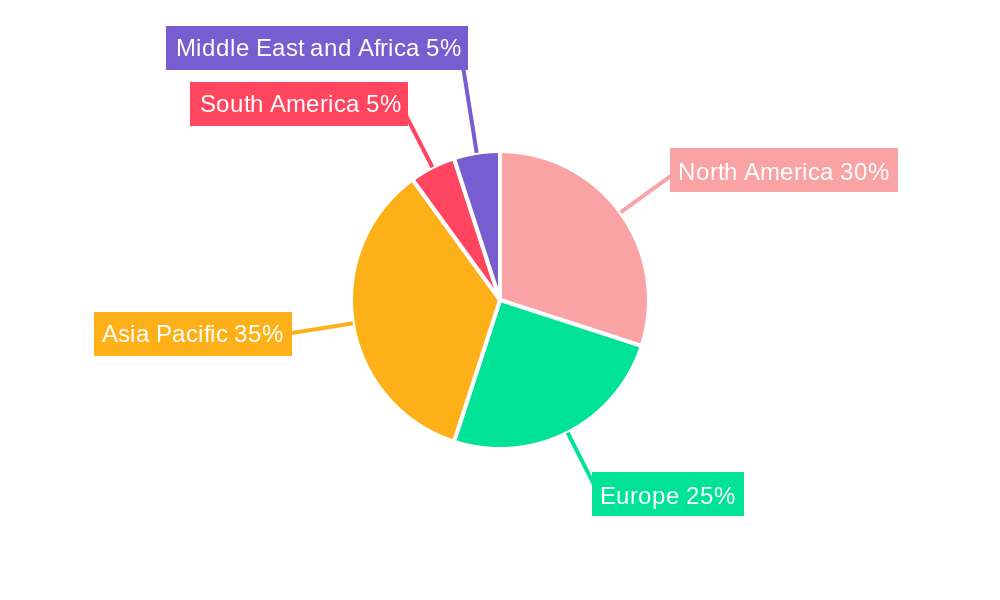
Transparent Ceramics Market Regional Market Share
Geographic Coverage of Transparent Ceramics Market
Transparent Ceramics Market REPORT HIGHLIGHTS
| Aspects | Details |
|---|---|
| Study Period | 2020-2034 |
| Base Year | 2025 |
| Estimated Year | 2026 |
| Forecast Period | 2026-2034 |
| Historical Period | 2020-2025 |
| Growth Rate | CAGR of 17.6% from 2020-2034 |
| Segmentation |
|
Table of Contents
- 1. Introduction
- 1.1. Research Scope
- 1.2. Market Segmentation
- 1.3. Research Objective
- 1.4. Definitions and Assumptions
- 2. Executive Summary
- 2.1. Market Snapshot
- 3. Market Dynamics
- 3.1. Market Drivers
- 3.2. Market Restrains
- 3.3. Market Trends
- 3.4. Market Opportunities
- 4. Market Factor Analysis
- 4.1. Porters Five Forces
- 4.1.1. Bargaining Power of Suppliers
- 4.1.2. Bargaining Power of Buyers
- 4.1.3. Threat of New Entrants
- 4.1.4. Threat of Substitutes
- 4.1.5. Competitive Rivalry
- 4.2. PESTEL analysis
- 4.3. BCG Analysis
- 4.3.1. Stars (High Growth, High Market Share)
- 4.3.2. Cash Cows (Low Growth, High Market Share)
- 4.3.3. Question Mark (High Growth, Low Market Share)
- 4.3.4. Dogs (Low Growth, Low Market Share)
- 4.4. Ansoff Matrix Analysis
- 4.5. Supply Chain Analysis
- 4.6. Regulatory Landscape
- 4.7. Current Market Potential and Opportunity Assessment (TAM–SAM–SOM Framework)
- 4.8. RAX Analyst Note
- 4.1. Porters Five Forces
- 5. Market Analysis, Insights and Forecast 2021-2033
- 5.1. Market Analysis, Insights and Forecast - by Structure
- 5.1.1. Crystalline
- 5.1.2. Non-crystalline
- 5.2. Market Analysis, Insights and Forecast - by Material
- 5.2.1. Sapphire
- 5.2.2. Yttrium Aluminum Garnet (YAG)
- 5.2.3. Aluminum Oxynitride
- 5.2.4. Yttria-stabilized zirconia (YSZ)
- 5.2.5. Spinel
- 5.2.6. Other Materials
- 5.3. Market Analysis, Insights and Forecast - by Application
- 5.3.1. Aerospace and Defense
- 5.3.2. Mechanical and Chemical
- 5.3.3. Healthcare
- 5.3.4. Consumer Goods
- 5.3.5. Energy
- 5.3.6. Other Applications
- 5.4. Market Analysis, Insights and Forecast - by Region
- 5.4.1. Asia Pacific
- 5.4.2. Rest of Asia Pacific
- 5.4.3. North America
- 5.4.4. Europe
- 5.4.5. South America
- 5.4.6. Middle East and Africa
- 5.1. Market Analysis, Insights and Forecast - by Structure
- 6. Global Transparent Ceramics Market Analysis, Insights and Forecast, 2021-2033
- 6.1. Market Analysis, Insights and Forecast - by Structure
- 6.1.1. Crystalline
- 6.1.2. Non-crystalline
- 6.2. Market Analysis, Insights and Forecast - by Material
- 6.2.1. Sapphire
- 6.2.2. Yttrium Aluminum Garnet (YAG)
- 6.2.3. Aluminum Oxynitride
- 6.2.4. Yttria-stabilized zirconia (YSZ)
- 6.2.5. Spinel
- 6.2.6. Other Materials
- 6.3. Market Analysis, Insights and Forecast - by Application
- 6.3.1. Aerospace and Defense
- 6.3.2. Mechanical and Chemical
- 6.3.3. Healthcare
- 6.3.4. Consumer Goods
- 6.3.5. Energy
- 6.3.6. Other Applications
- 6.1. Market Analysis, Insights and Forecast - by Structure
- 7. Asia Pacific Transparent Ceramics Market Analysis, Insights and Forecast, 2020-2032
- 7.1. Market Analysis, Insights and Forecast - by Structure
- 7.1.1. Crystalline
- 7.1.2. Non-crystalline
- 7.2. Market Analysis, Insights and Forecast - by Material
- 7.2.1. Sapphire
- 7.2.2. Yttrium Aluminum Garnet (YAG)
- 7.2.3. Aluminum Oxynitride
- 7.2.4. Yttria-stabilized zirconia (YSZ)
- 7.2.5. Spinel
- 7.2.6. Other Materials
- 7.3. Market Analysis, Insights and Forecast - by Application
- 7.3.1. Aerospace and Defense
- 7.3.2. Mechanical and Chemical
- 7.3.3. Healthcare
- 7.3.4. Consumer Goods
- 7.3.5. Energy
- 7.3.6. Other Applications
- 7.1. Market Analysis, Insights and Forecast - by Structure
- 8. Rest of Asia Pacific Transparent Ceramics Market Analysis, Insights and Forecast, 2020-2032
- 8.1. Market Analysis, Insights and Forecast - by Structure
- 8.1.1. Crystalline
- 8.1.2. Non-crystalline
- 8.2. Market Analysis, Insights and Forecast - by Material
- 8.2.1. Sapphire
- 8.2.2. Yttrium Aluminum Garnet (YAG)
- 8.2.3. Aluminum Oxynitride
- 8.2.4. Yttria-stabilized zirconia (YSZ)
- 8.2.5. Spinel
- 8.2.6. Other Materials
- 8.3. Market Analysis, Insights and Forecast - by Application
- 8.3.1. Aerospace and Defense
- 8.3.2. Mechanical and Chemical
- 8.3.3. Healthcare
- 8.3.4. Consumer Goods
- 8.3.5. Energy
- 8.3.6. Other Applications
- 8.1. Market Analysis, Insights and Forecast - by Structure
- 9. North America Transparent Ceramics Market Analysis, Insights and Forecast, 2020-2032
- 9.1. Market Analysis, Insights and Forecast - by Structure
- 9.1.1. Crystalline
- 9.1.2. Non-crystalline
- 9.2. Market Analysis, Insights and Forecast - by Material
- 9.2.1. Sapphire
- 9.2.2. Yttrium Aluminum Garnet (YAG)
- 9.2.3. Aluminum Oxynitride
- 9.2.4. Yttria-stabilized zirconia (YSZ)
- 9.2.5. Spinel
- 9.2.6. Other Materials
- 9.3. Market Analysis, Insights and Forecast - by Application
- 9.3.1. Aerospace and Defense
- 9.3.2. Mechanical and Chemical
- 9.3.3. Healthcare
- 9.3.4. Consumer Goods
- 9.3.5. Energy
- 9.3.6. Other Applications
- 9.1. Market Analysis, Insights and Forecast - by Structure
- 10. Europe Transparent Ceramics Market Analysis, Insights and Forecast, 2020-2032
- 10.1. Market Analysis, Insights and Forecast - by Structure
- 10.1.1. Crystalline
- 10.1.2. Non-crystalline
- 10.2. Market Analysis, Insights and Forecast - by Material
- 10.2.1. Sapphire
- 10.2.2. Yttrium Aluminum Garnet (YAG)
- 10.2.3. Aluminum Oxynitride
- 10.2.4. Yttria-stabilized zirconia (YSZ)
- 10.2.5. Spinel
- 10.2.6. Other Materials
- 10.3. Market Analysis, Insights and Forecast - by Application
- 10.3.1. Aerospace and Defense
- 10.3.2. Mechanical and Chemical
- 10.3.3. Healthcare
- 10.3.4. Consumer Goods
- 10.3.5. Energy
- 10.3.6. Other Applications
- 10.1. Market Analysis, Insights and Forecast - by Structure
- 11. South America Transparent Ceramics Market Analysis, Insights and Forecast, 2020-2032
- 11.1. Market Analysis, Insights and Forecast - by Structure
- 11.1.1. Crystalline
- 11.1.2. Non-crystalline
- 11.2. Market Analysis, Insights and Forecast - by Material
- 11.2.1. Sapphire
- 11.2.2. Yttrium Aluminum Garnet (YAG)
- 11.2.3. Aluminum Oxynitride
- 11.2.4. Yttria-stabilized zirconia (YSZ)
- 11.2.5. Spinel
- 11.2.6. Other Materials
- 11.3. Market Analysis, Insights and Forecast - by Application
- 11.3.1. Aerospace and Defense
- 11.3.2. Mechanical and Chemical
- 11.3.3. Healthcare
- 11.3.4. Consumer Goods
- 11.3.5. Energy
- 11.3.6. Other Applications
- 11.1. Market Analysis, Insights and Forecast - by Structure
- 12. Middle East and Africa Transparent Ceramics Market Analysis, Insights and Forecast, 2020-2032
- 12.1. Market Analysis, Insights and Forecast - by Structure
- 12.1.1. Crystalline
- 12.1.2. Non-crystalline
- 12.2. Market Analysis, Insights and Forecast - by Material
- 12.2.1. Sapphire
- 12.2.2. Yttrium Aluminum Garnet (YAG)
- 12.2.3. Aluminum Oxynitride
- 12.2.4. Yttria-stabilized zirconia (YSZ)
- 12.2.5. Spinel
- 12.2.6. Other Materials
- 12.3. Market Analysis, Insights and Forecast - by Application
- 12.3.1. Aerospace and Defense
- 12.3.2. Mechanical and Chemical
- 12.3.3. Healthcare
- 12.3.4. Consumer Goods
- 12.3.5. Energy
- 12.3.6. Other Applications
- 12.1. Market Analysis, Insights and Forecast - by Structure
- 13. Competitive Analysis
- 13.1. Company Profiles
- 13.1.1 General Electric
- 13.1.1.1. Company Overview
- 13.1.1.2. Products
- 13.1.1.3. Company Financials
- 13.1.1.4. SWOT Analysis
- 13.1.2 Konoshima Chemicals Co Ltd
- 13.1.2.1. Company Overview
- 13.1.2.2. Products
- 13.1.2.3. Company Financials
- 13.1.2.4. SWOT Analysis
- 13.1.3 Coorstek KK
- 13.1.3.1. Company Overview
- 13.1.3.2. Products
- 13.1.3.3. Company Financials
- 13.1.3.4. SWOT Analysis
- 13.1.4 CeramTec GmbH
- 13.1.4.1. Company Overview
- 13.1.4.2. Products
- 13.1.4.3. Company Financials
- 13.1.4.4. SWOT Analysis
- 13.1.5 II-VI Optical Systems
- 13.1.5.1. Company Overview
- 13.1.5.2. Products
- 13.1.5.3. Company Financials
- 13.1.5.4. SWOT Analysis
- 13.1.6 Koninklijke Philips N V
- 13.1.6.1. Company Overview
- 13.1.6.2. Products
- 13.1.6.3. Company Financials
- 13.1.6.4. SWOT Analysis
- 13.1.7 Surmet Corporation*List Not Exhaustive
- 13.1.7.1. Company Overview
- 13.1.7.2. Products
- 13.1.7.3. Company Financials
- 13.1.7.4. SWOT Analysis
- 13.1.8 Saint-Gobain Group
- 13.1.8.1. Company Overview
- 13.1.8.2. Products
- 13.1.8.3. Company Financials
- 13.1.8.4. SWOT Analysis
- 13.1.9 Cilas
- 13.1.9.1. Company Overview
- 13.1.9.2. Products
- 13.1.9.3. Company Financials
- 13.1.9.4. SWOT Analysis
- 13.1.10 www optocity com
- 13.1.10.1. Company Overview
- 13.1.10.2. Products
- 13.1.10.3. Company Financials
- 13.1.10.4. SWOT Analysis
- 13.1.11 CeraNova
- 13.1.11.1. Company Overview
- 13.1.11.2. Products
- 13.1.11.3. Company Financials
- 13.1.11.4. SWOT Analysis
- 13.1.12 Deisenroth Engineering GmbH
- 13.1.12.1. Company Overview
- 13.1.12.2. Products
- 13.1.12.3. Company Financials
- 13.1.12.4. SWOT Analysis
- 13.1.13 AGC Inc
- 13.1.13.1. Company Overview
- 13.1.13.2. Products
- 13.1.13.3. Company Financials
- 13.1.13.4. SWOT Analysis
- 13.1.14 SCHOTT AG
- 13.1.14.1. Company Overview
- 13.1.14.2. Products
- 13.1.14.3. Company Financials
- 13.1.14.4. SWOT Analysis
- 13.1.1 General Electric
- 13.2. Market Entropy
- 13.2.1 Company's Key Areas Served
- 13.2.2 Recent Developments
- 13.3. Company Market Share Analysis 2025
- 13.3.1 Top 5 Companies Market Share Analysis
- 13.3.2 Top 3 Companies Market Share Analysis
- 13.4. List of Potential Customers
- 14. Research Methodology
List of Figures
- Figure 1: Global Transparent Ceramics Market Revenue Breakdown (million, %) by Region 2025 & 2033
- Figure 2: Asia Pacific Transparent Ceramics Market Revenue (million), by Structure 2025 & 2033
- Figure 3: Asia Pacific Transparent Ceramics Market Revenue Share (%), by Structure 2025 & 2033
- Figure 4: Asia Pacific Transparent Ceramics Market Revenue (million), by Material 2025 & 2033
- Figure 5: Asia Pacific Transparent Ceramics Market Revenue Share (%), by Material 2025 & 2033
- Figure 6: Asia Pacific Transparent Ceramics Market Revenue (million), by Application 2025 & 2033
- Figure 7: Asia Pacific Transparent Ceramics Market Revenue Share (%), by Application 2025 & 2033
- Figure 8: Asia Pacific Transparent Ceramics Market Revenue (million), by Country 2025 & 2033
- Figure 9: Asia Pacific Transparent Ceramics Market Revenue Share (%), by Country 2025 & 2033
- Figure 10: Rest of Asia Pacific Transparent Ceramics Market Revenue (million), by Structure 2025 & 2033
- Figure 11: Rest of Asia Pacific Transparent Ceramics Market Revenue Share (%), by Structure 2025 & 2033
- Figure 12: Rest of Asia Pacific Transparent Ceramics Market Revenue (million), by Material 2025 & 2033
- Figure 13: Rest of Asia Pacific Transparent Ceramics Market Revenue Share (%), by Material 2025 & 2033
- Figure 14: Rest of Asia Pacific Transparent Ceramics Market Revenue (million), by Application 2025 & 2033
- Figure 15: Rest of Asia Pacific Transparent Ceramics Market Revenue Share (%), by Application 2025 & 2033
- Figure 16: Rest of Asia Pacific Transparent Ceramics Market Revenue (million), by Country 2025 & 2033
- Figure 17: Rest of Asia Pacific Transparent Ceramics Market Revenue Share (%), by Country 2025 & 2033
- Figure 18: North America Transparent Ceramics Market Revenue (million), by Structure 2025 & 2033
- Figure 19: North America Transparent Ceramics Market Revenue Share (%), by Structure 2025 & 2033
- Figure 20: North America Transparent Ceramics Market Revenue (million), by Material 2025 & 2033
- Figure 21: North America Transparent Ceramics Market Revenue Share (%), by Material 2025 & 2033
- Figure 22: North America Transparent Ceramics Market Revenue (million), by Application 2025 & 2033
- Figure 23: North America Transparent Ceramics Market Revenue Share (%), by Application 2025 & 2033
- Figure 24: North America Transparent Ceramics Market Revenue (million), by Country 2025 & 2033
- Figure 25: North America Transparent Ceramics Market Revenue Share (%), by Country 2025 & 2033
- Figure 26: Europe Transparent Ceramics Market Revenue (million), by Structure 2025 & 2033
- Figure 27: Europe Transparent Ceramics Market Revenue Share (%), by Structure 2025 & 2033
- Figure 28: Europe Transparent Ceramics Market Revenue (million), by Material 2025 & 2033
- Figure 29: Europe Transparent Ceramics Market Revenue Share (%), by Material 2025 & 2033
- Figure 30: Europe Transparent Ceramics Market Revenue (million), by Application 2025 & 2033
- Figure 31: Europe Transparent Ceramics Market Revenue Share (%), by Application 2025 & 2033
- Figure 32: Europe Transparent Ceramics Market Revenue (million), by Country 2025 & 2033
- Figure 33: Europe Transparent Ceramics Market Revenue Share (%), by Country 2025 & 2033
- Figure 34: South America Transparent Ceramics Market Revenue (million), by Structure 2025 & 2033
- Figure 35: South America Transparent Ceramics Market Revenue Share (%), by Structure 2025 & 2033
- Figure 36: South America Transparent Ceramics Market Revenue (million), by Material 2025 & 2033
- Figure 37: South America Transparent Ceramics Market Revenue Share (%), by Material 2025 & 2033
- Figure 38: South America Transparent Ceramics Market Revenue (million), by Application 2025 & 2033
- Figure 39: South America Transparent Ceramics Market Revenue Share (%), by Application 2025 & 2033
- Figure 40: South America Transparent Ceramics Market Revenue (million), by Country 2025 & 2033
- Figure 41: South America Transparent Ceramics Market Revenue Share (%), by Country 2025 & 2033
- Figure 42: Middle East and Africa Transparent Ceramics Market Revenue (million), by Structure 2025 & 2033
- Figure 43: Middle East and Africa Transparent Ceramics Market Revenue Share (%), by Structure 2025 & 2033
- Figure 44: Middle East and Africa Transparent Ceramics Market Revenue (million), by Material 2025 & 2033
- Figure 45: Middle East and Africa Transparent Ceramics Market Revenue Share (%), by Material 2025 & 2033
- Figure 46: Middle East and Africa Transparent Ceramics Market Revenue (million), by Application 2025 & 2033
- Figure 47: Middle East and Africa Transparent Ceramics Market Revenue Share (%), by Application 2025 & 2033
- Figure 48: Middle East and Africa Transparent Ceramics Market Revenue (million), by Country 2025 & 2033
- Figure 49: Middle East and Africa Transparent Ceramics Market Revenue Share (%), by Country 2025 & 2033
List of Tables
- Table 1: Global Transparent Ceramics Market Revenue million Forecast, by Structure 2020 & 2033
- Table 2: Global Transparent Ceramics Market Revenue million Forecast, by Material 2020 & 2033
- Table 3: Global Transparent Ceramics Market Revenue million Forecast, by Application 2020 & 2033
- Table 4: Global Transparent Ceramics Market Revenue million Forecast, by Region 2020 & 2033
- Table 5: Global Transparent Ceramics Market Revenue million Forecast, by Structure 2020 & 2033
- Table 6: Global Transparent Ceramics Market Revenue million Forecast, by Material 2020 & 2033
- Table 7: Global Transparent Ceramics Market Revenue million Forecast, by Application 2020 & 2033
- Table 8: Global Transparent Ceramics Market Revenue million Forecast, by Country 2020 & 2033
- Table 9: China Transparent Ceramics Market Revenue (million) Forecast, by Application 2020 & 2033
- Table 10: India Transparent Ceramics Market Revenue (million) Forecast, by Application 2020 & 2033
- Table 11: Japan Transparent Ceramics Market Revenue (million) Forecast, by Application 2020 & 2033
- Table 12: South Korea Transparent Ceramics Market Revenue (million) Forecast, by Application 2020 & 2033
- Table 13: Australia Transparent Ceramics Market Revenue (million) Forecast, by Application 2020 & 2033
- Table 14: Global Transparent Ceramics Market Revenue million Forecast, by Structure 2020 & 2033
- Table 15: Global Transparent Ceramics Market Revenue million Forecast, by Material 2020 & 2033
- Table 16: Global Transparent Ceramics Market Revenue million Forecast, by Application 2020 & 2033
- Table 17: Global Transparent Ceramics Market Revenue million Forecast, by Country 2020 & 2033
- Table 18: Global Transparent Ceramics Market Revenue million Forecast, by Structure 2020 & 2033
- Table 19: Global Transparent Ceramics Market Revenue million Forecast, by Material 2020 & 2033
- Table 20: Global Transparent Ceramics Market Revenue million Forecast, by Application 2020 & 2033
- Table 21: Global Transparent Ceramics Market Revenue million Forecast, by Country 2020 & 2033
- Table 22: United States Transparent Ceramics Market Revenue (million) Forecast, by Application 2020 & 2033
- Table 23: Canada Transparent Ceramics Market Revenue (million) Forecast, by Application 2020 & 2033
- Table 24: Mexico Transparent Ceramics Market Revenue (million) Forecast, by Application 2020 & 2033
- Table 25: Rest of North America Transparent Ceramics Market Revenue (million) Forecast, by Application 2020 & 2033
- Table 26: Global Transparent Ceramics Market Revenue million Forecast, by Structure 2020 & 2033
- Table 27: Global Transparent Ceramics Market Revenue million Forecast, by Material 2020 & 2033
- Table 28: Global Transparent Ceramics Market Revenue million Forecast, by Application 2020 & 2033
- Table 29: Global Transparent Ceramics Market Revenue million Forecast, by Country 2020 & 2033
- Table 30: Germany Transparent Ceramics Market Revenue (million) Forecast, by Application 2020 & 2033
- Table 31: United Kingdom Transparent Ceramics Market Revenue (million) Forecast, by Application 2020 & 2033
- Table 32: Italy Transparent Ceramics Market Revenue (million) Forecast, by Application 2020 & 2033
- Table 33: France Transparent Ceramics Market Revenue (million) Forecast, by Application 2020 & 2033
- Table 34: Rest of Europe Transparent Ceramics Market Revenue (million) Forecast, by Application 2020 & 2033
- Table 35: Global Transparent Ceramics Market Revenue million Forecast, by Structure 2020 & 2033
- Table 36: Global Transparent Ceramics Market Revenue million Forecast, by Material 2020 & 2033
- Table 37: Global Transparent Ceramics Market Revenue million Forecast, by Application 2020 & 2033
- Table 38: Global Transparent Ceramics Market Revenue million Forecast, by Country 2020 & 2033
- Table 39: Brazil Transparent Ceramics Market Revenue (million) Forecast, by Application 2020 & 2033
- Table 40: Argentina Transparent Ceramics Market Revenue (million) Forecast, by Application 2020 & 2033
- Table 41: Rest of South America Transparent Ceramics Market Revenue (million) Forecast, by Application 2020 & 2033
- Table 42: Global Transparent Ceramics Market Revenue million Forecast, by Structure 2020 & 2033
- Table 43: Global Transparent Ceramics Market Revenue million Forecast, by Material 2020 & 2033
- Table 44: Global Transparent Ceramics Market Revenue million Forecast, by Application 2020 & 2033
- Table 45: Global Transparent Ceramics Market Revenue million Forecast, by Country 2020 & 2033
- Table 46: Saudi Arabia Transparent Ceramics Market Revenue (million) Forecast, by Application 2020 & 2033
- Table 47: South Africa Transparent Ceramics Market Revenue (million) Forecast, by Application 2020 & 2033
- Table 48: Rest of Middle East and Africa Transparent Ceramics Market Revenue (million) Forecast, by Application 2020 & 2033
Frequently Asked Questions
1. What is the projected Compound Annual Growth Rate (CAGR) of the Transparent Ceramics Market?
The projected CAGR is approximately 17.6%.
2. Which companies are prominent players in the Transparent Ceramics Market?
Key companies in the market include General Electric, Konoshima Chemicals Co Ltd, Coorstek KK, CeramTec GmbH, II-VI Optical Systems, Koninklijke Philips N V, Surmet Corporation*List Not Exhaustive, Saint-Gobain Group, Cilas, www optocity com, CeraNova, Deisenroth Engineering GmbH, AGC Inc, SCHOTT AG.
3. What are the main segments of the Transparent Ceramics Market?
The market segments include Structure, Material, Application.
4. Can you provide details about the market size?
The market size is estimated to be USD 782.62 million as of 2022.
5. What are some drivers contributing to market growth?
; Accelerating Usage in Optics and Optoelectronics; Increasing Demand in the Aerospace and Defense Sector; Advanced Ceramics Increasingly Replacing Plastics and Metals.
6. What are the notable trends driving market growth?
Increasing Demand from the Aerospace and Defense Sector.
7. Are there any restraints impacting market growth?
; High Cost; Other Restraints.
8. Can you provide examples of recent developments in the market?
N/A
9. What pricing options are available for accessing the report?
Pricing options include single-user, multi-user, and enterprise licenses priced at USD 4750, USD 5250, and USD 8750 respectively.
10. Is the market size provided in terms of value or volume?
The market size is provided in terms of value, measured in million.
11. Are there any specific market keywords associated with the report?
Yes, the market keyword associated with the report is "Transparent Ceramics Market," which aids in identifying and referencing the specific market segment covered.
12. How do I determine which pricing option suits my needs best?
The pricing options vary based on user requirements and access needs. Individual users may opt for single-user licenses, while businesses requiring broader access may choose multi-user or enterprise licenses for cost-effective access to the report.
13. Are there any additional resources or data provided in the Transparent Ceramics Market report?
While the report offers comprehensive insights, it's advisable to review the specific contents or supplementary materials provided to ascertain if additional resources or data are available.
14. How can I stay updated on further developments or reports in the Transparent Ceramics Market?
To stay informed about further developments, trends, and reports in the Transparent Ceramics Market, consider subscribing to industry newsletters, following relevant companies and organizations, or regularly checking reputable industry news sources and publications.
Methodology
Step 1 - Identification of Relevant Samples Size from Population Database


Step 2 - Approaches for Defining Global Market Size (Value, Volume* & Price*)

Note*: In applicable scenarios
Step 3 - Data Sources
Primary Research
- Web Analytics
- Survey Reports
- Research Institute
- Latest Research Reports
- Opinion Leaders
Secondary Research
- Annual Reports
- White Paper
- Latest Press Release
- Industry Association
- Paid Database
- Investor Presentations

Step 4 - Data Triangulation
Involves using different sources of information in order to increase the validity of a study
These sources are likely to be stakeholders in a program - participants, other researchers, program staff, other community members, and so on.
Then we put all data in single framework & apply various statistical tools to find out the dynamic on the market.
During the analysis stage, feedback from the stakeholder groups would be compared to determine areas of agreement as well as areas of divergence