
Key Insights
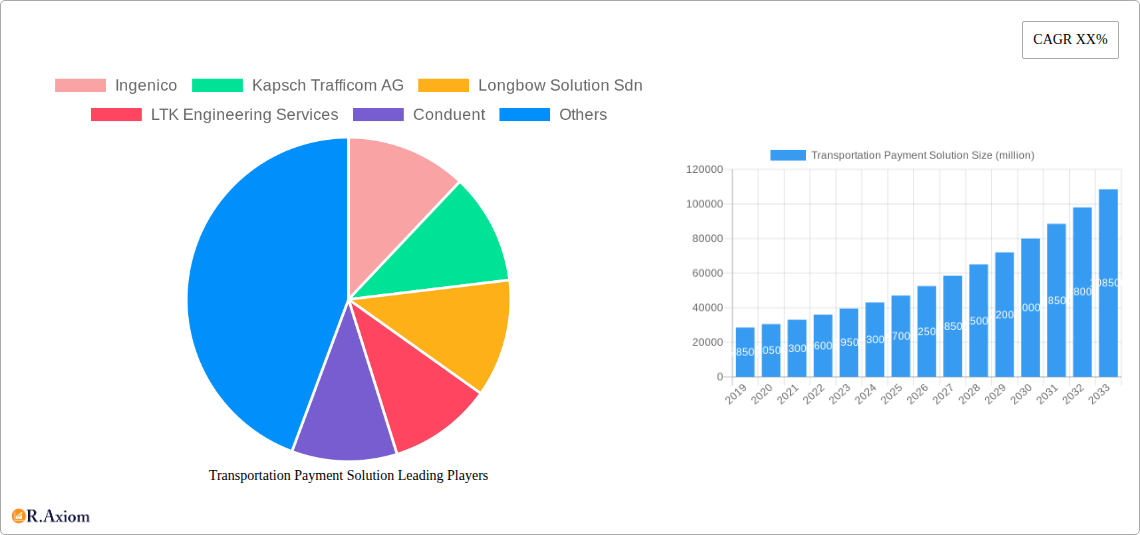
The global Transportation Payment Solution market is projected for substantial growth, estimated to reach approximately \$55,000 million by 2025, and is expected to expand at a Compound Annual Growth Rate (CAGR) of around 12% from 2025 to 2033. This robust expansion is primarily fueled by the increasing demand for seamless and efficient payment systems across various transportation modes, including public transit, ride-sharing, and tolling. Key drivers include the ongoing digitalization of payment infrastructures, the proliferation of smart city initiatives, and the growing adoption of contactless payment technologies like NFC and QR codes. Governments worldwide are also actively promoting the implementation of integrated fare collection systems to enhance commuter experience and optimize traffic management. The market is witnessing a significant shift towards software-based solutions that offer enhanced flexibility, scalability, and data analytics capabilities, complementing the essential hardware components like payment terminals and readers.
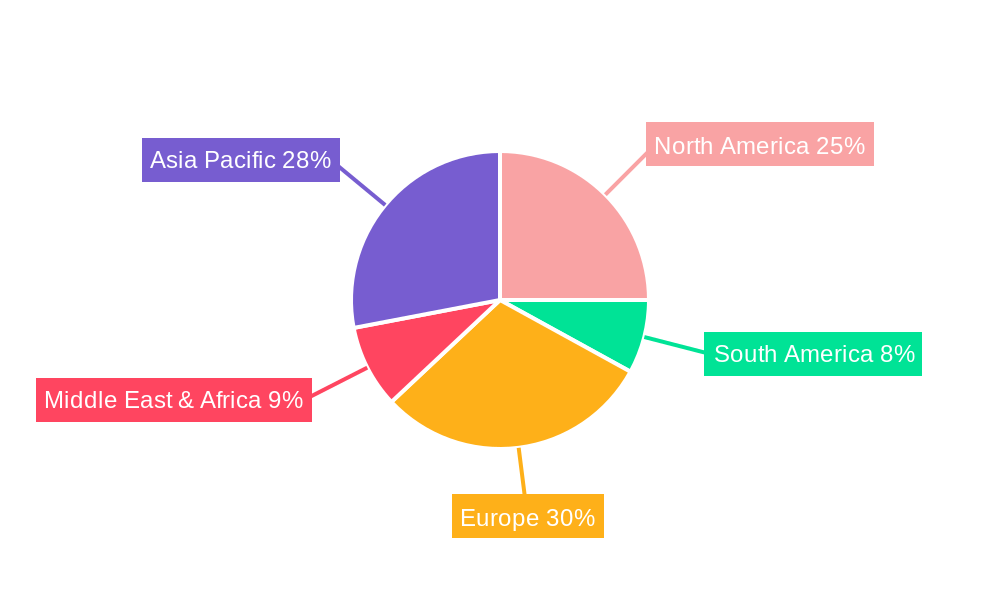
The market segmentation reveals a dynamic landscape, with the "Bus" and "Car Rental" applications expected to dominate revenue streams due to their widespread use and the increasing integration of digital payment options. In terms of types, both hardware and software segments are crucial, with software solutions gaining prominence due to their ability to support advanced features such as real-time transaction processing, fraud detection, and personalized user experiences. Geographically, Asia Pacific, led by China and India, is anticipated to emerge as the fastest-growing region, driven by rapid urbanization, a burgeoning middle class, and significant investments in public transportation infrastructure. Europe and North America will continue to be major markets, characterized by mature adoption of advanced payment technologies and stringent regulations promoting secure and efficient transit payment. Emerging economies in South America and the Middle East & Africa also present significant growth opportunities as they modernize their transportation payment systems. However, challenges such as the high initial investment cost for infrastructure upgrades and concerns regarding data security and privacy could pose some restraints to the market's full potential.
Transportation Payment Solution Market Concentration & Innovation
The global Transportation Payment Solution market is characterized by a moderate to high concentration, driven by significant investments in intelligent transportation systems (ITS) and the increasing adoption of cashless payment methods. Key players like Cubic Corporation, Conduent, and Kapsch Trafficom AG dominate substantial market shares, estimated to be in the range of 150 million to 200 million each, reflecting ongoing consolidation and strategic partnerships. Innovation in this sector is primarily fueled by the demand for seamless, secure, and integrated payment experiences across various transportation modalities. This includes advancements in contactless technology, mobile payment integration, and data analytics for personalized services. Regulatory frameworks, particularly concerning data privacy and interoperability, play a crucial role in shaping the market landscape, influencing product development and go-to-market strategies. The increasing focus on sustainability and efficiency in public transportation further stimulates innovation. Product substitutes, such as traditional cash payments and fragmented ticketing systems, are rapidly being phased out in favor of advanced digital solutions. End-user trends reveal a strong preference for convenience, speed, and value-added services, pushing solution providers to develop user-friendly interfaces and loyalty programs. Mergers and acquisitions (M&A) are prevalent, with deal values frequently exceeding 50 million to 100 million, as larger entities acquire specialized technology firms or expand their geographic reach. For instance, acquisitions aimed at bolstering software capabilities or expanding into new application segments like ride-sharing payment integration are common.
Transportation Payment Solution Industry Trends & Insights
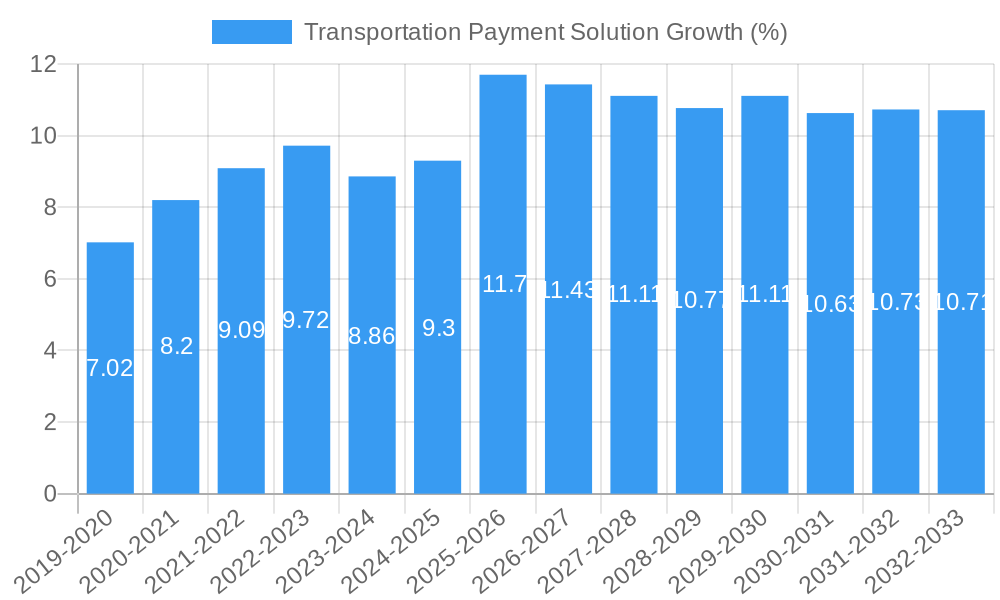
The global Transportation Payment Solution market is poised for robust growth, projecting a Compound Annual Growth Rate (CAGR) of approximately 12.5% over the forecast period of 2025–2033. This impressive expansion is underpinned by a confluence of technological advancements, evolving consumer preferences, and supportive governmental initiatives aimed at modernizing urban mobility. The base year of 2025 witnessed a market valuation estimated at 25 billion, with expectations to reach over 65 billion by 2033. A primary growth driver is the pervasive shift towards cashless transactions across all modes of transport. From daily commutes on buses and trains to car rentals and toll payments, consumers are increasingly demanding convenient and secure digital payment options. This trend is further amplified by the proliferation of smartphones and the widespread adoption of mobile payment applications, which have become indispensable tools for modern life. Technological disruptions are at the forefront of this market evolution. The integration of Artificial Intelligence (AI) and Machine Learning (ML) is enabling more sophisticated fraud detection, personalized fare structures, and predictive analytics for traffic management. Furthermore, the adoption of Internet of Things (IoT) devices, such as smart sensors and connected vehicles, is facilitating real-time data collection and enabling seamless payment processes without manual intervention. The rise of open-loop payment systems, allowing users to pay with their existing credit or debit cards, is democratizing access to public transportation and reducing the reliance on proprietary ticketing systems. Consumer preferences are increasingly dictating the direction of innovation. Users expect integrated payment solutions that work across different transportation services, providing a unified experience and eliminating the need for multiple apps or cards. This demand for convenience and interoperability is spurring the development of multimodal payment platforms. The competitive dynamics within the industry are intensifying, with established players and emerging startups vying for market share. Companies are focusing on enhancing user experience, ensuring robust security protocols, and offering competitive pricing models to attract and retain customers. The increasing focus on sustainability also presents an opportunity, as efficient payment systems can encourage the use of public transport over private vehicles. The market penetration of advanced transportation payment solutions is still relatively low in many developing economies, offering significant untapped potential for growth and expansion. The historical period of 2019–2024 saw steady growth, laying the foundation for the accelerated expansion projected in the coming years.
Dominant Markets & Segments in Transportation Payment Solution
The Transportation Payment Solution market exhibits significant regional dominance, with North America and Europe currently leading the pack, driven by well-established infrastructure, high disposable incomes, and early adoption of digital technologies. Within these regions, urban centers and metropolitan areas represent the most lucrative markets due to higher population density and extensive public transportation networks. The Toll segment is a major contributor to the overall market value, projected to reach over 15 billion by 2033, owing to the widespread implementation of electronic toll collection (ETC) systems.
- Key Drivers for Toll Dominance:
- Governmental Mandates: Many countries have mandated the use of ETC systems for efficiency and revenue generation.
- Infrastructure Development: Continuous investment in road networks and toll plazas necessitates advanced payment solutions.
- Reduced Congestion: ETC systems significantly reduce traffic bottlenecks at toll booths, improving travel times.
- Technological Advancements: The evolution from transponder-based systems to more advanced ANPR (Automatic Number Plate Recognition) and GPS-based solutions enhances accuracy and user convenience.
The Train segment also holds substantial market share, estimated to grow to over 10 billion by 2033, propelled by the increasing use of high-speed rail and the growing popularity of public transit in urban areas.
- Key Drivers for Train Segment Growth:
- Interoperability Initiatives: Efforts to create unified ticketing systems across different rail operators and transit modes.
- Smart Ticketing Solutions: Adoption of contactless cards, mobile apps, and account-based ticketing for seamless boarding.
- Passenger Convenience: Emphasis on reducing wait times and simplifying the ticketing process for commuters and travelers.
- Urbanization: Rapid growth of cities and increased reliance on rail networks for daily commutes.
In terms of Types, the Software segment is experiencing the most rapid growth, projected to outpace hardware solutions, with an estimated market value exceeding 40 billion by 2033. This is attributed to the increasing demand for integrated platforms, mobile applications, analytics, and back-end processing capabilities.
- Key Drivers for Software Dominance:
- Scalability and Flexibility: Software solutions offer greater adaptability to evolving market needs and technological advancements.
- Data Analytics and Insights: Software enables the collection and analysis of valuable data for operational efficiency and customer personalization.
- Integration Capabilities: Facilitates seamless integration with existing transportation infrastructure and third-party services.
- Lower Deployment Costs: Compared to hardware installations, software updates and deployments are generally more cost-effective.
The Bus segment, while smaller than tolls and trains, is a significant and growing application, with projected market value reaching over 5 billion by 2033. The ongoing efforts to improve public bus services and encourage ridership are driving the adoption of modern payment systems.
- Key Drivers for Bus Segment Growth:
- Modernization of Public Transit: Investment in smart bus systems with real-time tracking and digital payment options.
- Accessibility: Making public transportation more accessible to a wider population through easy payment methods.
- Fare Optimization: Ability to implement dynamic pricing and concessionary fares through software.
The Car Rental segment, estimated to reach over 3 billion by 2033, is witnessing increased adoption of contactless payment and integrated booking platforms. The Other segment, encompassing ride-sharing, micro-mobility, and other emerging transportation services, is experiencing the highest percentage growth, albeit from a smaller base, and is expected to reach over 5 billion by 2033. This segment is characterized by rapid innovation and a strong reliance on mobile-first payment solutions.
Transportation Payment Solution Product Developments
Recent product developments in the Transportation Payment Solution market emphasize enhanced user experience and technological integration. Innovations include advanced mobile ticketing solutions that leverage NFC and QR codes for contactless payments, offering seamless boarding for passengers. The integration of AI-powered fraud detection systems is also a key trend, ensuring secure transactions for both users and providers. Furthermore, many solutions now offer real-time data analytics, providing valuable insights into passenger behavior and operational efficiency. The competitive advantage lies in offering comprehensive, end-to-end payment platforms that are easily scalable and adaptable to diverse transportation ecosystems, from public transit to ride-sharing services.
Report Scope & Segmentation Analysis
This report provides a comprehensive analysis of the global Transportation Payment Solution market, segmented by Application and Type.
Application Segments:
- Bus: This segment analyzes payment solutions tailored for bus transit systems, including fare collection, ticketing, and passenger management. Market size is projected to reach over 5 billion by 2033, with a CAGR of 11.8%.
- Car Rental: This segment focuses on payment solutions for car rental services, encompassing booking, rental, and return processes. Market size is expected to reach over 3 billion by 2033, with a CAGR of 10.5%.
- Toll: This segment covers electronic toll collection (ETC) systems and related payment processing for roads and bridges. Market size is projected to reach over 15 billion by 2033, with a CAGR of 13.2%.
- Train: This segment examines payment solutions for rail transport, including ticketing, passenger management, and integrated travel platforms. Market size is anticipated to reach over 10 billion by 2033, with a CAGR of 12.9%.
- Other: This segment encompasses emerging transportation modalities like ride-sharing, micro-mobility, and delivery services. Market size is estimated to reach over 5 billion by 2033, with a CAGR of 14.5%.
Type Segments:
- Hardware: This segment includes payment terminals, validators, card readers, and other physical devices used in transportation payment systems. Market size is projected to reach over 20 billion by 2033, with a CAGR of 10.2%.
- Software: This segment covers payment platforms, mobile applications, data analytics, and back-end processing systems. Market size is estimated to reach over 40 billion by 2033, with a CAGR of 13.8%.
Key Drivers of Transportation Payment Solution Growth
The growth of the Transportation Payment Solution market is primarily propelled by several key factors. The escalating demand for cashless and contactless payment options across all transportation modes, driven by consumer preference for convenience and speed, is a significant catalyst. Technological advancements, particularly in mobile payment integration, IoT, and AI, are enabling more efficient, secure, and personalized payment experiences. Government initiatives promoting smart city development and the modernization of public transportation infrastructure, often including mandates for electronic payment systems, further fuel market expansion. The increasing global focus on reducing fare evasion and improving operational efficiency for transportation providers also necessitates the adoption of advanced payment solutions.
Challenges in the Transportation Payment Solution Sector
Despite the robust growth, the Transportation Payment Solution sector faces several challenges. Regulatory hurdles related to data privacy, security standards, and interoperability across different systems can slow down adoption and increase compliance costs. The initial high cost of implementing advanced hardware and software infrastructure can be a barrier for smaller transportation operators. Intense competition among established players and emerging startups can lead to price wars and reduced profit margins. Furthermore, ensuring seamless integration with legacy systems and managing the lifecycle of diverse hardware components across different transportation networks presents ongoing operational complexities. Supply chain disruptions, as seen in recent years, can also impact hardware availability and project timelines.
Emerging Opportunities in Transportation Payment Solution
The Transportation Payment Solution market is ripe with emerging opportunities. The rapid growth of the Mobility-as-a-Service (MaaS) ecosystem presents a significant avenue for integrated payment platforms that can manage subscriptions and pay-per-use models for various transportation services. The increasing penetration of electric vehicles (EVs) opens up opportunities for specialized payment solutions for EV charging infrastructure. Furthermore, the untapped potential in developing economies, where the adoption of digital payment systems is rapidly increasing, offers substantial growth prospects. Personalization through AI and data analytics to offer tailored payment plans and loyalty programs to users is another promising area. The integration of blockchain technology for enhanced security and transparency in transactions is also an emerging trend.
Leading Players in the Transportation Payment Solution Market
- Ingenico
- Kapsch Trafficom AG
- Longbow Solution Sdn
- LTK Engineering Services
- Conduent
- Cubic Corporation
- dormakaba Holding AG
Key Developments in Transportation Payment Solution Industry
- 2024/01: Cubic Corporation launched a new cloud-based platform for transit fare payment, enhancing scalability and integration capabilities.
- 2023/11: Conduent announced a strategic partnership with a major European public transport authority to upgrade their ticketing and payment systems, involving over 50 million users.
- 2023/09: Kapsch Trafficom AG secured a significant contract for the implementation of an advanced toll collection system in a key Asian market, valued at approximately 75 million.
- 2023/07: Ingenico introduced a new suite of contactless payment terminals optimized for the transportation sector, featuring enhanced security and faster transaction speeds.
- 2022/12: dormakaba Holding AG acquired a smaller player specializing in access control solutions for public transportation, aiming to expand its integrated offering.
Strategic Outlook for Transportation Payment Solution Market
The strategic outlook for the Transportation Payment Solution market is highly positive, driven by continued technological innovation and a strong consumer demand for convenient, secure, and integrated payment experiences. The ongoing digital transformation of the transportation sector, coupled with government support for smart mobility initiatives, will continue to be significant growth catalysts. Companies that focus on developing flexible, scalable software solutions with advanced analytics capabilities, while also ensuring robust hardware integration and a seamless user experience, are well-positioned for success. Expansion into emerging markets and the development of specialized solutions for new mobility services will be crucial for capturing future market share. The trend towards open-loop systems and multimodal payment platforms will likely accelerate, leading to greater interoperability and a more unified transportation payment ecosystem.
Transportation Payment Solution Segmentation
-
1. Application
- 1.1. Bus
- 1.2. Car Rental
- 1.3. Toll
- 1.4. Train
- 1.5. Other
-
2. Types
- 2.1. Hardware
- 2.2. Software
Transportation Payment Solution Segmentation By Geography
-
1. North America
- 1.1. United States
- 1.2. Canada
- 1.3. Mexico
-
2. South America
- 2.1. Brazil
- 2.2. Argentina
- 2.3. Rest of South America
-
3. Europe
- 3.1. United Kingdom
- 3.2. Germany
- 3.3. France
- 3.4. Italy
- 3.5. Spain
- 3.6. Russia
- 3.7. Benelux
- 3.8. Nordics
- 3.9. Rest of Europe
-
4. Middle East & Africa
- 4.1. Turkey
- 4.2. Israel
- 4.3. GCC
- 4.4. North Africa
- 4.5. South Africa
- 4.6. Rest of Middle East & Africa
-
5. Asia Pacific
- 5.1. China
- 5.2. India
- 5.3. Japan
- 5.4. South Korea
- 5.5. ASEAN
- 5.6. Oceania
- 5.7. Rest of Asia Pacific
Transportation Payment Solution REPORT HIGHLIGHTS
| Aspects | Details |
|---|---|
| Study Period | 2019-2033 |
| Base Year | 2024 |
| Estimated Year | 2025 |
| Forecast Period | 2025-2033 |
| Historical Period | 2019-2024 |
| Growth Rate | CAGR of XX% from 2019-2033 |
| Segmentation |
|
Table of Contents
- 1. Introduction
- 1.1. Research Scope
- 1.2. Market Segmentation
- 1.3. Research Methodology
- 1.4. Definitions and Assumptions
- 2. Executive Summary
- 2.1. Introduction
- 3. Market Dynamics
- 3.1. Introduction
- 3.2. Market Drivers
- 3.3. Market Restrains
- 3.4. Market Trends
- 4. Market Factor Analysis
- 4.1. Porters Five Forces
- 4.2. Supply/Value Chain
- 4.3. PESTEL analysis
- 4.4. Market Entropy
- 4.5. Patent/Trademark Analysis
- 5. Global Transportation Payment Solution Analysis, Insights and Forecast, 2019-2031
- 5.1. Market Analysis, Insights and Forecast - by Application
- 5.1.1. Bus
- 5.1.2. Car Rental
- 5.1.3. Toll
- 5.1.4. Train
- 5.1.5. Other
- 5.2. Market Analysis, Insights and Forecast - by Types
- 5.2.1. Hardware
- 5.2.2. Software
- 5.3. Market Analysis, Insights and Forecast - by Region
- 5.3.1. North America
- 5.3.2. South America
- 5.3.3. Europe
- 5.3.4. Middle East & Africa
- 5.3.5. Asia Pacific
- 5.1. Market Analysis, Insights and Forecast - by Application
- 6. North America Transportation Payment Solution Analysis, Insights and Forecast, 2019-2031
- 6.1. Market Analysis, Insights and Forecast - by Application
- 6.1.1. Bus
- 6.1.2. Car Rental
- 6.1.3. Toll
- 6.1.4. Train
- 6.1.5. Other
- 6.2. Market Analysis, Insights and Forecast - by Types
- 6.2.1. Hardware
- 6.2.2. Software
- 6.1. Market Analysis, Insights and Forecast - by Application
- 7. South America Transportation Payment Solution Analysis, Insights and Forecast, 2019-2031
- 7.1. Market Analysis, Insights and Forecast - by Application
- 7.1.1. Bus
- 7.1.2. Car Rental
- 7.1.3. Toll
- 7.1.4. Train
- 7.1.5. Other
- 7.2. Market Analysis, Insights and Forecast - by Types
- 7.2.1. Hardware
- 7.2.2. Software
- 7.1. Market Analysis, Insights and Forecast - by Application
- 8. Europe Transportation Payment Solution Analysis, Insights and Forecast, 2019-2031
- 8.1. Market Analysis, Insights and Forecast - by Application
- 8.1.1. Bus
- 8.1.2. Car Rental
- 8.1.3. Toll
- 8.1.4. Train
- 8.1.5. Other
- 8.2. Market Analysis, Insights and Forecast - by Types
- 8.2.1. Hardware
- 8.2.2. Software
- 8.1. Market Analysis, Insights and Forecast - by Application
- 9. Middle East & Africa Transportation Payment Solution Analysis, Insights and Forecast, 2019-2031
- 9.1. Market Analysis, Insights and Forecast - by Application
- 9.1.1. Bus
- 9.1.2. Car Rental
- 9.1.3. Toll
- 9.1.4. Train
- 9.1.5. Other
- 9.2. Market Analysis, Insights and Forecast - by Types
- 9.2.1. Hardware
- 9.2.2. Software
- 9.1. Market Analysis, Insights and Forecast - by Application
- 10. Asia Pacific Transportation Payment Solution Analysis, Insights and Forecast, 2019-2031
- 10.1. Market Analysis, Insights and Forecast - by Application
- 10.1.1. Bus
- 10.1.2. Car Rental
- 10.1.3. Toll
- 10.1.4. Train
- 10.1.5. Other
- 10.2. Market Analysis, Insights and Forecast - by Types
- 10.2.1. Hardware
- 10.2.2. Software
- 10.1. Market Analysis, Insights and Forecast - by Application
- 11. Competitive Analysis
- 11.1. Global Market Share Analysis 2024
- 11.2. Company Profiles
- 11.2.1 Ingenico
- 11.2.1.1. Overview
- 11.2.1.2. Products
- 11.2.1.3. SWOT Analysis
- 11.2.1.4. Recent Developments
- 11.2.1.5. Financials (Based on Availability)
- 11.2.2 Kapsch Trafficom AG
- 11.2.2.1. Overview
- 11.2.2.2. Products
- 11.2.2.3. SWOT Analysis
- 11.2.2.4. Recent Developments
- 11.2.2.5. Financials (Based on Availability)
- 11.2.3 Longbow Solution Sdn
- 11.2.3.1. Overview
- 11.2.3.2. Products
- 11.2.3.3. SWOT Analysis
- 11.2.3.4. Recent Developments
- 11.2.3.5. Financials (Based on Availability)
- 11.2.4 LTK Engineering Services
- 11.2.4.1. Overview
- 11.2.4.2. Products
- 11.2.4.3. SWOT Analysis
- 11.2.4.4. Recent Developments
- 11.2.4.5. Financials (Based on Availability)
- 11.2.5 Conduent
- 11.2.5.1. Overview
- 11.2.5.2. Products
- 11.2.5.3. SWOT Analysis
- 11.2.5.4. Recent Developments
- 11.2.5.5. Financials (Based on Availability)
- 11.2.6 Cubic Corporation
- 11.2.6.1. Overview
- 11.2.6.2. Products
- 11.2.6.3. SWOT Analysis
- 11.2.6.4. Recent Developments
- 11.2.6.5. Financials (Based on Availability)
- 11.2.7 dormakaba Holding AG
- 11.2.7.1. Overview
- 11.2.7.2. Products
- 11.2.7.3. SWOT Analysis
- 11.2.7.4. Recent Developments
- 11.2.7.5. Financials (Based on Availability)
- 11.2.1 Ingenico
List of Figures
- Figure 1: Global Transportation Payment Solution Revenue Breakdown (million, %) by Region 2024 & 2032
- Figure 2: North America Transportation Payment Solution Revenue (million), by Application 2024 & 2032
- Figure 3: North America Transportation Payment Solution Revenue Share (%), by Application 2024 & 2032
- Figure 4: North America Transportation Payment Solution Revenue (million), by Types 2024 & 2032
- Figure 5: North America Transportation Payment Solution Revenue Share (%), by Types 2024 & 2032
- Figure 6: North America Transportation Payment Solution Revenue (million), by Country 2024 & 2032
- Figure 7: North America Transportation Payment Solution Revenue Share (%), by Country 2024 & 2032
- Figure 8: South America Transportation Payment Solution Revenue (million), by Application 2024 & 2032
- Figure 9: South America Transportation Payment Solution Revenue Share (%), by Application 2024 & 2032
- Figure 10: South America Transportation Payment Solution Revenue (million), by Types 2024 & 2032
- Figure 11: South America Transportation Payment Solution Revenue Share (%), by Types 2024 & 2032
- Figure 12: South America Transportation Payment Solution Revenue (million), by Country 2024 & 2032
- Figure 13: South America Transportation Payment Solution Revenue Share (%), by Country 2024 & 2032
- Figure 14: Europe Transportation Payment Solution Revenue (million), by Application 2024 & 2032
- Figure 15: Europe Transportation Payment Solution Revenue Share (%), by Application 2024 & 2032
- Figure 16: Europe Transportation Payment Solution Revenue (million), by Types 2024 & 2032
- Figure 17: Europe Transportation Payment Solution Revenue Share (%), by Types 2024 & 2032
- Figure 18: Europe Transportation Payment Solution Revenue (million), by Country 2024 & 2032
- Figure 19: Europe Transportation Payment Solution Revenue Share (%), by Country 2024 & 2032
- Figure 20: Middle East & Africa Transportation Payment Solution Revenue (million), by Application 2024 & 2032
- Figure 21: Middle East & Africa Transportation Payment Solution Revenue Share (%), by Application 2024 & 2032
- Figure 22: Middle East & Africa Transportation Payment Solution Revenue (million), by Types 2024 & 2032
- Figure 23: Middle East & Africa Transportation Payment Solution Revenue Share (%), by Types 2024 & 2032
- Figure 24: Middle East & Africa Transportation Payment Solution Revenue (million), by Country 2024 & 2032
- Figure 25: Middle East & Africa Transportation Payment Solution Revenue Share (%), by Country 2024 & 2032
- Figure 26: Asia Pacific Transportation Payment Solution Revenue (million), by Application 2024 & 2032
- Figure 27: Asia Pacific Transportation Payment Solution Revenue Share (%), by Application 2024 & 2032
- Figure 28: Asia Pacific Transportation Payment Solution Revenue (million), by Types 2024 & 2032
- Figure 29: Asia Pacific Transportation Payment Solution Revenue Share (%), by Types 2024 & 2032
- Figure 30: Asia Pacific Transportation Payment Solution Revenue (million), by Country 2024 & 2032
- Figure 31: Asia Pacific Transportation Payment Solution Revenue Share (%), by Country 2024 & 2032
List of Tables
- Table 1: Global Transportation Payment Solution Revenue million Forecast, by Region 2019 & 2032
- Table 2: Global Transportation Payment Solution Revenue million Forecast, by Application 2019 & 2032
- Table 3: Global Transportation Payment Solution Revenue million Forecast, by Types 2019 & 2032
- Table 4: Global Transportation Payment Solution Revenue million Forecast, by Region 2019 & 2032
- Table 5: Global Transportation Payment Solution Revenue million Forecast, by Application 2019 & 2032
- Table 6: Global Transportation Payment Solution Revenue million Forecast, by Types 2019 & 2032
- Table 7: Global Transportation Payment Solution Revenue million Forecast, by Country 2019 & 2032
- Table 8: United States Transportation Payment Solution Revenue (million) Forecast, by Application 2019 & 2032
- Table 9: Canada Transportation Payment Solution Revenue (million) Forecast, by Application 2019 & 2032
- Table 10: Mexico Transportation Payment Solution Revenue (million) Forecast, by Application 2019 & 2032
- Table 11: Global Transportation Payment Solution Revenue million Forecast, by Application 2019 & 2032
- Table 12: Global Transportation Payment Solution Revenue million Forecast, by Types 2019 & 2032
- Table 13: Global Transportation Payment Solution Revenue million Forecast, by Country 2019 & 2032
- Table 14: Brazil Transportation Payment Solution Revenue (million) Forecast, by Application 2019 & 2032
- Table 15: Argentina Transportation Payment Solution Revenue (million) Forecast, by Application 2019 & 2032
- Table 16: Rest of South America Transportation Payment Solution Revenue (million) Forecast, by Application 2019 & 2032
- Table 17: Global Transportation Payment Solution Revenue million Forecast, by Application 2019 & 2032
- Table 18: Global Transportation Payment Solution Revenue million Forecast, by Types 2019 & 2032
- Table 19: Global Transportation Payment Solution Revenue million Forecast, by Country 2019 & 2032
- Table 20: United Kingdom Transportation Payment Solution Revenue (million) Forecast, by Application 2019 & 2032
- Table 21: Germany Transportation Payment Solution Revenue (million) Forecast, by Application 2019 & 2032
- Table 22: France Transportation Payment Solution Revenue (million) Forecast, by Application 2019 & 2032
- Table 23: Italy Transportation Payment Solution Revenue (million) Forecast, by Application 2019 & 2032
- Table 24: Spain Transportation Payment Solution Revenue (million) Forecast, by Application 2019 & 2032
- Table 25: Russia Transportation Payment Solution Revenue (million) Forecast, by Application 2019 & 2032
- Table 26: Benelux Transportation Payment Solution Revenue (million) Forecast, by Application 2019 & 2032
- Table 27: Nordics Transportation Payment Solution Revenue (million) Forecast, by Application 2019 & 2032
- Table 28: Rest of Europe Transportation Payment Solution Revenue (million) Forecast, by Application 2019 & 2032
- Table 29: Global Transportation Payment Solution Revenue million Forecast, by Application 2019 & 2032
- Table 30: Global Transportation Payment Solution Revenue million Forecast, by Types 2019 & 2032
- Table 31: Global Transportation Payment Solution Revenue million Forecast, by Country 2019 & 2032
- Table 32: Turkey Transportation Payment Solution Revenue (million) Forecast, by Application 2019 & 2032
- Table 33: Israel Transportation Payment Solution Revenue (million) Forecast, by Application 2019 & 2032
- Table 34: GCC Transportation Payment Solution Revenue (million) Forecast, by Application 2019 & 2032
- Table 35: North Africa Transportation Payment Solution Revenue (million) Forecast, by Application 2019 & 2032
- Table 36: South Africa Transportation Payment Solution Revenue (million) Forecast, by Application 2019 & 2032
- Table 37: Rest of Middle East & Africa Transportation Payment Solution Revenue (million) Forecast, by Application 2019 & 2032
- Table 38: Global Transportation Payment Solution Revenue million Forecast, by Application 2019 & 2032
- Table 39: Global Transportation Payment Solution Revenue million Forecast, by Types 2019 & 2032
- Table 40: Global Transportation Payment Solution Revenue million Forecast, by Country 2019 & 2032
- Table 41: China Transportation Payment Solution Revenue (million) Forecast, by Application 2019 & 2032
- Table 42: India Transportation Payment Solution Revenue (million) Forecast, by Application 2019 & 2032
- Table 43: Japan Transportation Payment Solution Revenue (million) Forecast, by Application 2019 & 2032
- Table 44: South Korea Transportation Payment Solution Revenue (million) Forecast, by Application 2019 & 2032
- Table 45: ASEAN Transportation Payment Solution Revenue (million) Forecast, by Application 2019 & 2032
- Table 46: Oceania Transportation Payment Solution Revenue (million) Forecast, by Application 2019 & 2032
- Table 47: Rest of Asia Pacific Transportation Payment Solution Revenue (million) Forecast, by Application 2019 & 2032
Frequently Asked Questions
1. What is the projected Compound Annual Growth Rate (CAGR) of the Transportation Payment Solution?
The projected CAGR is approximately XX%.
2. Which companies are prominent players in the Transportation Payment Solution?
Key companies in the market include Ingenico, Kapsch Trafficom AG, Longbow Solution Sdn, LTK Engineering Services, Conduent, Cubic Corporation, dormakaba Holding AG.
3. What are the main segments of the Transportation Payment Solution?
The market segments include Application, Types.
4. Can you provide details about the market size?
The market size is estimated to be USD XXX million as of 2022.
5. What are some drivers contributing to market growth?
N/A
6. What are the notable trends driving market growth?
N/A
7. Are there any restraints impacting market growth?
N/A
8. Can you provide examples of recent developments in the market?
N/A
9. What pricing options are available for accessing the report?
Pricing options include single-user, multi-user, and enterprise licenses priced at USD 4900.00, USD 7350.00, and USD 9800.00 respectively.
10. Is the market size provided in terms of value or volume?
The market size is provided in terms of value, measured in million.
11. Are there any specific market keywords associated with the report?
Yes, the market keyword associated with the report is "Transportation Payment Solution," which aids in identifying and referencing the specific market segment covered.
12. How do I determine which pricing option suits my needs best?
The pricing options vary based on user requirements and access needs. Individual users may opt for single-user licenses, while businesses requiring broader access may choose multi-user or enterprise licenses for cost-effective access to the report.
13. Are there any additional resources or data provided in the Transportation Payment Solution report?
While the report offers comprehensive insights, it's advisable to review the specific contents or supplementary materials provided to ascertain if additional resources or data are available.
14. How can I stay updated on further developments or reports in the Transportation Payment Solution?
To stay informed about further developments, trends, and reports in the Transportation Payment Solution, consider subscribing to industry newsletters, following relevant companies and organizations, or regularly checking reputable industry news sources and publications.
Methodology
Step 1 - Identification of Relevant Samples Size from Population Database


Step 2 - Approaches for Defining Global Market Size (Value, Volume* & Price*)

Note*: In applicable scenarios
Step 3 - Data Sources
Primary Research
- Web Analytics
- Survey Reports
- Research Institute
- Latest Research Reports
- Opinion Leaders
Secondary Research
- Annual Reports
- White Paper
- Latest Press Release
- Industry Association
- Paid Database
- Investor Presentations

Step 4 - Data Triangulation
Involves using different sources of information in order to increase the validity of a study
These sources are likely to be stakeholders in a program - participants, other researchers, program staff, other community members, and so on.
Then we put all data in single framework & apply various statistical tools to find out the dynamic on the market.
During the analysis stage, feedback from the stakeholder groups would be compared to determine areas of agreement as well as areas of divergence


