

Key Insights
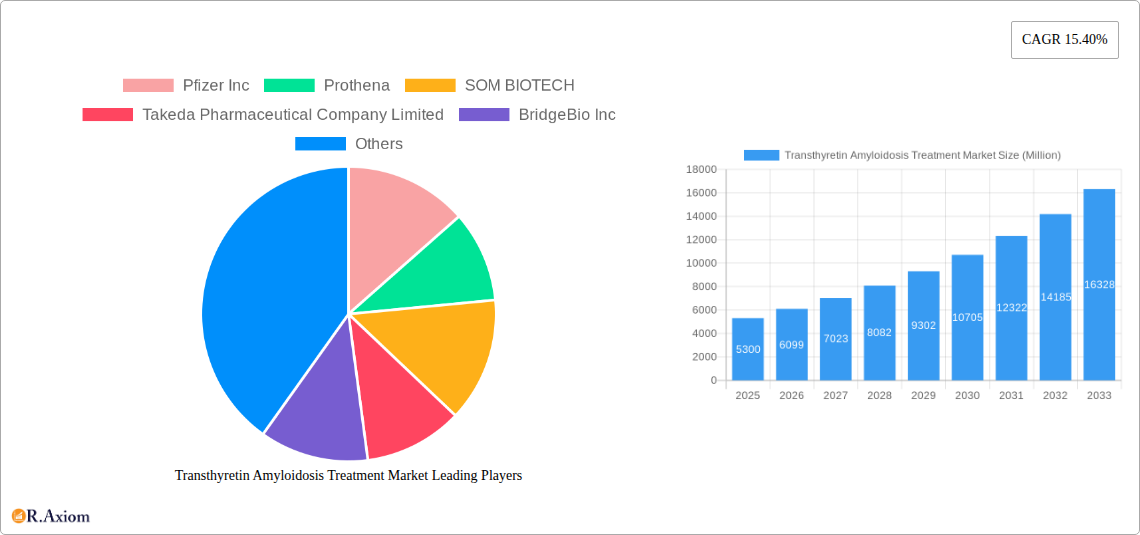
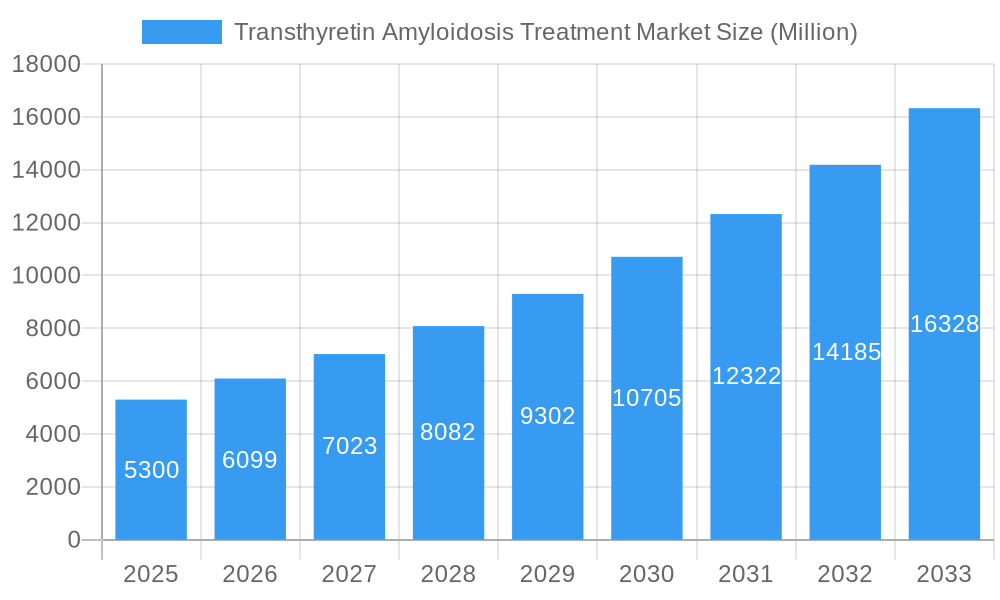
The Transthyretin Amyloidosis (ATTR) treatment market, valued at $5.3 billion in 2025, is projected to experience robust growth, driven by a rising prevalence of ATTR, advancements in targeted therapies, and increased awareness among healthcare professionals and patients. The market's compound annual growth rate (CAGR) of 15.4% from 2025 to 2033 reflects a significant unmet medical need and the potential for innovative treatment approaches. ATTR-CM (cardiomyopathy) and ATTR-PN (polyneuropathy) represent the largest segments, with targeted therapies leading the therapeutic landscape. Hereditary amyloidosis accounts for a substantial portion of the diagnosed cases, while the wild-type form represents a growing area of focus for research and development. The market is primarily driven by the launch of novel therapies offering improved efficacy and tolerability compared to supportive care. However, challenges include high treatment costs, the need for improved diagnostic tools for early detection, and the complexity of the disease. The North American market holds a significant share owing to high healthcare expenditure and advanced healthcare infrastructure, followed by Europe and Asia Pacific. The competitive landscape is characterized by both large pharmaceutical companies and emerging biotech firms, leading to intense research and development activity to bring innovative therapies to the market. Hospitals and specialized clinics constitute the primary distribution channel, reflecting the need for close medical monitoring.
Transthyretin Amyloidosis Treatment Market Market Size (In Billion)
The forecast period will see a steady expansion of the ATTR treatment market, driven by the introduction of novel therapies and the expansion of diagnostic capabilities. Growth will be fueled by several factors: increasing investment in research and development by major pharmaceutical companies and biotech firms, improved understanding of disease pathophysiology, and better access to advanced diagnostic technologies. Market expansion will vary across regions, influenced by factors like healthcare infrastructure, awareness of the disease, and regulatory approval timelines for new therapies. The increasing adoption of targeted therapies, alongside supportive care, points to a diversified therapeutic strategy to effectively manage ATTR. Furthermore, continued efforts in patient advocacy and educational initiatives will play a crucial role in promoting early diagnosis and facilitating timely access to advanced treatment options, ultimately driving market growth during the projected period.
Transthyretin Amyloidosis Treatment Market Company Market Share
Transthyretin Amyloidosis Treatment Market: A Comprehensive Report (2019-2033)
This detailed report provides a comprehensive analysis of the Transthyretin Amyloidosis Treatment market, covering market size, segmentation, key players, and future growth prospects. The study period spans from 2019 to 2033, with 2025 as the base and estimated year. The report offers actionable insights for industry stakeholders, investors, and researchers, encompassing historical data (2019-2024), current market estimations (2025), and future forecasts (2025-2033).
Transthyretin Amyloidosis Treatment Market Market Concentration & Innovation
The Transthyretin Amyloidosis Treatment market is characterized by a moderately concentrated landscape, with several key players holding significant market share. Pfizer Inc., Takeda Pharmaceutical Company Limited, and Alnylam Pharmaceuticals Inc. are among the leading companies, driving innovation through the development of novel therapies. However, the market also exhibits significant potential for smaller companies and emerging biotech firms to disrupt the market through focused research and strategic partnerships.
Market concentration is assessed through metrics such as the Herfindahl-Hirschman Index (HHI), with a value of xx calculated for 2025. The market share of the top three players in 2025 is estimated at xx%. Mergers and acquisitions (M&A) play a crucial role in shaping the competitive dynamics, with total M&A deal value in the period 2019-2024 estimated at approximately xx Million. Recent deals reflect a focus on expanding product portfolios and geographical reach.
Key innovation drivers include advancements in gene therapy, RNA interference (RNAi) technologies, and targeted therapies. The regulatory framework significantly impacts market growth, with stringent approval processes for new treatments adding complexity. Product substitutes, such as supportive therapies, also exert influence on market penetration. End-user trends, such as the rising awareness of ATTR amyloidosis and improved diagnostic capabilities, further drive market demand. The ongoing M&A activity indicates significant consolidation and strategic investments in the sector.
Transthyretin Amyloidosis Treatment Market Industry Trends & Insights
The Transthyretin Amyloidosis Treatment market is experiencing robust growth, driven by increasing prevalence of ATTR amyloidosis, growing awareness among healthcare professionals and patients, and continuous advancements in therapeutic options. The market is projected to exhibit a Compound Annual Growth Rate (CAGR) of xx% during the forecast period (2025-2033).
Technological disruptions, particularly the development of targeted therapies and gene silencing technologies, are revolutionizing treatment approaches. Patient preferences are shifting toward less invasive and more effective treatments. Competitive dynamics are intensified by the entry of new players and strategic partnerships, fueling innovation and improved treatment options. Market penetration of novel therapies is steadily increasing, with xx% of patients predicted to receive targeted therapies by 2033. This growth is further supported by the rising adoption of advanced diagnostic techniques and improved understanding of the disease pathology. Challenges remain in overcoming high treatment costs and access barriers in certain regions.
Dominant Markets & Segments in Transthyretin Amyloidosis Treatment Market
Leading Region: North America dominates the market due to high healthcare expenditure, advanced healthcare infrastructure, and robust regulatory support.
Leading Country: The United States holds the largest market share within North America.
Dominant Segments:
- Type: ATTR-PN (Transthyretin Amyloid Polyneuropathy) currently holds a larger market share compared to ATTR-CM (Transthyretin Amyloid Cardiomyopathy), although the latter is anticipated to show faster growth due to recent clinical developments.
- Therapy: Targeted therapy is the dominant segment and will maintain its market leadership due to improved efficacy compared to supportive care therapies.
- Disease Type: Hereditary amyloidosis constitutes the majority of cases, but the wild-type segment is witnessing significant growth due to an increased understanding of this form of the disease.
- Distribution Channel: Hospitals Pharmacy accounts for the majority of distribution.
Key Drivers for Dominance: The dominance of North America is fueled by high healthcare spending, strong research infrastructure, and early adoption of novel therapies. The dominance of ATTR-PN is currently attributed to a higher prevalence compared to ATTR-CM; however, this trend may shift with advancements in treatment for ATTR-CM. Targeted therapies dominate due to their superior efficacy.
Transthyretin Amyloidosis Treatment Market Product Developments
Recent product innovations focus on improving efficacy, reducing side effects, and enhancing patient convenience. The introduction of RNAi therapies, and other targeted agents represent significant technological advancements, offering improved treatment options with better tolerability. These innovative therapies are gaining significant traction due to their targeted mechanism of action and demonstrably improved clinical outcomes compared to older treatment modalities. The market fit of these new products is exceptionally strong, driven by unmet medical needs and rising patient demand.
Report Scope & Segmentation Analysis
This report segments the Transthyretin Amyloidosis Treatment market across various parameters:
Type: ATTR-CM and ATTR-PN, with ATTR-PN holding a larger market share in 2025 (xx Million) and ATTR-CM projected to grow at a faster CAGR of xx% during the forecast period.
Therapy: Targeted Therapy (xx Million in 2025) is the dominant segment, exceeding Supportive Therapy (xx Million in 2025) significantly.
Disease Type: Hereditary Amyloidosis currently holds a greater market share than Wild-type Amyloidosis.
Distribution Channel: Hospitals Pharmacy dominates the market, followed by Retail Pharmacies and Other Distribution Channels. Each segment exhibits unique growth trajectories and competitive dynamics. Growth projections vary considerably based on the segment, reflecting varying treatment modalities and patient populations.
Key Drivers of Transthyretin Amyloidosis Treatment Market Growth
Several factors fuel the market's expansion. Technological advancements in targeted therapies and gene silencing technologies lead to improved efficacy and reduced side effects. Increasing prevalence of ATTR amyloidosis, coupled with growing disease awareness, expands the patient pool. Favorable regulatory environments and increased investments in R&D further stimulate market growth.
Challenges in the Transthyretin Amyloidosis Treatment Market Sector
High drug costs and limited reimbursement coverage pose significant challenges. The complex disease pathology and variability in patient response necessitate personalized treatment strategies, adding to the complexity of clinical management. Competition among established and emerging players intensifies pressure on pricing and market share. Furthermore, lengthy clinical trial timelines and stringent regulatory hurdles can delay the market entry of promising new therapies.
Emerging Opportunities in Transthyretin Amyloidosis Treatment Market
Emerging opportunities include the development of novel therapies targeting specific disease subtypes, expanding diagnostic capabilities, and personalized medicine approaches. Growth in emerging markets presents significant potential, while digital health tools can improve patient engagement and treatment adherence. Furthermore, the development of combination therapies may prove to be a high-growth area.
Leading Players in the Transthyretin Amyloidosis Treatment Market Market
- Pfizer Inc.
- Prothena
- SOM BIOTECH
- Takeda Pharmaceutical Company Limited
- BridgeBio Inc
- Millennium Pharmaceuticals
- Alnylam Pharmaceuticals Inc
- Ionis Pharmaceuticals
- Oncopeptides
- Corino Therapeutics Inc
- Alexion Pharmaceuticals
- Intellia Therapeutics Inc
Key Developments in Transthyretin Amyloidosis Treatment Market Industry
- April 2024: Alexion initiated the Phase 3 DepleTTR-CM clinical study for ALXN2220, potentially expanding treatment options for ATTR-CM.
- March 2024: BridgeBio Pharma Inc. partnered with Bayer for European commercialization of acoramidis, enhancing market access for ATTR-CM treatment.
Strategic Outlook for Transthyretin Amyloidosis Treatment Market Market
The Transthyretin Amyloidosis Treatment market holds substantial future potential, driven by continuous innovation in therapeutic modalities, growing patient awareness, and expanding diagnostic capabilities. Strategic partnerships, acquisitions, and investments in research and development will shape the market landscape. The focus on personalized medicine and advancements in early diagnosis will drive future growth and improve patient outcomes.
Transthyretin Amyloidosis Treatment Market Segmentation
-
1. Type
- 1.1. ATTR-CM (Transthyretin Amyloid Cardiomyopathy)
- 1.2. ATTR-PN (Transthyretin Amyloid Polyneuropathy)
-
2. Therapy
- 2.1. Targeted Therapy
- 2.2. Supportive Therapy
-
3. Disease Type
- 3.1. Hereditary Amyloidosis
- 3.2. Wild-type Amyloidosis
- 3.3. Other Disease Type
-
4. Distribution Channel
- 4.1. Hospitals Pharmacy
- 4.2. Retail Pharmacies
- 4.3. Other Distribution Channel
Transthyretin Amyloidosis Treatment Market Segmentation By Geography
-
1. North America
- 1.1. United States
- 1.2. Canada
- 1.3. Mexico
-
2. Europe
- 2.1. Germany
- 2.2. United Kingdom
- 2.3. France
- 2.4. Italy
- 2.5. Spain
- 2.6. Rest of Europe
-
3. Asia Pacific
- 3.1. China
- 3.2. Japan
- 3.3. India
- 3.4. Australia
- 3.5. South Korea
- 3.6. Rest of Asia Pacific
- 4. Rest of the World
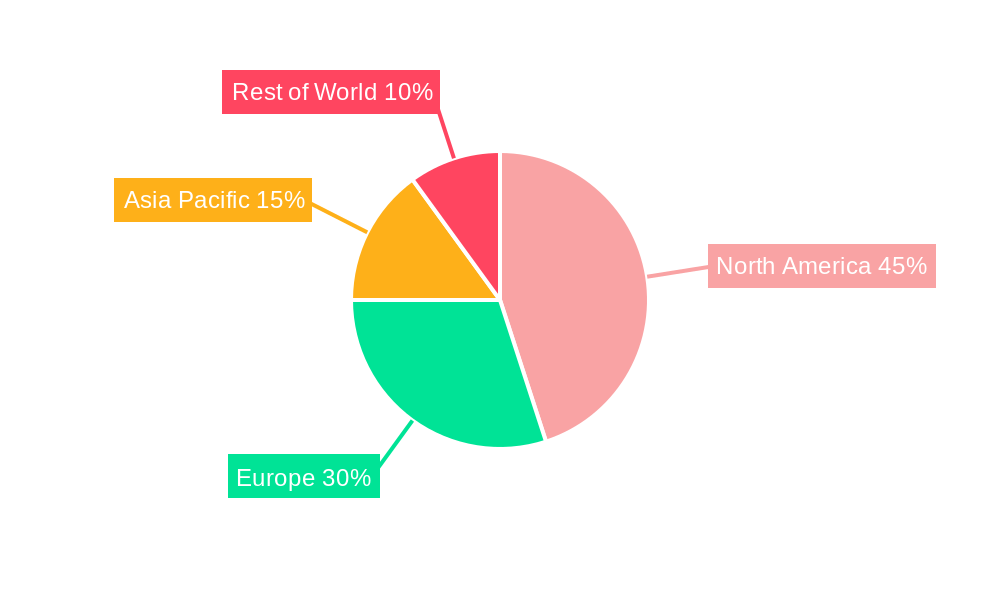
Transthyretin Amyloidosis Treatment Market Regional Market Share
Geographic Coverage of Transthyretin Amyloidosis Treatment Market
Transthyretin Amyloidosis Treatment Market REPORT HIGHLIGHTS
| Aspects | Details |
|---|---|
| Study Period | 2020-2034 |
| Base Year | 2025 |
| Estimated Year | 2026 |
| Forecast Period | 2026-2034 |
| Historical Period | 2020-2025 |
| Growth Rate | CAGR of 15.40% from 2020-2034 |
| Segmentation |
|
Table of Contents
- 1. Introduction
- 1.1. Research Scope
- 1.2. Market Segmentation
- 1.3. Research Methodology
- 1.4. Definitions and Assumptions
- 2. Executive Summary
- 2.1. Introduction
- 3. Market Dynamics
- 3.1. Introduction
- 3.2. Market Drivers
- 3.2.1. Growing Geriatric Population and Risk Factors for Amyloid Light Chain (AL); Increasing Research and Development (R&D) and Growing Disease Awareness
- 3.3. Market Restrains
- 3.3.1. High Cost Associated with the Transthyretin Amyloidosis Treatment
- 3.4. Market Trends
- 3.4.1. The Hereditary Transthyretin Amyloidosis Segment is Expected to Hold a Significant Share Over the Forecast Period
- 4. Market Factor Analysis
- 4.1. Porters Five Forces
- 4.2. Supply/Value Chain
- 4.3. PESTEL analysis
- 4.4. Market Entropy
- 4.5. Patent/Trademark Analysis
- 5. Global Transthyretin Amyloidosis Treatment Market Analysis, Insights and Forecast, 2020-2032
- 5.1. Market Analysis, Insights and Forecast - by Type
- 5.1.1. ATTR-CM (Transthyretin Amyloid Cardiomyopathy)
- 5.1.2. ATTR-PN (Transthyretin Amyloid Polyneuropathy)
- 5.2. Market Analysis, Insights and Forecast - by Therapy
- 5.2.1. Targeted Therapy
- 5.2.2. Supportive Therapy
- 5.3. Market Analysis, Insights and Forecast - by Disease Type
- 5.3.1. Hereditary Amyloidosis
- 5.3.2. Wild-type Amyloidosis
- 5.3.3. Other Disease Type
- 5.4. Market Analysis, Insights and Forecast - by Distribution Channel
- 5.4.1. Hospitals Pharmacy
- 5.4.2. Retail Pharmacies
- 5.4.3. Other Distribution Channel
- 5.5. Market Analysis, Insights and Forecast - by Region
- 5.5.1. North America
- 5.5.2. Europe
- 5.5.3. Asia Pacific
- 5.5.4. Rest of the World
- 5.1. Market Analysis, Insights and Forecast - by Type
- 6. North America Transthyretin Amyloidosis Treatment Market Analysis, Insights and Forecast, 2020-2032
- 6.1. Market Analysis, Insights and Forecast - by Type
- 6.1.1. ATTR-CM (Transthyretin Amyloid Cardiomyopathy)
- 6.1.2. ATTR-PN (Transthyretin Amyloid Polyneuropathy)
- 6.2. Market Analysis, Insights and Forecast - by Therapy
- 6.2.1. Targeted Therapy
- 6.2.2. Supportive Therapy
- 6.3. Market Analysis, Insights and Forecast - by Disease Type
- 6.3.1. Hereditary Amyloidosis
- 6.3.2. Wild-type Amyloidosis
- 6.3.3. Other Disease Type
- 6.4. Market Analysis, Insights and Forecast - by Distribution Channel
- 6.4.1. Hospitals Pharmacy
- 6.4.2. Retail Pharmacies
- 6.4.3. Other Distribution Channel
- 6.1. Market Analysis, Insights and Forecast - by Type
- 7. Europe Transthyretin Amyloidosis Treatment Market Analysis, Insights and Forecast, 2020-2032
- 7.1. Market Analysis, Insights and Forecast - by Type
- 7.1.1. ATTR-CM (Transthyretin Amyloid Cardiomyopathy)
- 7.1.2. ATTR-PN (Transthyretin Amyloid Polyneuropathy)
- 7.2. Market Analysis, Insights and Forecast - by Therapy
- 7.2.1. Targeted Therapy
- 7.2.2. Supportive Therapy
- 7.3. Market Analysis, Insights and Forecast - by Disease Type
- 7.3.1. Hereditary Amyloidosis
- 7.3.2. Wild-type Amyloidosis
- 7.3.3. Other Disease Type
- 7.4. Market Analysis, Insights and Forecast - by Distribution Channel
- 7.4.1. Hospitals Pharmacy
- 7.4.2. Retail Pharmacies
- 7.4.3. Other Distribution Channel
- 7.1. Market Analysis, Insights and Forecast - by Type
- 8. Asia Pacific Transthyretin Amyloidosis Treatment Market Analysis, Insights and Forecast, 2020-2032
- 8.1. Market Analysis, Insights and Forecast - by Type
- 8.1.1. ATTR-CM (Transthyretin Amyloid Cardiomyopathy)
- 8.1.2. ATTR-PN (Transthyretin Amyloid Polyneuropathy)
- 8.2. Market Analysis, Insights and Forecast - by Therapy
- 8.2.1. Targeted Therapy
- 8.2.2. Supportive Therapy
- 8.3. Market Analysis, Insights and Forecast - by Disease Type
- 8.3.1. Hereditary Amyloidosis
- 8.3.2. Wild-type Amyloidosis
- 8.3.3. Other Disease Type
- 8.4. Market Analysis, Insights and Forecast - by Distribution Channel
- 8.4.1. Hospitals Pharmacy
- 8.4.2. Retail Pharmacies
- 8.4.3. Other Distribution Channel
- 8.1. Market Analysis, Insights and Forecast - by Type
- 9. Rest of the World Transthyretin Amyloidosis Treatment Market Analysis, Insights and Forecast, 2020-2032
- 9.1. Market Analysis, Insights and Forecast - by Type
- 9.1.1. ATTR-CM (Transthyretin Amyloid Cardiomyopathy)
- 9.1.2. ATTR-PN (Transthyretin Amyloid Polyneuropathy)
- 9.2. Market Analysis, Insights and Forecast - by Therapy
- 9.2.1. Targeted Therapy
- 9.2.2. Supportive Therapy
- 9.3. Market Analysis, Insights and Forecast - by Disease Type
- 9.3.1. Hereditary Amyloidosis
- 9.3.2. Wild-type Amyloidosis
- 9.3.3. Other Disease Type
- 9.4. Market Analysis, Insights and Forecast - by Distribution Channel
- 9.4.1. Hospitals Pharmacy
- 9.4.2. Retail Pharmacies
- 9.4.3. Other Distribution Channel
- 9.1. Market Analysis, Insights and Forecast - by Type
- 10. Competitive Analysis
- 10.1. Global Market Share Analysis 2025
- 10.2. Company Profiles
- 10.2.1 Pfizer Inc
- 10.2.1.1. Overview
- 10.2.1.2. Products
- 10.2.1.3. SWOT Analysis
- 10.2.1.4. Recent Developments
- 10.2.1.5. Financials (Based on Availability)
- 10.2.2 Prothena
- 10.2.2.1. Overview
- 10.2.2.2. Products
- 10.2.2.3. SWOT Analysis
- 10.2.2.4. Recent Developments
- 10.2.2.5. Financials (Based on Availability)
- 10.2.3 SOM BIOTECH
- 10.2.3.1. Overview
- 10.2.3.2. Products
- 10.2.3.3. SWOT Analysis
- 10.2.3.4. Recent Developments
- 10.2.3.5. Financials (Based on Availability)
- 10.2.4 Takeda Pharmaceutical Company Limited
- 10.2.4.1. Overview
- 10.2.4.2. Products
- 10.2.4.3. SWOT Analysis
- 10.2.4.4. Recent Developments
- 10.2.4.5. Financials (Based on Availability)
- 10.2.5 BridgeBio Inc
- 10.2.5.1. Overview
- 10.2.5.2. Products
- 10.2.5.3. SWOT Analysis
- 10.2.5.4. Recent Developments
- 10.2.5.5. Financials (Based on Availability)
- 10.2.6 Millennium Pharmaceuticals
- 10.2.6.1. Overview
- 10.2.6.2. Products
- 10.2.6.3. SWOT Analysis
- 10.2.6.4. Recent Developments
- 10.2.6.5. Financials (Based on Availability)
- 10.2.7 Alnylam Pharmaceuticals Inc
- 10.2.7.1. Overview
- 10.2.7.2. Products
- 10.2.7.3. SWOT Analysis
- 10.2.7.4. Recent Developments
- 10.2.7.5. Financials (Based on Availability)
- 10.2.8 Ionis Pharmaceuticals
- 10.2.8.1. Overview
- 10.2.8.2. Products
- 10.2.8.3. SWOT Analysis
- 10.2.8.4. Recent Developments
- 10.2.8.5. Financials (Based on Availability)
- 10.2.9 Oncopeptides
- 10.2.9.1. Overview
- 10.2.9.2. Products
- 10.2.9.3. SWOT Analysis
- 10.2.9.4. Recent Developments
- 10.2.9.5. Financials (Based on Availability)
- 10.2.10 Corino Therapeutics Inc
- 10.2.10.1. Overview
- 10.2.10.2. Products
- 10.2.10.3. SWOT Analysis
- 10.2.10.4. Recent Developments
- 10.2.10.5. Financials (Based on Availability)
- 10.2.11 Alexion Pharmaceuticals
- 10.2.11.1. Overview
- 10.2.11.2. Products
- 10.2.11.3. SWOT Analysis
- 10.2.11.4. Recent Developments
- 10.2.11.5. Financials (Based on Availability)
- 10.2.12 Intellia Therapeutics Inc
- 10.2.12.1. Overview
- 10.2.12.2. Products
- 10.2.12.3. SWOT Analysis
- 10.2.12.4. Recent Developments
- 10.2.12.5. Financials (Based on Availability)
- 10.2.1 Pfizer Inc
List of Figures
- Figure 1: Global Transthyretin Amyloidosis Treatment Market Revenue Breakdown (Million, %) by Region 2025 & 2033
- Figure 2: Global Transthyretin Amyloidosis Treatment Market Volume Breakdown (K Unit, %) by Region 2025 & 2033
- Figure 3: North America Transthyretin Amyloidosis Treatment Market Revenue (Million), by Type 2025 & 2033
- Figure 4: North America Transthyretin Amyloidosis Treatment Market Volume (K Unit), by Type 2025 & 2033
- Figure 5: North America Transthyretin Amyloidosis Treatment Market Revenue Share (%), by Type 2025 & 2033
- Figure 6: North America Transthyretin Amyloidosis Treatment Market Volume Share (%), by Type 2025 & 2033
- Figure 7: North America Transthyretin Amyloidosis Treatment Market Revenue (Million), by Therapy 2025 & 2033
- Figure 8: North America Transthyretin Amyloidosis Treatment Market Volume (K Unit), by Therapy 2025 & 2033
- Figure 9: North America Transthyretin Amyloidosis Treatment Market Revenue Share (%), by Therapy 2025 & 2033
- Figure 10: North America Transthyretin Amyloidosis Treatment Market Volume Share (%), by Therapy 2025 & 2033
- Figure 11: North America Transthyretin Amyloidosis Treatment Market Revenue (Million), by Disease Type 2025 & 2033
- Figure 12: North America Transthyretin Amyloidosis Treatment Market Volume (K Unit), by Disease Type 2025 & 2033
- Figure 13: North America Transthyretin Amyloidosis Treatment Market Revenue Share (%), by Disease Type 2025 & 2033
- Figure 14: North America Transthyretin Amyloidosis Treatment Market Volume Share (%), by Disease Type 2025 & 2033
- Figure 15: North America Transthyretin Amyloidosis Treatment Market Revenue (Million), by Distribution Channel 2025 & 2033
- Figure 16: North America Transthyretin Amyloidosis Treatment Market Volume (K Unit), by Distribution Channel 2025 & 2033
- Figure 17: North America Transthyretin Amyloidosis Treatment Market Revenue Share (%), by Distribution Channel 2025 & 2033
- Figure 18: North America Transthyretin Amyloidosis Treatment Market Volume Share (%), by Distribution Channel 2025 & 2033
- Figure 19: North America Transthyretin Amyloidosis Treatment Market Revenue (Million), by Country 2025 & 2033
- Figure 20: North America Transthyretin Amyloidosis Treatment Market Volume (K Unit), by Country 2025 & 2033
- Figure 21: North America Transthyretin Amyloidosis Treatment Market Revenue Share (%), by Country 2025 & 2033
- Figure 22: North America Transthyretin Amyloidosis Treatment Market Volume Share (%), by Country 2025 & 2033
- Figure 23: Europe Transthyretin Amyloidosis Treatment Market Revenue (Million), by Type 2025 & 2033
- Figure 24: Europe Transthyretin Amyloidosis Treatment Market Volume (K Unit), by Type 2025 & 2033
- Figure 25: Europe Transthyretin Amyloidosis Treatment Market Revenue Share (%), by Type 2025 & 2033
- Figure 26: Europe Transthyretin Amyloidosis Treatment Market Volume Share (%), by Type 2025 & 2033
- Figure 27: Europe Transthyretin Amyloidosis Treatment Market Revenue (Million), by Therapy 2025 & 2033
- Figure 28: Europe Transthyretin Amyloidosis Treatment Market Volume (K Unit), by Therapy 2025 & 2033
- Figure 29: Europe Transthyretin Amyloidosis Treatment Market Revenue Share (%), by Therapy 2025 & 2033
- Figure 30: Europe Transthyretin Amyloidosis Treatment Market Volume Share (%), by Therapy 2025 & 2033
- Figure 31: Europe Transthyretin Amyloidosis Treatment Market Revenue (Million), by Disease Type 2025 & 2033
- Figure 32: Europe Transthyretin Amyloidosis Treatment Market Volume (K Unit), by Disease Type 2025 & 2033
- Figure 33: Europe Transthyretin Amyloidosis Treatment Market Revenue Share (%), by Disease Type 2025 & 2033
- Figure 34: Europe Transthyretin Amyloidosis Treatment Market Volume Share (%), by Disease Type 2025 & 2033
- Figure 35: Europe Transthyretin Amyloidosis Treatment Market Revenue (Million), by Distribution Channel 2025 & 2033
- Figure 36: Europe Transthyretin Amyloidosis Treatment Market Volume (K Unit), by Distribution Channel 2025 & 2033
- Figure 37: Europe Transthyretin Amyloidosis Treatment Market Revenue Share (%), by Distribution Channel 2025 & 2033
- Figure 38: Europe Transthyretin Amyloidosis Treatment Market Volume Share (%), by Distribution Channel 2025 & 2033
- Figure 39: Europe Transthyretin Amyloidosis Treatment Market Revenue (Million), by Country 2025 & 2033
- Figure 40: Europe Transthyretin Amyloidosis Treatment Market Volume (K Unit), by Country 2025 & 2033
- Figure 41: Europe Transthyretin Amyloidosis Treatment Market Revenue Share (%), by Country 2025 & 2033
- Figure 42: Europe Transthyretin Amyloidosis Treatment Market Volume Share (%), by Country 2025 & 2033
- Figure 43: Asia Pacific Transthyretin Amyloidosis Treatment Market Revenue (Million), by Type 2025 & 2033
- Figure 44: Asia Pacific Transthyretin Amyloidosis Treatment Market Volume (K Unit), by Type 2025 & 2033
- Figure 45: Asia Pacific Transthyretin Amyloidosis Treatment Market Revenue Share (%), by Type 2025 & 2033
- Figure 46: Asia Pacific Transthyretin Amyloidosis Treatment Market Volume Share (%), by Type 2025 & 2033
- Figure 47: Asia Pacific Transthyretin Amyloidosis Treatment Market Revenue (Million), by Therapy 2025 & 2033
- Figure 48: Asia Pacific Transthyretin Amyloidosis Treatment Market Volume (K Unit), by Therapy 2025 & 2033
- Figure 49: Asia Pacific Transthyretin Amyloidosis Treatment Market Revenue Share (%), by Therapy 2025 & 2033
- Figure 50: Asia Pacific Transthyretin Amyloidosis Treatment Market Volume Share (%), by Therapy 2025 & 2033
- Figure 51: Asia Pacific Transthyretin Amyloidosis Treatment Market Revenue (Million), by Disease Type 2025 & 2033
- Figure 52: Asia Pacific Transthyretin Amyloidosis Treatment Market Volume (K Unit), by Disease Type 2025 & 2033
- Figure 53: Asia Pacific Transthyretin Amyloidosis Treatment Market Revenue Share (%), by Disease Type 2025 & 2033
- Figure 54: Asia Pacific Transthyretin Amyloidosis Treatment Market Volume Share (%), by Disease Type 2025 & 2033
- Figure 55: Asia Pacific Transthyretin Amyloidosis Treatment Market Revenue (Million), by Distribution Channel 2025 & 2033
- Figure 56: Asia Pacific Transthyretin Amyloidosis Treatment Market Volume (K Unit), by Distribution Channel 2025 & 2033
- Figure 57: Asia Pacific Transthyretin Amyloidosis Treatment Market Revenue Share (%), by Distribution Channel 2025 & 2033
- Figure 58: Asia Pacific Transthyretin Amyloidosis Treatment Market Volume Share (%), by Distribution Channel 2025 & 2033
- Figure 59: Asia Pacific Transthyretin Amyloidosis Treatment Market Revenue (Million), by Country 2025 & 2033
- Figure 60: Asia Pacific Transthyretin Amyloidosis Treatment Market Volume (K Unit), by Country 2025 & 2033
- Figure 61: Asia Pacific Transthyretin Amyloidosis Treatment Market Revenue Share (%), by Country 2025 & 2033
- Figure 62: Asia Pacific Transthyretin Amyloidosis Treatment Market Volume Share (%), by Country 2025 & 2033
- Figure 63: Rest of the World Transthyretin Amyloidosis Treatment Market Revenue (Million), by Type 2025 & 2033
- Figure 64: Rest of the World Transthyretin Amyloidosis Treatment Market Volume (K Unit), by Type 2025 & 2033
- Figure 65: Rest of the World Transthyretin Amyloidosis Treatment Market Revenue Share (%), by Type 2025 & 2033
- Figure 66: Rest of the World Transthyretin Amyloidosis Treatment Market Volume Share (%), by Type 2025 & 2033
- Figure 67: Rest of the World Transthyretin Amyloidosis Treatment Market Revenue (Million), by Therapy 2025 & 2033
- Figure 68: Rest of the World Transthyretin Amyloidosis Treatment Market Volume (K Unit), by Therapy 2025 & 2033
- Figure 69: Rest of the World Transthyretin Amyloidosis Treatment Market Revenue Share (%), by Therapy 2025 & 2033
- Figure 70: Rest of the World Transthyretin Amyloidosis Treatment Market Volume Share (%), by Therapy 2025 & 2033
- Figure 71: Rest of the World Transthyretin Amyloidosis Treatment Market Revenue (Million), by Disease Type 2025 & 2033
- Figure 72: Rest of the World Transthyretin Amyloidosis Treatment Market Volume (K Unit), by Disease Type 2025 & 2033
- Figure 73: Rest of the World Transthyretin Amyloidosis Treatment Market Revenue Share (%), by Disease Type 2025 & 2033
- Figure 74: Rest of the World Transthyretin Amyloidosis Treatment Market Volume Share (%), by Disease Type 2025 & 2033
- Figure 75: Rest of the World Transthyretin Amyloidosis Treatment Market Revenue (Million), by Distribution Channel 2025 & 2033
- Figure 76: Rest of the World Transthyretin Amyloidosis Treatment Market Volume (K Unit), by Distribution Channel 2025 & 2033
- Figure 77: Rest of the World Transthyretin Amyloidosis Treatment Market Revenue Share (%), by Distribution Channel 2025 & 2033
- Figure 78: Rest of the World Transthyretin Amyloidosis Treatment Market Volume Share (%), by Distribution Channel 2025 & 2033
- Figure 79: Rest of the World Transthyretin Amyloidosis Treatment Market Revenue (Million), by Country 2025 & 2033
- Figure 80: Rest of the World Transthyretin Amyloidosis Treatment Market Volume (K Unit), by Country 2025 & 2033
- Figure 81: Rest of the World Transthyretin Amyloidosis Treatment Market Revenue Share (%), by Country 2025 & 2033
- Figure 82: Rest of the World Transthyretin Amyloidosis Treatment Market Volume Share (%), by Country 2025 & 2033
List of Tables
- Table 1: Global Transthyretin Amyloidosis Treatment Market Revenue Million Forecast, by Type 2020 & 2033
- Table 2: Global Transthyretin Amyloidosis Treatment Market Volume K Unit Forecast, by Type 2020 & 2033
- Table 3: Global Transthyretin Amyloidosis Treatment Market Revenue Million Forecast, by Therapy 2020 & 2033
- Table 4: Global Transthyretin Amyloidosis Treatment Market Volume K Unit Forecast, by Therapy 2020 & 2033
- Table 5: Global Transthyretin Amyloidosis Treatment Market Revenue Million Forecast, by Disease Type 2020 & 2033
- Table 6: Global Transthyretin Amyloidosis Treatment Market Volume K Unit Forecast, by Disease Type 2020 & 2033
- Table 7: Global Transthyretin Amyloidosis Treatment Market Revenue Million Forecast, by Distribution Channel 2020 & 2033
- Table 8: Global Transthyretin Amyloidosis Treatment Market Volume K Unit Forecast, by Distribution Channel 2020 & 2033
- Table 9: Global Transthyretin Amyloidosis Treatment Market Revenue Million Forecast, by Region 2020 & 2033
- Table 10: Global Transthyretin Amyloidosis Treatment Market Volume K Unit Forecast, by Region 2020 & 2033
- Table 11: Global Transthyretin Amyloidosis Treatment Market Revenue Million Forecast, by Type 2020 & 2033
- Table 12: Global Transthyretin Amyloidosis Treatment Market Volume K Unit Forecast, by Type 2020 & 2033
- Table 13: Global Transthyretin Amyloidosis Treatment Market Revenue Million Forecast, by Therapy 2020 & 2033
- Table 14: Global Transthyretin Amyloidosis Treatment Market Volume K Unit Forecast, by Therapy 2020 & 2033
- Table 15: Global Transthyretin Amyloidosis Treatment Market Revenue Million Forecast, by Disease Type 2020 & 2033
- Table 16: Global Transthyretin Amyloidosis Treatment Market Volume K Unit Forecast, by Disease Type 2020 & 2033
- Table 17: Global Transthyretin Amyloidosis Treatment Market Revenue Million Forecast, by Distribution Channel 2020 & 2033
- Table 18: Global Transthyretin Amyloidosis Treatment Market Volume K Unit Forecast, by Distribution Channel 2020 & 2033
- Table 19: Global Transthyretin Amyloidosis Treatment Market Revenue Million Forecast, by Country 2020 & 2033
- Table 20: Global Transthyretin Amyloidosis Treatment Market Volume K Unit Forecast, by Country 2020 & 2033
- Table 21: United States Transthyretin Amyloidosis Treatment Market Revenue (Million) Forecast, by Application 2020 & 2033
- Table 22: United States Transthyretin Amyloidosis Treatment Market Volume (K Unit) Forecast, by Application 2020 & 2033
- Table 23: Canada Transthyretin Amyloidosis Treatment Market Revenue (Million) Forecast, by Application 2020 & 2033
- Table 24: Canada Transthyretin Amyloidosis Treatment Market Volume (K Unit) Forecast, by Application 2020 & 2033
- Table 25: Mexico Transthyretin Amyloidosis Treatment Market Revenue (Million) Forecast, by Application 2020 & 2033
- Table 26: Mexico Transthyretin Amyloidosis Treatment Market Volume (K Unit) Forecast, by Application 2020 & 2033
- Table 27: Global Transthyretin Amyloidosis Treatment Market Revenue Million Forecast, by Type 2020 & 2033
- Table 28: Global Transthyretin Amyloidosis Treatment Market Volume K Unit Forecast, by Type 2020 & 2033
- Table 29: Global Transthyretin Amyloidosis Treatment Market Revenue Million Forecast, by Therapy 2020 & 2033
- Table 30: Global Transthyretin Amyloidosis Treatment Market Volume K Unit Forecast, by Therapy 2020 & 2033
- Table 31: Global Transthyretin Amyloidosis Treatment Market Revenue Million Forecast, by Disease Type 2020 & 2033
- Table 32: Global Transthyretin Amyloidosis Treatment Market Volume K Unit Forecast, by Disease Type 2020 & 2033
- Table 33: Global Transthyretin Amyloidosis Treatment Market Revenue Million Forecast, by Distribution Channel 2020 & 2033
- Table 34: Global Transthyretin Amyloidosis Treatment Market Volume K Unit Forecast, by Distribution Channel 2020 & 2033
- Table 35: Global Transthyretin Amyloidosis Treatment Market Revenue Million Forecast, by Country 2020 & 2033
- Table 36: Global Transthyretin Amyloidosis Treatment Market Volume K Unit Forecast, by Country 2020 & 2033
- Table 37: Germany Transthyretin Amyloidosis Treatment Market Revenue (Million) Forecast, by Application 2020 & 2033
- Table 38: Germany Transthyretin Amyloidosis Treatment Market Volume (K Unit) Forecast, by Application 2020 & 2033
- Table 39: United Kingdom Transthyretin Amyloidosis Treatment Market Revenue (Million) Forecast, by Application 2020 & 2033
- Table 40: United Kingdom Transthyretin Amyloidosis Treatment Market Volume (K Unit) Forecast, by Application 2020 & 2033
- Table 41: France Transthyretin Amyloidosis Treatment Market Revenue (Million) Forecast, by Application 2020 & 2033
- Table 42: France Transthyretin Amyloidosis Treatment Market Volume (K Unit) Forecast, by Application 2020 & 2033
- Table 43: Italy Transthyretin Amyloidosis Treatment Market Revenue (Million) Forecast, by Application 2020 & 2033
- Table 44: Italy Transthyretin Amyloidosis Treatment Market Volume (K Unit) Forecast, by Application 2020 & 2033
- Table 45: Spain Transthyretin Amyloidosis Treatment Market Revenue (Million) Forecast, by Application 2020 & 2033
- Table 46: Spain Transthyretin Amyloidosis Treatment Market Volume (K Unit) Forecast, by Application 2020 & 2033
- Table 47: Rest of Europe Transthyretin Amyloidosis Treatment Market Revenue (Million) Forecast, by Application 2020 & 2033
- Table 48: Rest of Europe Transthyretin Amyloidosis Treatment Market Volume (K Unit) Forecast, by Application 2020 & 2033
- Table 49: Global Transthyretin Amyloidosis Treatment Market Revenue Million Forecast, by Type 2020 & 2033
- Table 50: Global Transthyretin Amyloidosis Treatment Market Volume K Unit Forecast, by Type 2020 & 2033
- Table 51: Global Transthyretin Amyloidosis Treatment Market Revenue Million Forecast, by Therapy 2020 & 2033
- Table 52: Global Transthyretin Amyloidosis Treatment Market Volume K Unit Forecast, by Therapy 2020 & 2033
- Table 53: Global Transthyretin Amyloidosis Treatment Market Revenue Million Forecast, by Disease Type 2020 & 2033
- Table 54: Global Transthyretin Amyloidosis Treatment Market Volume K Unit Forecast, by Disease Type 2020 & 2033
- Table 55: Global Transthyretin Amyloidosis Treatment Market Revenue Million Forecast, by Distribution Channel 2020 & 2033
- Table 56: Global Transthyretin Amyloidosis Treatment Market Volume K Unit Forecast, by Distribution Channel 2020 & 2033
- Table 57: Global Transthyretin Amyloidosis Treatment Market Revenue Million Forecast, by Country 2020 & 2033
- Table 58: Global Transthyretin Amyloidosis Treatment Market Volume K Unit Forecast, by Country 2020 & 2033
- Table 59: China Transthyretin Amyloidosis Treatment Market Revenue (Million) Forecast, by Application 2020 & 2033
- Table 60: China Transthyretin Amyloidosis Treatment Market Volume (K Unit) Forecast, by Application 2020 & 2033
- Table 61: Japan Transthyretin Amyloidosis Treatment Market Revenue (Million) Forecast, by Application 2020 & 2033
- Table 62: Japan Transthyretin Amyloidosis Treatment Market Volume (K Unit) Forecast, by Application 2020 & 2033
- Table 63: India Transthyretin Amyloidosis Treatment Market Revenue (Million) Forecast, by Application 2020 & 2033
- Table 64: India Transthyretin Amyloidosis Treatment Market Volume (K Unit) Forecast, by Application 2020 & 2033
- Table 65: Australia Transthyretin Amyloidosis Treatment Market Revenue (Million) Forecast, by Application 2020 & 2033
- Table 66: Australia Transthyretin Amyloidosis Treatment Market Volume (K Unit) Forecast, by Application 2020 & 2033
- Table 67: South Korea Transthyretin Amyloidosis Treatment Market Revenue (Million) Forecast, by Application 2020 & 2033
- Table 68: South Korea Transthyretin Amyloidosis Treatment Market Volume (K Unit) Forecast, by Application 2020 & 2033
- Table 69: Rest of Asia Pacific Transthyretin Amyloidosis Treatment Market Revenue (Million) Forecast, by Application 2020 & 2033
- Table 70: Rest of Asia Pacific Transthyretin Amyloidosis Treatment Market Volume (K Unit) Forecast, by Application 2020 & 2033
- Table 71: Global Transthyretin Amyloidosis Treatment Market Revenue Million Forecast, by Type 2020 & 2033
- Table 72: Global Transthyretin Amyloidosis Treatment Market Volume K Unit Forecast, by Type 2020 & 2033
- Table 73: Global Transthyretin Amyloidosis Treatment Market Revenue Million Forecast, by Therapy 2020 & 2033
- Table 74: Global Transthyretin Amyloidosis Treatment Market Volume K Unit Forecast, by Therapy 2020 & 2033
- Table 75: Global Transthyretin Amyloidosis Treatment Market Revenue Million Forecast, by Disease Type 2020 & 2033
- Table 76: Global Transthyretin Amyloidosis Treatment Market Volume K Unit Forecast, by Disease Type 2020 & 2033
- Table 77: Global Transthyretin Amyloidosis Treatment Market Revenue Million Forecast, by Distribution Channel 2020 & 2033
- Table 78: Global Transthyretin Amyloidosis Treatment Market Volume K Unit Forecast, by Distribution Channel 2020 & 2033
- Table 79: Global Transthyretin Amyloidosis Treatment Market Revenue Million Forecast, by Country 2020 & 2033
- Table 80: Global Transthyretin Amyloidosis Treatment Market Volume K Unit Forecast, by Country 2020 & 2033
Frequently Asked Questions
1. What is the projected Compound Annual Growth Rate (CAGR) of the Transthyretin Amyloidosis Treatment Market?
The projected CAGR is approximately 15.40%.
2. Which companies are prominent players in the Transthyretin Amyloidosis Treatment Market?
Key companies in the market include Pfizer Inc, Prothena, SOM BIOTECH, Takeda Pharmaceutical Company Limited, BridgeBio Inc, Millennium Pharmaceuticals, Alnylam Pharmaceuticals Inc, Ionis Pharmaceuticals, Oncopeptides, Corino Therapeutics Inc, Alexion Pharmaceuticals, Intellia Therapeutics Inc.
3. What are the main segments of the Transthyretin Amyloidosis Treatment Market?
The market segments include Type, Therapy, Disease Type, Distribution Channel.
4. Can you provide details about the market size?
The market size is estimated to be USD 5.30 Million as of 2022.
5. What are some drivers contributing to market growth?
Growing Geriatric Population and Risk Factors for Amyloid Light Chain (AL); Increasing Research and Development (R&D) and Growing Disease Awareness.
6. What are the notable trends driving market growth?
The Hereditary Transthyretin Amyloidosis Segment is Expected to Hold a Significant Share Over the Forecast Period.
7. Are there any restraints impacting market growth?
High Cost Associated with the Transthyretin Amyloidosis Treatment.
8. Can you provide examples of recent developments in the market?
April 2024: Alexion, a collaboration partner of Neurimmune and AstraZeneca’s Rare Disease group, initiated the Phase 3 DepleTTR-CM clinical study to assess the efficacy and safety of ALXN2220 for the treatment of transthyretin-mediated amyloid cardiomyopathy (ATTR-CM).
9. What pricing options are available for accessing the report?
Pricing options include single-user, multi-user, and enterprise licenses priced at USD 4750, USD 5250, and USD 8750 respectively.
10. Is the market size provided in terms of value or volume?
The market size is provided in terms of value, measured in Million and volume, measured in K Unit.
11. Are there any specific market keywords associated with the report?
Yes, the market keyword associated with the report is "Transthyretin Amyloidosis Treatment Market," which aids in identifying and referencing the specific market segment covered.
12. How do I determine which pricing option suits my needs best?
The pricing options vary based on user requirements and access needs. Individual users may opt for single-user licenses, while businesses requiring broader access may choose multi-user or enterprise licenses for cost-effective access to the report.
13. Are there any additional resources or data provided in the Transthyretin Amyloidosis Treatment Market report?
While the report offers comprehensive insights, it's advisable to review the specific contents or supplementary materials provided to ascertain if additional resources or data are available.
14. How can I stay updated on further developments or reports in the Transthyretin Amyloidosis Treatment Market?
To stay informed about further developments, trends, and reports in the Transthyretin Amyloidosis Treatment Market, consider subscribing to industry newsletters, following relevant companies and organizations, or regularly checking reputable industry news sources and publications.
Methodology
Step 1 - Identification of Relevant Samples Size from Population Database


Step 2 - Approaches for Defining Global Market Size (Value, Volume* & Price*)

Note*: In applicable scenarios
Step 3 - Data Sources
Primary Research
- Web Analytics
- Survey Reports
- Research Institute
- Latest Research Reports
- Opinion Leaders
Secondary Research
- Annual Reports
- White Paper
- Latest Press Release
- Industry Association
- Paid Database
- Investor Presentations

Step 4 - Data Triangulation
Involves using different sources of information in order to increase the validity of a study
These sources are likely to be stakeholders in a program - participants, other researchers, program staff, other community members, and so on.
Then we put all data in single framework & apply various statistical tools to find out the dynamic on the market.
During the analysis stage, feedback from the stakeholder groups would be compared to determine areas of agreement as well as areas of divergence