

Key Insights
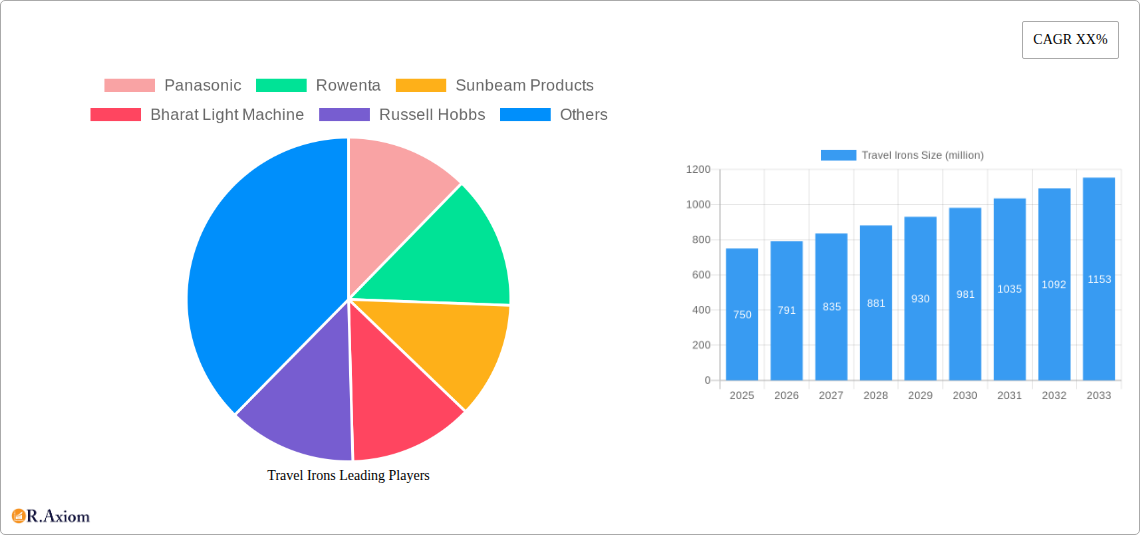
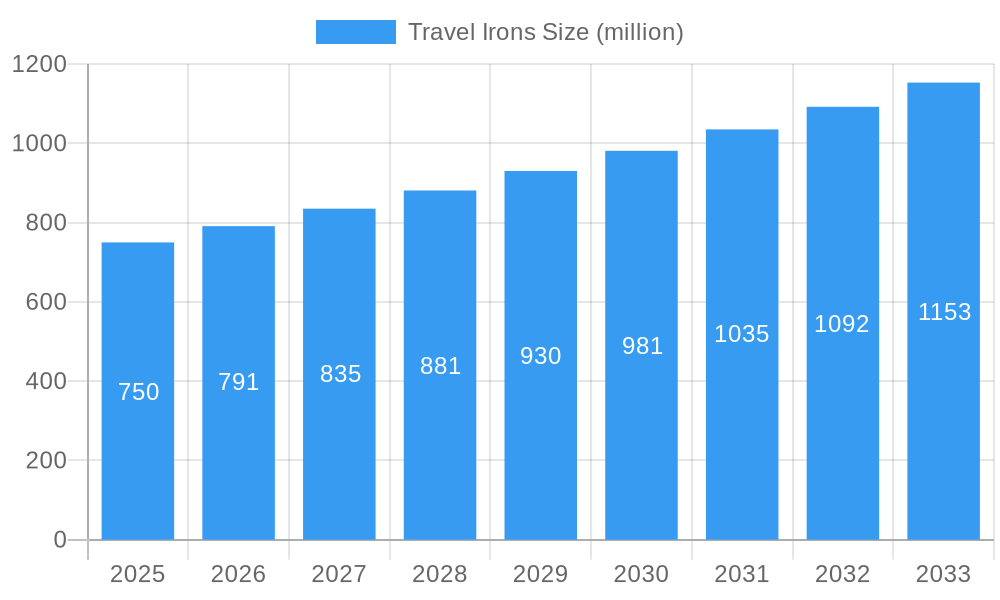
The global travel irons market is experiencing robust growth, projected to reach an estimated market size of $750 million in 2025, with a Compound Annual Growth Rate (CAGR) of 5.5% anticipated over the forecast period of 2025-2033. This expansion is primarily driven by the escalating volume of international and domestic travel, fueled by a growing middle class and increased disposable incomes worldwide. The convenience and portability offered by compact, lightweight travel irons make them indispensable for modern globetrotters and business travelers alike, ensuring a polished appearance on the go. The "Less Than 1LB" segment is expected to dominate, reflecting consumer preference for ultra-lightweight and space-saving travel accessories. Leading market players such as Panasonic, Rowenta, and Russell Hobbs are continuously innovating, introducing irons with advanced features like dual voltage compatibility, steam functions, and non-stick soleplates to cater to diverse traveler needs.
Travel Irons Market Size (In Million)
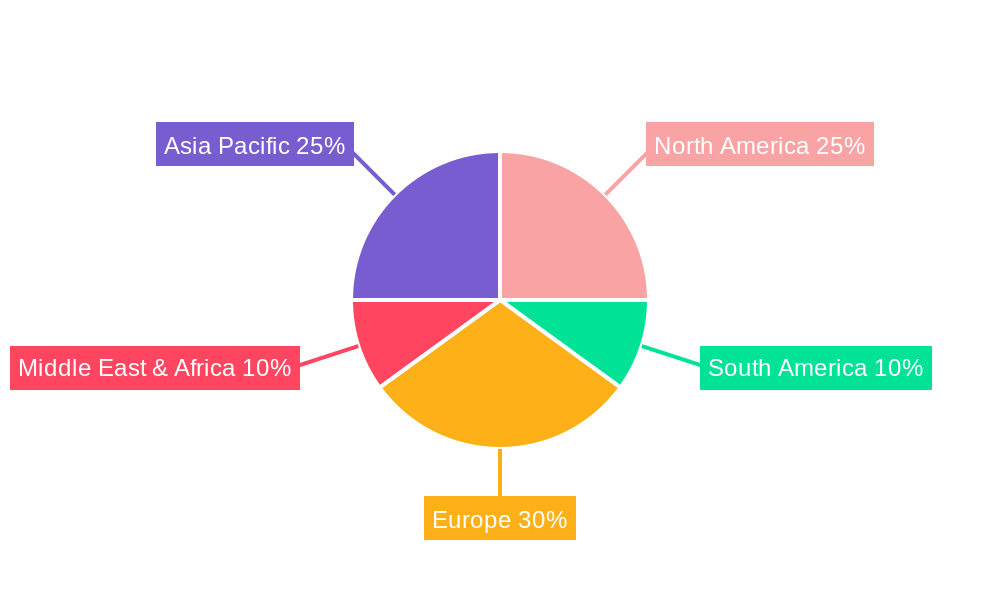
Further propelling the market are evolving consumer lifestyles and the increasing emphasis on personal grooming and presentation, even when away from home. The "Specialty Retailers" and "Department Stores" segments are anticipated to witness significant sales, as these channels effectively reach consumers seeking premium and specialized travel accessories. While the market shows strong upward momentum, certain restraints, such as the growing popularity of wrinkle-release sprays and the increasing prevalence of hotel amenities that include ironing facilities, could pose challenges. However, the inherent convenience and personal control offered by a dedicated travel iron are expected to maintain its appeal. Asia Pacific, led by China and India, is emerging as a high-growth region due to its burgeoning travel industry and a rapidly expanding consumer base actively seeking convenient travel solutions.
Travel Irons Company Market Share
Travel Irons Market Concentration & Innovation
The global travel irons market exhibits a moderate concentration, with key players like Panasonic, Rowenta, Sunbeam Products, Bharat Light Machine, Russell Hobbs, and Smartek holding substantial market share, estimated to be in the range of 700 million to 900 million USD. Innovation is a critical differentiator, driven by demand for compact, lightweight, and energy-efficient designs. Manufacturers are increasingly incorporating advanced features such as dual voltage functionality, steam boost capabilities, and durable ceramic or non-stick soleplates to cater to globetrotters' evolving needs. Regulatory frameworks, while generally favorable, focus on safety standards and energy efficiency, with compliance being a non-negotiable for market entry. Product substitutes, such as portable garment steamers and wrinkle-release sprays, pose a growing challenge, though travel irons retain their core advantage in immediate crease removal. End-user trends highlight a preference for user-friendly operation, portability, and aesthetic appeal, with younger demographics and frequent business travelers driving demand. Mergers and acquisitions (M&A) activities, though not hyperactive, are strategically focused on consolidating market presence and acquiring innovative technologies. Estimated M&A deal values are projected to be between 50 million to 100 million USD in key transactions.
Travel Irons Industry Trends & Insights
The travel irons market is poised for steady growth, projected to expand at a Compound Annual Growth Rate (CAGR) of approximately 4.5% to 6.0% over the forecast period of 2025–2033. This growth is propelled by several interconnected factors. The resurgence of global tourism and business travel post-pandemic is a primary market growth driver, with an estimated 1.5 billion international tourist arrivals projected annually by 2025. Technological disruptions are a significant force, with manufacturers investing heavily in research and development to introduce smarter, more efficient irons. Innovations in materials science are leading to lighter yet more durable designs, while advancements in heating elements ensure faster heat-up times and consistent performance. Consumer preferences are increasingly leaning towards personalized travel experiences, influencing the demand for compact, multi-functional, and aesthetically pleasing travel accessories. Market penetration of advanced travel iron features, such as cordless designs and integrated water tanks, is expected to rise significantly. The competitive landscape is characterized by a dynamic interplay between established brands and emerging players, each vying for market share through product differentiation, strategic pricing, and effective distribution channels. The market penetration of travel irons in households is currently around 400 million units and is expected to grow steadily. Economic factors, including rising disposable incomes in emerging economies and a general increase in consumer spending on travel-related products, also contribute to the positive outlook. The total market size is estimated to reach over 2,000 million USD by 2033.
Dominant Markets & Segments in Travel Irons
Dominant Region: North America currently holds a dominant position in the global travel irons market, driven by a high propensity for travel, both for leisure and business, and a strong consumer preference for convenience and quality. The region's robust economic indicators, with a GDP exceeding 25 trillion USD, support significant consumer spending on travel accessories.
- Key Drivers in North America:
- Economic Policies: Favorable trade policies and consumer protection laws foster market growth and consumer confidence.
- Infrastructure: Well-developed travel infrastructure, including extensive air and road networks, facilitates frequent travel.
- Consumer Lifestyle: A culture of frequent travel, both domestic and international, creates a consistent demand for portable solutions.
Dominant Country: The United States stands out as the leading country within North America, accounting for an estimated 30% of the global travel iron market share. This dominance is attributed to a large, affluent population, a significant number of frequent business travelers, and a well-established retail ecosystem.
Dominant Application Segments:
- Specialty Retailers: These channels, including travel goods stores and electronics retailers, command a significant market share due to their focused product offerings and ability to cater to niche consumer needs. They offer a curated selection of travel irons with an estimated 30% market share.
- Department Stores: Traditional department stores continue to be important distribution points, leveraging their broad customer base and established brand presence. They contribute around 25% to the market share.
- Supermarkets and Hypermarkets: While not traditionally a primary channel for travel irons, their growing presence in electronics and home goods sections is increasing their contribution, with an estimated 20% market share.
- Discount Stores: These outlets attract price-sensitive consumers, offering value-oriented travel irons and contributing approximately 15% to the market share.
Dominant Type Segments:
- Less Than 1LB: This segment is experiencing rapid growth due to the increasing emphasis on portability and lightweight travel gear. Consumers are actively seeking compact solutions that minimize luggage weight. This segment holds an estimated 60% market share.
- Key Drivers: Airline weight restrictions, demand for carry-on only travel, and increased focus on minimalist packing.
- Above 1LB: While still significant, this segment is seeing slower growth compared to its lighter counterparts. These irons often offer more robust features and larger water capacities, appealing to travelers who prioritize performance over extreme portability. This segment accounts for the remaining 40% market share.
- Key Drivers: Travelers requiring more intensive ironing, longer stays, and a preference for traditional iron functionalities.
Travel Irons Product Developments
Recent product developments in the travel irons market focus on enhancing user convenience and portability. Innovations include ultra-compact folding designs, dual voltage capabilities for international travel, and advanced soleplate materials like ceramic and titanium for superior glide and durability. Smart features, such as anti-drip systems and variable steam settings, are becoming increasingly common. Competitive advantages are being carved out through lighter materials, longer power cords, and faster heat-up times. The integration of travel pouches and accessories further enhances market appeal.
Report Scope & Segmentation Analysis
The global travel irons market is segmented by Application and Type. The Application segments include Specialty Retailers, Department Stores, Supermarkets and Hypermarkets, and Discount Stores, each contributing differently to market reach and sales volume. Specialty Retailers are projected to see a steady growth of 5% CAGR due to their targeted customer base. Department Stores are expected to grow at 4% CAGR, leveraging their broad appeal. Supermarkets and Hypermarkets are anticipated to experience a higher growth rate of 6% CAGR as they expand their electronics offerings. Discount Stores will likely grow at 4.5% CAGR, catering to budget-conscious travelers.
The Type segmentation encompasses Less Than 1LB and Above 1LB travel irons. The Less Than 1LB segment is projected to dominate, exhibiting a CAGR of 6.5% over the forecast period, driven by the increasing demand for ultra-portable travel essentials. The Above 1LB segment is estimated to grow at a more moderate CAGR of 3.5%, appealing to consumers who prioritize power and features. The market size for the Less Than 1LB segment is expected to reach over 1,500 million USD by 2033.
Key Drivers of Travel Irons Growth
The travel irons market is propelled by several key growth drivers. Firstly, the continuous rebound in global tourism and business travel activities fuels demand for portable garment care solutions, with international travel projected to reach pre-pandemic levels and beyond. Secondly, technological advancements are leading to the development of lighter, more compact, and energy-efficient travel irons, appealing to the modern traveler. This includes innovations in materials and heating technologies. Thirdly, rising disposable incomes in emerging economies are enabling more consumers to afford travel and related accessories. Finally, evolving consumer preferences for convenience and well-maintained appearances during travel are significant economic and lifestyle factors.
Challenges in the Travel Irons Sector
Despite the positive growth trajectory, the travel irons sector faces several challenges. Regulatory hurdles, particularly concerning electrical safety standards and certifications in different regions, can increase product development costs and time-to-market. Supply chain disruptions, as witnessed in recent years, can impact manufacturing efficiency and component availability, leading to price volatility. Intense competition from established brands and new entrants, especially in the lower price segments, exerts downward pressure on profit margins. The increasing adoption of garment steamers as an alternative presents a direct competitive threat, offering a different approach to wrinkle removal.
Emerging Opportunities in Travel Irons
Emerging opportunities in the travel irons sector lie in several key areas. The growing demand for sustainable and eco-friendly products presents an opportunity for manufacturers to develop energy-efficient travel irons with reduced environmental impact. The expansion of the e-commerce channel offers a direct route to consumers globally, bypassing traditional retail limitations and enabling targeted marketing efforts. Innovations in smart technology, such as app connectivity for temperature control or diagnostic features, could cater to a tech-savvy consumer base. Furthermore, the increasing popularity of short-term rental accommodations and co-living spaces might create a demand for compact, personal garment care devices.
Leading Players in the Travel Irons Market
- Panasonic
- Rowenta
- Sunbeam Products
- Bharat Light Machine
- Russell Hobbs
- Smartek
Key Developments in Travel Irons Industry
- 2023/11: Launch of ultra-lightweight travel irons with enhanced portability by major manufacturers, focusing on airline cabin baggage regulations.
- 2023/09: Increased investment in research and development for cordless travel iron technology, aiming to offer greater freedom of movement.
- 2023/07: Strategic partnerships between travel iron brands and luggage manufacturers to offer bundled travel accessory solutions.
- 2022/12: Introduction of travel irons with advanced steam generation capabilities to tackle stubborn wrinkles more effectively.
- 2022/10: Focus on incorporating more recycled materials in product design and packaging to cater to eco-conscious consumers.
Strategic Outlook for Travel Irons Market
The strategic outlook for the travel irons market remains robust, driven by persistent global travel trends and ongoing technological innovation. Manufacturers are advised to focus on product differentiation through enhanced portability, advanced features, and sustainable design. Expanding distribution channels to include a strong online presence and exploring strategic partnerships will be crucial for market penetration. Addressing consumer demand for convenience and efficiency through user-friendly interfaces and faster performance will solidify market positions. The market is set for continued growth as travelers prioritize looking their best while on the go.
Travel Irons Segmentation
-
1. Application
- 1.1. Specialty Retailers
- 1.2. Department Stores
- 1.3. Supermarkets and Hypermarkets
- 1.4. Discount Stores
-
2. Types
- 2.1. Less Than 1LB
- 2.2. Above 1LB
Travel Irons Segmentation By Geography
-
1. North America
- 1.1. United States
- 1.2. Canada
- 1.3. Mexico
-
2. South America
- 2.1. Brazil
- 2.2. Argentina
- 2.3. Rest of South America
-
3. Europe
- 3.1. United Kingdom
- 3.2. Germany
- 3.3. France
- 3.4. Italy
- 3.5. Spain
- 3.6. Russia
- 3.7. Benelux
- 3.8. Nordics
- 3.9. Rest of Europe
-
4. Middle East & Africa
- 4.1. Turkey
- 4.2. Israel
- 4.3. GCC
- 4.4. North Africa
- 4.5. South Africa
- 4.6. Rest of Middle East & Africa
-
5. Asia Pacific
- 5.1. China
- 5.2. India
- 5.3. Japan
- 5.4. South Korea
- 5.5. ASEAN
- 5.6. Oceania
- 5.7. Rest of Asia Pacific
Travel Irons Regional Market Share
Geographic Coverage of Travel Irons
Travel Irons REPORT HIGHLIGHTS
| Aspects | Details |
|---|---|
| Study Period | 2020-2034 |
| Base Year | 2025 |
| Estimated Year | 2026 |
| Forecast Period | 2026-2034 |
| Historical Period | 2020-2025 |
| Growth Rate | CAGR of 16.99% from 2020-2034 |
| Segmentation |
|
Table of Contents
- 1. Introduction
- 1.1. Research Scope
- 1.2. Market Segmentation
- 1.3. Research Methodology
- 1.4. Definitions and Assumptions
- 2. Executive Summary
- 2.1. Introduction
- 3. Market Dynamics
- 3.1. Introduction
- 3.2. Market Drivers
- 3.3. Market Restrains
- 3.4. Market Trends
- 4. Market Factor Analysis
- 4.1. Porters Five Forces
- 4.2. Supply/Value Chain
- 4.3. PESTEL analysis
- 4.4. Market Entropy
- 4.5. Patent/Trademark Analysis
- 5. Global Travel Irons Analysis, Insights and Forecast, 2020-2032
- 5.1. Market Analysis, Insights and Forecast - by Application
- 5.1.1. Specialty Retailers
- 5.1.2. Department Stores
- 5.1.3. Supermarkets and Hypermarkets
- 5.1.4. Discount Stores
- 5.2. Market Analysis, Insights and Forecast - by Types
- 5.2.1. Less Than 1LB
- 5.2.2. Above 1LB
- 5.3. Market Analysis, Insights and Forecast - by Region
- 5.3.1. North America
- 5.3.2. South America
- 5.3.3. Europe
- 5.3.4. Middle East & Africa
- 5.3.5. Asia Pacific
- 5.1. Market Analysis, Insights and Forecast - by Application
- 6. North America Travel Irons Analysis, Insights and Forecast, 2020-2032
- 6.1. Market Analysis, Insights and Forecast - by Application
- 6.1.1. Specialty Retailers
- 6.1.2. Department Stores
- 6.1.3. Supermarkets and Hypermarkets
- 6.1.4. Discount Stores
- 6.2. Market Analysis, Insights and Forecast - by Types
- 6.2.1. Less Than 1LB
- 6.2.2. Above 1LB
- 6.1. Market Analysis, Insights and Forecast - by Application
- 7. South America Travel Irons Analysis, Insights and Forecast, 2020-2032
- 7.1. Market Analysis, Insights and Forecast - by Application
- 7.1.1. Specialty Retailers
- 7.1.2. Department Stores
- 7.1.3. Supermarkets and Hypermarkets
- 7.1.4. Discount Stores
- 7.2. Market Analysis, Insights and Forecast - by Types
- 7.2.1. Less Than 1LB
- 7.2.2. Above 1LB
- 7.1. Market Analysis, Insights and Forecast - by Application
- 8. Europe Travel Irons Analysis, Insights and Forecast, 2020-2032
- 8.1. Market Analysis, Insights and Forecast - by Application
- 8.1.1. Specialty Retailers
- 8.1.2. Department Stores
- 8.1.3. Supermarkets and Hypermarkets
- 8.1.4. Discount Stores
- 8.2. Market Analysis, Insights and Forecast - by Types
- 8.2.1. Less Than 1LB
- 8.2.2. Above 1LB
- 8.1. Market Analysis, Insights and Forecast - by Application
- 9. Middle East & Africa Travel Irons Analysis, Insights and Forecast, 2020-2032
- 9.1. Market Analysis, Insights and Forecast - by Application
- 9.1.1. Specialty Retailers
- 9.1.2. Department Stores
- 9.1.3. Supermarkets and Hypermarkets
- 9.1.4. Discount Stores
- 9.2. Market Analysis, Insights and Forecast - by Types
- 9.2.1. Less Than 1LB
- 9.2.2. Above 1LB
- 9.1. Market Analysis, Insights and Forecast - by Application
- 10. Asia Pacific Travel Irons Analysis, Insights and Forecast, 2020-2032
- 10.1. Market Analysis, Insights and Forecast - by Application
- 10.1.1. Specialty Retailers
- 10.1.2. Department Stores
- 10.1.3. Supermarkets and Hypermarkets
- 10.1.4. Discount Stores
- 10.2. Market Analysis, Insights and Forecast - by Types
- 10.2.1. Less Than 1LB
- 10.2.2. Above 1LB
- 10.1. Market Analysis, Insights and Forecast - by Application
- 11. Competitive Analysis
- 11.1. Global Market Share Analysis 2025
- 11.2. Company Profiles
- 11.2.1 Panasonic
- 11.2.1.1. Overview
- 11.2.1.2. Products
- 11.2.1.3. SWOT Analysis
- 11.2.1.4. Recent Developments
- 11.2.1.5. Financials (Based on Availability)
- 11.2.2 Rowenta
- 11.2.2.1. Overview
- 11.2.2.2. Products
- 11.2.2.3. SWOT Analysis
- 11.2.2.4. Recent Developments
- 11.2.2.5. Financials (Based on Availability)
- 11.2.3 Sunbeam Products
- 11.2.3.1. Overview
- 11.2.3.2. Products
- 11.2.3.3. SWOT Analysis
- 11.2.3.4. Recent Developments
- 11.2.3.5. Financials (Based on Availability)
- 11.2.4 Bharat Light Machine
- 11.2.4.1. Overview
- 11.2.4.2. Products
- 11.2.4.3. SWOT Analysis
- 11.2.4.4. Recent Developments
- 11.2.4.5. Financials (Based on Availability)
- 11.2.5 Russell Hobbs
- 11.2.5.1. Overview
- 11.2.5.2. Products
- 11.2.5.3. SWOT Analysis
- 11.2.5.4. Recent Developments
- 11.2.5.5. Financials (Based on Availability)
- 11.2.6 Smartek
- 11.2.6.1. Overview
- 11.2.6.2. Products
- 11.2.6.3. SWOT Analysis
- 11.2.6.4. Recent Developments
- 11.2.6.5. Financials (Based on Availability)
- 11.2.1 Panasonic
List of Figures
- Figure 1: Global Travel Irons Revenue Breakdown (undefined, %) by Region 2025 & 2033
- Figure 2: Global Travel Irons Volume Breakdown (K, %) by Region 2025 & 2033
- Figure 3: North America Travel Irons Revenue (undefined), by Application 2025 & 2033
- Figure 4: North America Travel Irons Volume (K), by Application 2025 & 2033
- Figure 5: North America Travel Irons Revenue Share (%), by Application 2025 & 2033
- Figure 6: North America Travel Irons Volume Share (%), by Application 2025 & 2033
- Figure 7: North America Travel Irons Revenue (undefined), by Types 2025 & 2033
- Figure 8: North America Travel Irons Volume (K), by Types 2025 & 2033
- Figure 9: North America Travel Irons Revenue Share (%), by Types 2025 & 2033
- Figure 10: North America Travel Irons Volume Share (%), by Types 2025 & 2033
- Figure 11: North America Travel Irons Revenue (undefined), by Country 2025 & 2033
- Figure 12: North America Travel Irons Volume (K), by Country 2025 & 2033
- Figure 13: North America Travel Irons Revenue Share (%), by Country 2025 & 2033
- Figure 14: North America Travel Irons Volume Share (%), by Country 2025 & 2033
- Figure 15: South America Travel Irons Revenue (undefined), by Application 2025 & 2033
- Figure 16: South America Travel Irons Volume (K), by Application 2025 & 2033
- Figure 17: South America Travel Irons Revenue Share (%), by Application 2025 & 2033
- Figure 18: South America Travel Irons Volume Share (%), by Application 2025 & 2033
- Figure 19: South America Travel Irons Revenue (undefined), by Types 2025 & 2033
- Figure 20: South America Travel Irons Volume (K), by Types 2025 & 2033
- Figure 21: South America Travel Irons Revenue Share (%), by Types 2025 & 2033
- Figure 22: South America Travel Irons Volume Share (%), by Types 2025 & 2033
- Figure 23: South America Travel Irons Revenue (undefined), by Country 2025 & 2033
- Figure 24: South America Travel Irons Volume (K), by Country 2025 & 2033
- Figure 25: South America Travel Irons Revenue Share (%), by Country 2025 & 2033
- Figure 26: South America Travel Irons Volume Share (%), by Country 2025 & 2033
- Figure 27: Europe Travel Irons Revenue (undefined), by Application 2025 & 2033
- Figure 28: Europe Travel Irons Volume (K), by Application 2025 & 2033
- Figure 29: Europe Travel Irons Revenue Share (%), by Application 2025 & 2033
- Figure 30: Europe Travel Irons Volume Share (%), by Application 2025 & 2033
- Figure 31: Europe Travel Irons Revenue (undefined), by Types 2025 & 2033
- Figure 32: Europe Travel Irons Volume (K), by Types 2025 & 2033
- Figure 33: Europe Travel Irons Revenue Share (%), by Types 2025 & 2033
- Figure 34: Europe Travel Irons Volume Share (%), by Types 2025 & 2033
- Figure 35: Europe Travel Irons Revenue (undefined), by Country 2025 & 2033
- Figure 36: Europe Travel Irons Volume (K), by Country 2025 & 2033
- Figure 37: Europe Travel Irons Revenue Share (%), by Country 2025 & 2033
- Figure 38: Europe Travel Irons Volume Share (%), by Country 2025 & 2033
- Figure 39: Middle East & Africa Travel Irons Revenue (undefined), by Application 2025 & 2033
- Figure 40: Middle East & Africa Travel Irons Volume (K), by Application 2025 & 2033
- Figure 41: Middle East & Africa Travel Irons Revenue Share (%), by Application 2025 & 2033
- Figure 42: Middle East & Africa Travel Irons Volume Share (%), by Application 2025 & 2033
- Figure 43: Middle East & Africa Travel Irons Revenue (undefined), by Types 2025 & 2033
- Figure 44: Middle East & Africa Travel Irons Volume (K), by Types 2025 & 2033
- Figure 45: Middle East & Africa Travel Irons Revenue Share (%), by Types 2025 & 2033
- Figure 46: Middle East & Africa Travel Irons Volume Share (%), by Types 2025 & 2033
- Figure 47: Middle East & Africa Travel Irons Revenue (undefined), by Country 2025 & 2033
- Figure 48: Middle East & Africa Travel Irons Volume (K), by Country 2025 & 2033
- Figure 49: Middle East & Africa Travel Irons Revenue Share (%), by Country 2025 & 2033
- Figure 50: Middle East & Africa Travel Irons Volume Share (%), by Country 2025 & 2033
- Figure 51: Asia Pacific Travel Irons Revenue (undefined), by Application 2025 & 2033
- Figure 52: Asia Pacific Travel Irons Volume (K), by Application 2025 & 2033
- Figure 53: Asia Pacific Travel Irons Revenue Share (%), by Application 2025 & 2033
- Figure 54: Asia Pacific Travel Irons Volume Share (%), by Application 2025 & 2033
- Figure 55: Asia Pacific Travel Irons Revenue (undefined), by Types 2025 & 2033
- Figure 56: Asia Pacific Travel Irons Volume (K), by Types 2025 & 2033
- Figure 57: Asia Pacific Travel Irons Revenue Share (%), by Types 2025 & 2033
- Figure 58: Asia Pacific Travel Irons Volume Share (%), by Types 2025 & 2033
- Figure 59: Asia Pacific Travel Irons Revenue (undefined), by Country 2025 & 2033
- Figure 60: Asia Pacific Travel Irons Volume (K), by Country 2025 & 2033
- Figure 61: Asia Pacific Travel Irons Revenue Share (%), by Country 2025 & 2033
- Figure 62: Asia Pacific Travel Irons Volume Share (%), by Country 2025 & 2033
List of Tables
- Table 1: Global Travel Irons Revenue undefined Forecast, by Application 2020 & 2033
- Table 2: Global Travel Irons Volume K Forecast, by Application 2020 & 2033
- Table 3: Global Travel Irons Revenue undefined Forecast, by Types 2020 & 2033
- Table 4: Global Travel Irons Volume K Forecast, by Types 2020 & 2033
- Table 5: Global Travel Irons Revenue undefined Forecast, by Region 2020 & 2033
- Table 6: Global Travel Irons Volume K Forecast, by Region 2020 & 2033
- Table 7: Global Travel Irons Revenue undefined Forecast, by Application 2020 & 2033
- Table 8: Global Travel Irons Volume K Forecast, by Application 2020 & 2033
- Table 9: Global Travel Irons Revenue undefined Forecast, by Types 2020 & 2033
- Table 10: Global Travel Irons Volume K Forecast, by Types 2020 & 2033
- Table 11: Global Travel Irons Revenue undefined Forecast, by Country 2020 & 2033
- Table 12: Global Travel Irons Volume K Forecast, by Country 2020 & 2033
- Table 13: United States Travel Irons Revenue (undefined) Forecast, by Application 2020 & 2033
- Table 14: United States Travel Irons Volume (K) Forecast, by Application 2020 & 2033
- Table 15: Canada Travel Irons Revenue (undefined) Forecast, by Application 2020 & 2033
- Table 16: Canada Travel Irons Volume (K) Forecast, by Application 2020 & 2033
- Table 17: Mexico Travel Irons Revenue (undefined) Forecast, by Application 2020 & 2033
- Table 18: Mexico Travel Irons Volume (K) Forecast, by Application 2020 & 2033
- Table 19: Global Travel Irons Revenue undefined Forecast, by Application 2020 & 2033
- Table 20: Global Travel Irons Volume K Forecast, by Application 2020 & 2033
- Table 21: Global Travel Irons Revenue undefined Forecast, by Types 2020 & 2033
- Table 22: Global Travel Irons Volume K Forecast, by Types 2020 & 2033
- Table 23: Global Travel Irons Revenue undefined Forecast, by Country 2020 & 2033
- Table 24: Global Travel Irons Volume K Forecast, by Country 2020 & 2033
- Table 25: Brazil Travel Irons Revenue (undefined) Forecast, by Application 2020 & 2033
- Table 26: Brazil Travel Irons Volume (K) Forecast, by Application 2020 & 2033
- Table 27: Argentina Travel Irons Revenue (undefined) Forecast, by Application 2020 & 2033
- Table 28: Argentina Travel Irons Volume (K) Forecast, by Application 2020 & 2033
- Table 29: Rest of South America Travel Irons Revenue (undefined) Forecast, by Application 2020 & 2033
- Table 30: Rest of South America Travel Irons Volume (K) Forecast, by Application 2020 & 2033
- Table 31: Global Travel Irons Revenue undefined Forecast, by Application 2020 & 2033
- Table 32: Global Travel Irons Volume K Forecast, by Application 2020 & 2033
- Table 33: Global Travel Irons Revenue undefined Forecast, by Types 2020 & 2033
- Table 34: Global Travel Irons Volume K Forecast, by Types 2020 & 2033
- Table 35: Global Travel Irons Revenue undefined Forecast, by Country 2020 & 2033
- Table 36: Global Travel Irons Volume K Forecast, by Country 2020 & 2033
- Table 37: United Kingdom Travel Irons Revenue (undefined) Forecast, by Application 2020 & 2033
- Table 38: United Kingdom Travel Irons Volume (K) Forecast, by Application 2020 & 2033
- Table 39: Germany Travel Irons Revenue (undefined) Forecast, by Application 2020 & 2033
- Table 40: Germany Travel Irons Volume (K) Forecast, by Application 2020 & 2033
- Table 41: France Travel Irons Revenue (undefined) Forecast, by Application 2020 & 2033
- Table 42: France Travel Irons Volume (K) Forecast, by Application 2020 & 2033
- Table 43: Italy Travel Irons Revenue (undefined) Forecast, by Application 2020 & 2033
- Table 44: Italy Travel Irons Volume (K) Forecast, by Application 2020 & 2033
- Table 45: Spain Travel Irons Revenue (undefined) Forecast, by Application 2020 & 2033
- Table 46: Spain Travel Irons Volume (K) Forecast, by Application 2020 & 2033
- Table 47: Russia Travel Irons Revenue (undefined) Forecast, by Application 2020 & 2033
- Table 48: Russia Travel Irons Volume (K) Forecast, by Application 2020 & 2033
- Table 49: Benelux Travel Irons Revenue (undefined) Forecast, by Application 2020 & 2033
- Table 50: Benelux Travel Irons Volume (K) Forecast, by Application 2020 & 2033
- Table 51: Nordics Travel Irons Revenue (undefined) Forecast, by Application 2020 & 2033
- Table 52: Nordics Travel Irons Volume (K) Forecast, by Application 2020 & 2033
- Table 53: Rest of Europe Travel Irons Revenue (undefined) Forecast, by Application 2020 & 2033
- Table 54: Rest of Europe Travel Irons Volume (K) Forecast, by Application 2020 & 2033
- Table 55: Global Travel Irons Revenue undefined Forecast, by Application 2020 & 2033
- Table 56: Global Travel Irons Volume K Forecast, by Application 2020 & 2033
- Table 57: Global Travel Irons Revenue undefined Forecast, by Types 2020 & 2033
- Table 58: Global Travel Irons Volume K Forecast, by Types 2020 & 2033
- Table 59: Global Travel Irons Revenue undefined Forecast, by Country 2020 & 2033
- Table 60: Global Travel Irons Volume K Forecast, by Country 2020 & 2033
- Table 61: Turkey Travel Irons Revenue (undefined) Forecast, by Application 2020 & 2033
- Table 62: Turkey Travel Irons Volume (K) Forecast, by Application 2020 & 2033
- Table 63: Israel Travel Irons Revenue (undefined) Forecast, by Application 2020 & 2033
- Table 64: Israel Travel Irons Volume (K) Forecast, by Application 2020 & 2033
- Table 65: GCC Travel Irons Revenue (undefined) Forecast, by Application 2020 & 2033
- Table 66: GCC Travel Irons Volume (K) Forecast, by Application 2020 & 2033
- Table 67: North Africa Travel Irons Revenue (undefined) Forecast, by Application 2020 & 2033
- Table 68: North Africa Travel Irons Volume (K) Forecast, by Application 2020 & 2033
- Table 69: South Africa Travel Irons Revenue (undefined) Forecast, by Application 2020 & 2033
- Table 70: South Africa Travel Irons Volume (K) Forecast, by Application 2020 & 2033
- Table 71: Rest of Middle East & Africa Travel Irons Revenue (undefined) Forecast, by Application 2020 & 2033
- Table 72: Rest of Middle East & Africa Travel Irons Volume (K) Forecast, by Application 2020 & 2033
- Table 73: Global Travel Irons Revenue undefined Forecast, by Application 2020 & 2033
- Table 74: Global Travel Irons Volume K Forecast, by Application 2020 & 2033
- Table 75: Global Travel Irons Revenue undefined Forecast, by Types 2020 & 2033
- Table 76: Global Travel Irons Volume K Forecast, by Types 2020 & 2033
- Table 77: Global Travel Irons Revenue undefined Forecast, by Country 2020 & 2033
- Table 78: Global Travel Irons Volume K Forecast, by Country 2020 & 2033
- Table 79: China Travel Irons Revenue (undefined) Forecast, by Application 2020 & 2033
- Table 80: China Travel Irons Volume (K) Forecast, by Application 2020 & 2033
- Table 81: India Travel Irons Revenue (undefined) Forecast, by Application 2020 & 2033
- Table 82: India Travel Irons Volume (K) Forecast, by Application 2020 & 2033
- Table 83: Japan Travel Irons Revenue (undefined) Forecast, by Application 2020 & 2033
- Table 84: Japan Travel Irons Volume (K) Forecast, by Application 2020 & 2033
- Table 85: South Korea Travel Irons Revenue (undefined) Forecast, by Application 2020 & 2033
- Table 86: South Korea Travel Irons Volume (K) Forecast, by Application 2020 & 2033
- Table 87: ASEAN Travel Irons Revenue (undefined) Forecast, by Application 2020 & 2033
- Table 88: ASEAN Travel Irons Volume (K) Forecast, by Application 2020 & 2033
- Table 89: Oceania Travel Irons Revenue (undefined) Forecast, by Application 2020 & 2033
- Table 90: Oceania Travel Irons Volume (K) Forecast, by Application 2020 & 2033
- Table 91: Rest of Asia Pacific Travel Irons Revenue (undefined) Forecast, by Application 2020 & 2033
- Table 92: Rest of Asia Pacific Travel Irons Volume (K) Forecast, by Application 2020 & 2033
Frequently Asked Questions
1. What is the projected Compound Annual Growth Rate (CAGR) of the Travel Irons?
The projected CAGR is approximately 16.99%.
2. Which companies are prominent players in the Travel Irons?
Key companies in the market include Panasonic, Rowenta, Sunbeam Products, Bharat Light Machine, Russell Hobbs, Smartek.
3. What are the main segments of the Travel Irons?
The market segments include Application, Types.
4. Can you provide details about the market size?
The market size is estimated to be USD XXX N/A as of 2022.
5. What are some drivers contributing to market growth?
N/A
6. What are the notable trends driving market growth?
N/A
7. Are there any restraints impacting market growth?
N/A
8. Can you provide examples of recent developments in the market?
N/A
9. What pricing options are available for accessing the report?
Pricing options include single-user, multi-user, and enterprise licenses priced at USD 3350.00, USD 5025.00, and USD 6700.00 respectively.
10. Is the market size provided in terms of value or volume?
The market size is provided in terms of value, measured in N/A and volume, measured in K.
11. Are there any specific market keywords associated with the report?
Yes, the market keyword associated with the report is "Travel Irons," which aids in identifying and referencing the specific market segment covered.
12. How do I determine which pricing option suits my needs best?
The pricing options vary based on user requirements and access needs. Individual users may opt for single-user licenses, while businesses requiring broader access may choose multi-user or enterprise licenses for cost-effective access to the report.
13. Are there any additional resources or data provided in the Travel Irons report?
While the report offers comprehensive insights, it's advisable to review the specific contents or supplementary materials provided to ascertain if additional resources or data are available.
14. How can I stay updated on further developments or reports in the Travel Irons?
To stay informed about further developments, trends, and reports in the Travel Irons, consider subscribing to industry newsletters, following relevant companies and organizations, or regularly checking reputable industry news sources and publications.
Methodology
Step 1 - Identification of Relevant Samples Size from Population Database


Step 2 - Approaches for Defining Global Market Size (Value, Volume* & Price*)

Note*: In applicable scenarios
Step 3 - Data Sources
Primary Research
- Web Analytics
- Survey Reports
- Research Institute
- Latest Research Reports
- Opinion Leaders
Secondary Research
- Annual Reports
- White Paper
- Latest Press Release
- Industry Association
- Paid Database
- Investor Presentations

Step 4 - Data Triangulation
Involves using different sources of information in order to increase the validity of a study
These sources are likely to be stakeholders in a program - participants, other researchers, program staff, other community members, and so on.
Then we put all data in single framework & apply various statistical tools to find out the dynamic on the market.
During the analysis stage, feedback from the stakeholder groups would be compared to determine areas of agreement as well as areas of divergence