

Key Insights
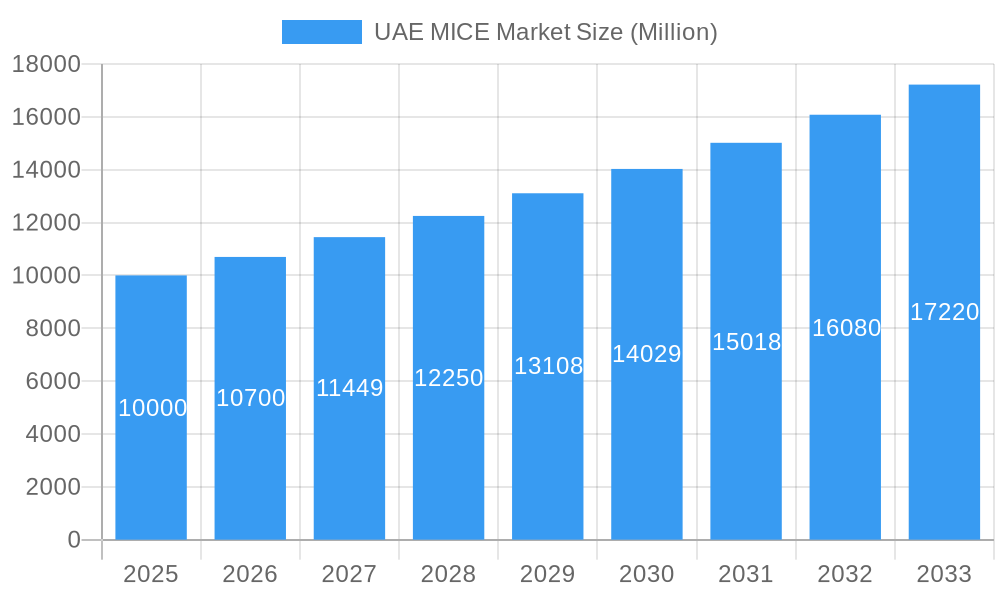
The United Arab Emirates (UAE) MICE (Meetings, Incentives, Conferences, and Exhibitions) market is poised for substantial growth, driven by the nation's economic diversification strategies and its commitment to developing world-class infrastructure. Leveraging advanced venues, superior connectivity, and premium hospitality, the UAE solidifies its position as a premier global MICE destination. Government-led initiatives designed to enhance tourism and attract major international events are key catalysts for this expansion. The current market size is estimated at 53361.9 million, with a projected Compound Annual Growth Rate (CAGR) of 6.6% from the base year 2024, indicating sustained market development through 2033. Factors contributing to this trajectory include escalating business tourism, the integration of hybrid and virtual event solutions, and the continuous advancement of innovative event technologies.
UAE MICE Market Market Size (In Billion)
The forecast period (2024-2033) anticipates robust expansion across various MICE sub-sectors. Growth in exhibition spaces and convention centers will accommodate the increasing demand for large-scale conferences and trade shows. The UAE's strategic emphasis on attracting high-value incentive travel programs will also be a significant revenue driver. Furthermore, the increasing adoption of sustainable practices, including eco-friendly venues and responsible tourism, will shape market trends. Intense competition is expected as established players and new entrants strive for market share through innovative services and strategic alliances. The overall outlook for the UAE MICE market remains highly positive, presenting considerable opportunities for continued expansion and diversification.
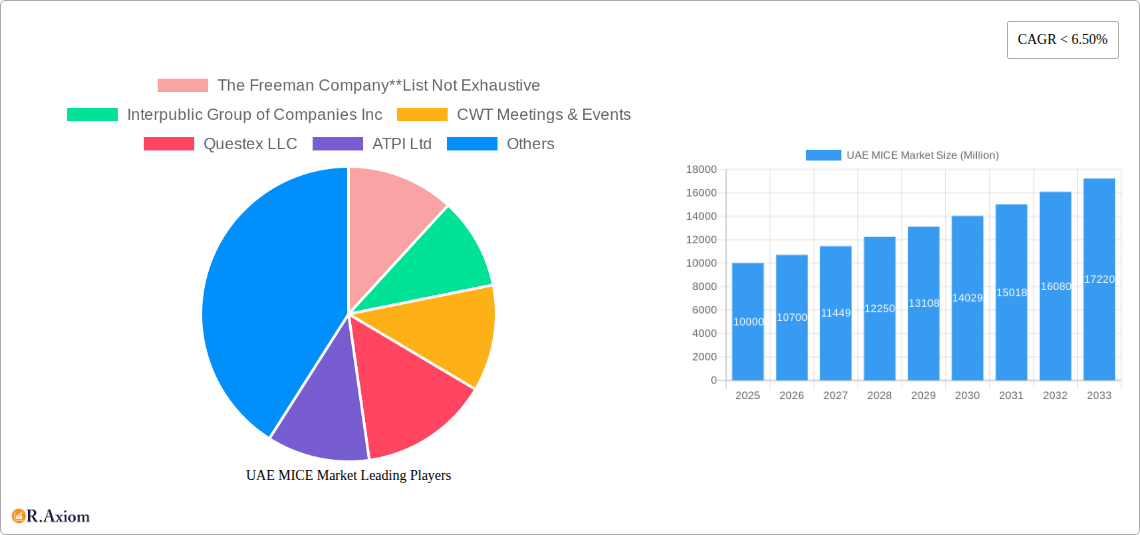
UAE MICE Market Company Market Share
UAE MICE Market: A Comprehensive Report (2019-2033)
This in-depth report provides a comprehensive analysis of the UAE MICE (Meetings, Incentives, Conferences, and Exhibitions) market, offering valuable insights for industry stakeholders, investors, and businesses seeking to capitalize on this dynamic sector. The report covers the period 2019-2033, with a focus on the base year 2025 and a forecast period spanning 2025-2033. It leverages historical data from 2019-2024 to project future market trends and opportunities. The report’s key findings are detailed below.
UAE MICE Market Concentration & Innovation
The UAE MICE market exhibits a moderately concentrated landscape, with a few large players holding significant market share. However, the market is also characterized by a considerable number of smaller, specialized firms. The Freeman Company, Interpublic Group of Companies Inc, CWT Meetings & Events, Questex LLC, ATPI Ltd, IBTM Events, CIE EVENTS, BCD Meetings and Events, and Conference Care Ltd are some key players. Market share data for individual companies is unavailable at this time (xx%). Innovation in the UAE MICE sector is driven by technological advancements, such as virtual and hybrid event platforms, improved event management software, and data analytics for enhanced attendee engagement. The regulatory framework, while generally supportive of the MICE industry, requires ongoing adaptation to keep up with technological advancements and changing business needs. Product substitution is primarily driven by the increasing adoption of virtual and hybrid events, which offer cost-effective and geographically accessible alternatives to traditional in-person events. End-user trends reflect a growing preference for personalized experiences, sustainable practices, and tech-enabled event solutions. M&A activity in the sector is moderate, with deal values ranging from xx Million to xx Million, primarily focused on consolidating market share and expanding service offerings.
UAE MICE Market Industry Trends & Insights
The UAE MICE market is experiencing robust growth, driven by several key factors. The Expo 2020 Dubai significantly boosted the sector's visibility and attracted substantial investment. The country's strategic location, world-class infrastructure, and business-friendly policies further contribute to its attractiveness as a MICE destination. Technological disruptions, particularly the rise of virtual and hybrid events, are reshaping the industry landscape. The adoption of these technologies is expected to accelerate during the forecast period, leading to a shift in consumer preferences towards more flexible and cost-effective event formats. Consumer preferences for personalized experiences, experiential travel, and sustainable event planning are significantly impacting service offerings. Competitive dynamics are characterized by intense competition among established players and the emergence of new entrants offering innovative solutions. The CAGR for the UAE MICE market during the forecast period (2025-2033) is estimated to be xx%, with market penetration expected to reach xx% by 2033.
Dominant Markets & Segments in UAE MICE Market
Dubai is the dominant market within the UAE MICE sector, accounting for the majority of events and delegates. This dominance is driven by robust infrastructure, including the Dubai World Trade Centre, a strong tourism sector ranked among the top 10 economic share generators in 2020 (source needed for verification), and proactive government support for business events.
- Key Drivers of Dubai's Dominance:
- World-class infrastructure (e.g., Dubai World Trade Centre)
- Strong tourism sector and associated economic benefits
- Proactive government policies and investment in MICE infrastructure
- Excellent air connectivity and accessibility
The Meetings segment is currently the largest segment within the UAE MICE market, with significant growth expected in the Conventions and Exhibitions segments. Incentives travel also represents a substantial portion of the market.
- Meetings: Driven by strong business activity and a growing number of corporate events.
- Incentives: Fueled by increased corporate spending on employee rewards and recognition programs.
- Conventions: Benefiting from government initiatives to attract large-scale international conventions.
- Exhibitions: Supported by the growth of various industry sectors and an increase in trade shows and expos.
UAE MICE Market Product Developments
The UAE MICE market is witnessing significant product innovation, driven by technological advancements and the changing needs of event organizers and attendees. This includes the development of sophisticated event management software, virtual and hybrid event platforms, AI-powered solutions for personalized attendee experiences, and sustainable event solutions. These innovations provide greater efficiency, enhanced attendee engagement, and improved ROI for event organizers. The market is moving towards integrated solutions that streamline various aspects of event planning and execution, emphasizing efficiency and cost-effectiveness.
Report Scope & Segmentation Analysis
This report segments the UAE MICE market by event type: Meetings, Incentives, Conventions, and Exhibitions. Each segment's growth projections, market size (in Millions), and competitive dynamics are analyzed within the report.
- Meetings: Growth is projected at xx% CAGR (2025-2033), with market size estimated at xx Million in 2025. Competition is intense due to the large number of service providers.
- Incentives: Growth is expected at xx% CAGR (2025-2033), with a market size of xx Million in 2025. The market is driven by corporate spending and competition centers around offering unique experiences.
- Conventions: Projected growth is at xx% CAGR (2025-2033) reaching a market size of xx Million in 2025. Government initiatives strongly influence growth.
- Exhibitions: Growth is forecast at xx% CAGR (2025-2033), and the 2025 market size is expected at xx Million. This segment is characterized by a strong focus on specialized trade shows.
Key Drivers of UAE MICE Market Growth
The UAE MICE market's growth is propelled by several factors: Government initiatives to promote tourism and business events; significant investment in world-class infrastructure; a strategic location attracting international events; a growing business environment fostering corporate events; the increasing adoption of technology, enabling virtual and hybrid events; and the rising demand for unique and personalized experiences from attendees. The 2019 record of 3.57 Million delegates at the Dubai World Trade Centre, with a 4% increase from the previous year, exemplifies this trend.
Challenges in the UAE MICE Market Sector
Challenges include competition from regional and international destinations; the need for ongoing adaptation to changing technology; potential economic fluctuations impacting corporate spending; the ongoing need to manage sustainable practices; and reliance on international travel, potentially impacted by global events. The impact of these challenges on market growth needs further research (xx% estimated reduction in growth due to these challenges).
Emerging Opportunities in UAE MICE Market
Emerging opportunities lie in leveraging technology for improved event management and immersive experiences; expanding into niche markets; focusing on sustainable and eco-friendly event practices; tapping into the growth of virtual and hybrid events; and capitalizing on the increasing demand for personalized and memorable experiences.
Leading Players in the UAE MICE Market Market
- The Freeman Company
- Interpublic Group of Companies Inc
- CWT Meetings & Events
- Questex LLC
- ATPI Ltd
- IBTM Events
- CIE EVENTS
- BCD Meetings and Events
- Conference Care Ltd
Key Developments in UAE MICE Market Industry
- 2019: Dubai World Trade Centre welcomes a record 3.57 million delegates, a 4% increase year-on-year.
- 2019: Dubai Business Events organized 301 meetings, conferences, and incentives, bidding for 595 events in 2020.
- 2020: Dubai's tourism sector ranks among the top 10 strongest economic share generators.
- 2020-2022: Expo 2020 Dubai significantly boosts the MICE industry's growth and visibility. Several new events are added to the 2022 calendar.
Strategic Outlook for UAE MICE Market Market
The UAE MICE market is poised for continued growth, driven by government support, infrastructure development, and technological innovation. The focus on sustainable practices and personalized experiences will further shape market dynamics. Opportunities exist to expand into niche segments, leverage technology for enhanced efficiency, and cater to the evolving needs of event attendees. The long-term outlook remains positive, with substantial potential for market expansion throughout the forecast period.
UAE MICE Market Segmentation
-
1. Event
- 1.1. Meeting
- 1.2. Incentive
- 1.3. Conventions
- 1.4. Exhibitions
UAE MICE Market Segmentation By Geography
-
1. North America
- 1.1. United States
- 1.2. Canada
- 1.3. Mexico
-
2. South America
- 2.1. Brazil
- 2.2. Argentina
- 2.3. Rest of South America
-
3. Europe
- 3.1. United Kingdom
- 3.2. Germany
- 3.3. France
- 3.4. Italy
- 3.5. Spain
- 3.6. Russia
- 3.7. Benelux
- 3.8. Nordics
- 3.9. Rest of Europe
-
4. Middle East & Africa
- 4.1. Turkey
- 4.2. Israel
- 4.3. GCC
- 4.4. North Africa
- 4.5. South Africa
- 4.6. Rest of Middle East & Africa
-
5. Asia Pacific
- 5.1. China
- 5.2. India
- 5.3. Japan
- 5.4. South Korea
- 5.5. ASEAN
- 5.6. Oceania
- 5.7. Rest of Asia Pacific
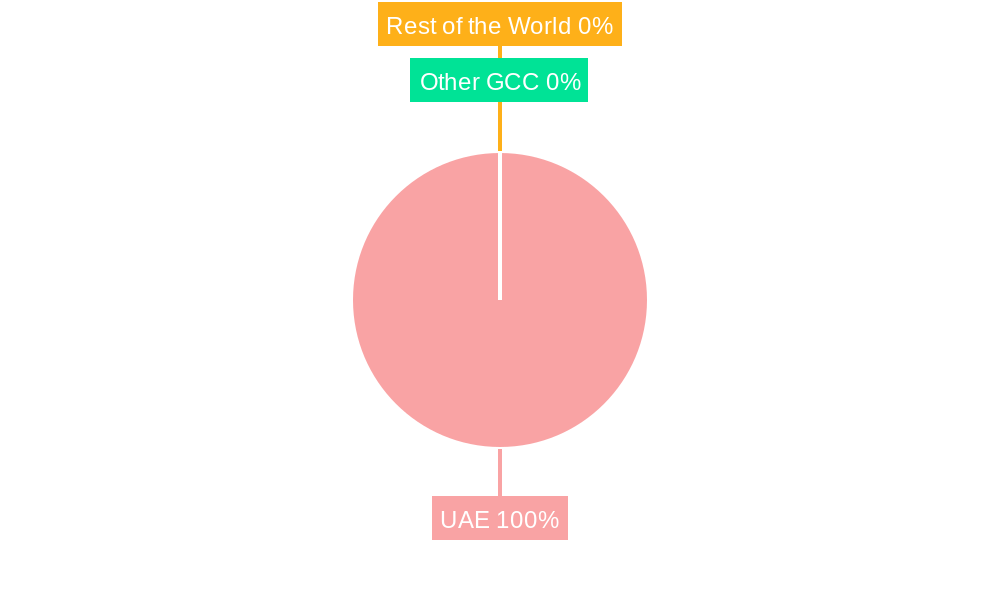
UAE MICE Market Regional Market Share
Geographic Coverage of UAE MICE Market
UAE MICE Market REPORT HIGHLIGHTS
| Aspects | Details |
|---|---|
| Study Period | 2020-2034 |
| Base Year | 2025 |
| Estimated Year | 2026 |
| Forecast Period | 2026-2034 |
| Historical Period | 2020-2025 |
| Growth Rate | CAGR of 6.6% from 2020-2034 |
| Segmentation |
|
Table of Contents
- 1. Introduction
- 1.1. Research Scope
- 1.2. Market Segmentation
- 1.3. Research Objective
- 1.4. Definitions and Assumptions
- 2. Executive Summary
- 2.1. Market Snapshot
- 3. Market Dynamics
- 3.1. Market Drivers
- 3.2. Market Restrains
- 3.3. Market Trends
- 3.4. Market Opportunities
- 4. Market Factor Analysis
- 4.1. Porters Five Forces
- 4.1.1. Bargaining Power of Suppliers
- 4.1.2. Bargaining Power of Buyers
- 4.1.3. Threat of New Entrants
- 4.1.4. Threat of Substitutes
- 4.1.5. Competitive Rivalry
- 4.2. PESTEL analysis
- 4.3. BCG Analysis
- 4.3.1. Stars (High Growth, High Market Share)
- 4.3.2. Cash Cows (Low Growth, High Market Share)
- 4.3.3. Question Mark (High Growth, Low Market Share)
- 4.3.4. Dogs (Low Growth, Low Market Share)
- 4.4. Ansoff Matrix Analysis
- 4.5. Supply Chain Analysis
- 4.6. Regulatory Landscape
- 4.7. Current Market Potential and Opportunity Assessment (TAM–SAM–SOM Framework)
- 4.8. RAX Analyst Note
- 4.1. Porters Five Forces
- 5. Market Analysis, Insights and Forecast 2021-2033
- 5.1. Market Analysis, Insights and Forecast - by Event
- 5.1.1. Meeting
- 5.1.2. Incentive
- 5.1.3. Conventions
- 5.1.4. Exhibitions
- 5.2. Market Analysis, Insights and Forecast - by Region
- 5.2.1. North America
- 5.2.2. South America
- 5.2.3. Europe
- 5.2.4. Middle East & Africa
- 5.2.5. Asia Pacific
- 5.1. Market Analysis, Insights and Forecast - by Event
- 6. Global UAE MICE Market Analysis, Insights and Forecast, 2021-2033
- 6.1. Market Analysis, Insights and Forecast - by Event
- 6.1.1. Meeting
- 6.1.2. Incentive
- 6.1.3. Conventions
- 6.1.4. Exhibitions
- 6.1. Market Analysis, Insights and Forecast - by Event
- 7. North America UAE MICE Market Analysis, Insights and Forecast, 2020-2032
- 7.1. Market Analysis, Insights and Forecast - by Event
- 7.1.1. Meeting
- 7.1.2. Incentive
- 7.1.3. Conventions
- 7.1.4. Exhibitions
- 7.1. Market Analysis, Insights and Forecast - by Event
- 8. South America UAE MICE Market Analysis, Insights and Forecast, 2020-2032
- 8.1. Market Analysis, Insights and Forecast - by Event
- 8.1.1. Meeting
- 8.1.2. Incentive
- 8.1.3. Conventions
- 8.1.4. Exhibitions
- 8.1. Market Analysis, Insights and Forecast - by Event
- 9. Europe UAE MICE Market Analysis, Insights and Forecast, 2020-2032
- 9.1. Market Analysis, Insights and Forecast - by Event
- 9.1.1. Meeting
- 9.1.2. Incentive
- 9.1.3. Conventions
- 9.1.4. Exhibitions
- 9.1. Market Analysis, Insights and Forecast - by Event
- 10. Middle East & Africa UAE MICE Market Analysis, Insights and Forecast, 2020-2032
- 10.1. Market Analysis, Insights and Forecast - by Event
- 10.1.1. Meeting
- 10.1.2. Incentive
- 10.1.3. Conventions
- 10.1.4. Exhibitions
- 10.1. Market Analysis, Insights and Forecast - by Event
- 11. Asia Pacific UAE MICE Market Analysis, Insights and Forecast, 2020-2032
- 11.1. Market Analysis, Insights and Forecast - by Event
- 11.1.1. Meeting
- 11.1.2. Incentive
- 11.1.3. Conventions
- 11.1.4. Exhibitions
- 11.1. Market Analysis, Insights and Forecast - by Event
- 12. Competitive Analysis
- 12.1. Company Profiles
- 12.1.1 The Freeman Company**List Not Exhaustive
- 12.1.1.1. Company Overview
- 12.1.1.2. Products
- 12.1.1.3. Company Financials
- 12.1.1.4. SWOT Analysis
- 12.1.2 Interpublic Group of Companies Inc
- 12.1.2.1. Company Overview
- 12.1.2.2. Products
- 12.1.2.3. Company Financials
- 12.1.2.4. SWOT Analysis
- 12.1.3 CWT Meetings & Events
- 12.1.3.1. Company Overview
- 12.1.3.2. Products
- 12.1.3.3. Company Financials
- 12.1.3.4. SWOT Analysis
- 12.1.4 Questex LLC
- 12.1.4.1. Company Overview
- 12.1.4.2. Products
- 12.1.4.3. Company Financials
- 12.1.4.4. SWOT Analysis
- 12.1.5 ATPI Ltd
- 12.1.5.1. Company Overview
- 12.1.5.2. Products
- 12.1.5.3. Company Financials
- 12.1.5.4. SWOT Analysis
- 12.1.6 IBTM Events
- 12.1.6.1. Company Overview
- 12.1.6.2. Products
- 12.1.6.3. Company Financials
- 12.1.6.4. SWOT Analysis
- 12.1.7 CIEVENTS
- 12.1.7.1. Company Overview
- 12.1.7.2. Products
- 12.1.7.3. Company Financials
- 12.1.7.4. SWOT Analysis
- 12.1.8 BCD Meetings and Events
- 12.1.8.1. Company Overview
- 12.1.8.2. Products
- 12.1.8.3. Company Financials
- 12.1.8.4. SWOT Analysis
- 12.1.9 Conference Care Ltd
- 12.1.9.1. Company Overview
- 12.1.9.2. Products
- 12.1.9.3. Company Financials
- 12.1.9.4. SWOT Analysis
- 12.1.1 The Freeman Company**List Not Exhaustive
- 12.2. Market Entropy
- 12.2.1 Company's Key Areas Served
- 12.2.2 Recent Developments
- 12.3. Company Market Share Analysis 2025
- 12.3.1 Top 5 Companies Market Share Analysis
- 12.3.2 Top 3 Companies Market Share Analysis
- 12.4. List of Potential Customers
- 13. Research Methodology
List of Figures
- Figure 1: Global UAE MICE Market Revenue Breakdown (million, %) by Region 2025 & 2033
- Figure 2: North America UAE MICE Market Revenue (million), by Event 2025 & 2033
- Figure 3: North America UAE MICE Market Revenue Share (%), by Event 2025 & 2033
- Figure 4: North America UAE MICE Market Revenue (million), by Country 2025 & 2033
- Figure 5: North America UAE MICE Market Revenue Share (%), by Country 2025 & 2033
- Figure 6: South America UAE MICE Market Revenue (million), by Event 2025 & 2033
- Figure 7: South America UAE MICE Market Revenue Share (%), by Event 2025 & 2033
- Figure 8: South America UAE MICE Market Revenue (million), by Country 2025 & 2033
- Figure 9: South America UAE MICE Market Revenue Share (%), by Country 2025 & 2033
- Figure 10: Europe UAE MICE Market Revenue (million), by Event 2025 & 2033
- Figure 11: Europe UAE MICE Market Revenue Share (%), by Event 2025 & 2033
- Figure 12: Europe UAE MICE Market Revenue (million), by Country 2025 & 2033
- Figure 13: Europe UAE MICE Market Revenue Share (%), by Country 2025 & 2033
- Figure 14: Middle East & Africa UAE MICE Market Revenue (million), by Event 2025 & 2033
- Figure 15: Middle East & Africa UAE MICE Market Revenue Share (%), by Event 2025 & 2033
- Figure 16: Middle East & Africa UAE MICE Market Revenue (million), by Country 2025 & 2033
- Figure 17: Middle East & Africa UAE MICE Market Revenue Share (%), by Country 2025 & 2033
- Figure 18: Asia Pacific UAE MICE Market Revenue (million), by Event 2025 & 2033
- Figure 19: Asia Pacific UAE MICE Market Revenue Share (%), by Event 2025 & 2033
- Figure 20: Asia Pacific UAE MICE Market Revenue (million), by Country 2025 & 2033
- Figure 21: Asia Pacific UAE MICE Market Revenue Share (%), by Country 2025 & 2033
List of Tables
- Table 1: Global UAE MICE Market Revenue million Forecast, by Event 2020 & 2033
- Table 2: Global UAE MICE Market Revenue million Forecast, by Region 2020 & 2033
- Table 3: Global UAE MICE Market Revenue million Forecast, by Event 2020 & 2033
- Table 4: Global UAE MICE Market Revenue million Forecast, by Country 2020 & 2033
- Table 5: United States UAE MICE Market Revenue (million) Forecast, by Application 2020 & 2033
- Table 6: Canada UAE MICE Market Revenue (million) Forecast, by Application 2020 & 2033
- Table 7: Mexico UAE MICE Market Revenue (million) Forecast, by Application 2020 & 2033
- Table 8: Global UAE MICE Market Revenue million Forecast, by Event 2020 & 2033
- Table 9: Global UAE MICE Market Revenue million Forecast, by Country 2020 & 2033
- Table 10: Brazil UAE MICE Market Revenue (million) Forecast, by Application 2020 & 2033
- Table 11: Argentina UAE MICE Market Revenue (million) Forecast, by Application 2020 & 2033
- Table 12: Rest of South America UAE MICE Market Revenue (million) Forecast, by Application 2020 & 2033
- Table 13: Global UAE MICE Market Revenue million Forecast, by Event 2020 & 2033
- Table 14: Global UAE MICE Market Revenue million Forecast, by Country 2020 & 2033
- Table 15: United Kingdom UAE MICE Market Revenue (million) Forecast, by Application 2020 & 2033
- Table 16: Germany UAE MICE Market Revenue (million) Forecast, by Application 2020 & 2033
- Table 17: France UAE MICE Market Revenue (million) Forecast, by Application 2020 & 2033
- Table 18: Italy UAE MICE Market Revenue (million) Forecast, by Application 2020 & 2033
- Table 19: Spain UAE MICE Market Revenue (million) Forecast, by Application 2020 & 2033
- Table 20: Russia UAE MICE Market Revenue (million) Forecast, by Application 2020 & 2033
- Table 21: Benelux UAE MICE Market Revenue (million) Forecast, by Application 2020 & 2033
- Table 22: Nordics UAE MICE Market Revenue (million) Forecast, by Application 2020 & 2033
- Table 23: Rest of Europe UAE MICE Market Revenue (million) Forecast, by Application 2020 & 2033
- Table 24: Global UAE MICE Market Revenue million Forecast, by Event 2020 & 2033
- Table 25: Global UAE MICE Market Revenue million Forecast, by Country 2020 & 2033
- Table 26: Turkey UAE MICE Market Revenue (million) Forecast, by Application 2020 & 2033
- Table 27: Israel UAE MICE Market Revenue (million) Forecast, by Application 2020 & 2033
- Table 28: GCC UAE MICE Market Revenue (million) Forecast, by Application 2020 & 2033
- Table 29: North Africa UAE MICE Market Revenue (million) Forecast, by Application 2020 & 2033
- Table 30: South Africa UAE MICE Market Revenue (million) Forecast, by Application 2020 & 2033
- Table 31: Rest of Middle East & Africa UAE MICE Market Revenue (million) Forecast, by Application 2020 & 2033
- Table 32: Global UAE MICE Market Revenue million Forecast, by Event 2020 & 2033
- Table 33: Global UAE MICE Market Revenue million Forecast, by Country 2020 & 2033
- Table 34: China UAE MICE Market Revenue (million) Forecast, by Application 2020 & 2033
- Table 35: India UAE MICE Market Revenue (million) Forecast, by Application 2020 & 2033
- Table 36: Japan UAE MICE Market Revenue (million) Forecast, by Application 2020 & 2033
- Table 37: South Korea UAE MICE Market Revenue (million) Forecast, by Application 2020 & 2033
- Table 38: ASEAN UAE MICE Market Revenue (million) Forecast, by Application 2020 & 2033
- Table 39: Oceania UAE MICE Market Revenue (million) Forecast, by Application 2020 & 2033
- Table 40: Rest of Asia Pacific UAE MICE Market Revenue (million) Forecast, by Application 2020 & 2033
Frequently Asked Questions
1. What is the projected Compound Annual Growth Rate (CAGR) of the UAE MICE Market?
The projected CAGR is approximately 6.6%.
2. Which companies are prominent players in the UAE MICE Market?
Key companies in the market include The Freeman Company**List Not Exhaustive, Interpublic Group of Companies Inc, CWT Meetings & Events, Questex LLC, ATPI Ltd, IBTM Events, CIEVENTS, BCD Meetings and Events, Conference Care Ltd.
3. What are the main segments of the UAE MICE Market?
The market segments include Event.
4. Can you provide details about the market size?
The market size is estimated to be USD 53361.9 million as of 2022.
5. What are some drivers contributing to market growth?
Social Media and Celebrity Influence; Increasing Disposable Income.
6. What are the notable trends driving market growth?
Enabling Digitised travel Ecosystem is driving the market.
7. Are there any restraints impacting market growth?
Cost of Services is a Restraining Factor for the Market; Limited Insurance Coverage is Restraining the Market.
8. Can you provide examples of recent developments in the market?
The Expo 2020 Dubai has brought a lot of positivity and the MICE (meetings, incentives, conferences and exhibitions) industry in the UAE and region is poised to grow with several new events added to the 2022 calendar.
9. What pricing options are available for accessing the report?
Pricing options include single-user, multi-user, and enterprise licenses priced at USD 3800, USD 4500, and USD 5800 respectively.
10. Is the market size provided in terms of value or volume?
The market size is provided in terms of value, measured in million.
11. Are there any specific market keywords associated with the report?
Yes, the market keyword associated with the report is "UAE MICE Market," which aids in identifying and referencing the specific market segment covered.
12. How do I determine which pricing option suits my needs best?
The pricing options vary based on user requirements and access needs. Individual users may opt for single-user licenses, while businesses requiring broader access may choose multi-user or enterprise licenses for cost-effective access to the report.
13. Are there any additional resources or data provided in the UAE MICE Market report?
While the report offers comprehensive insights, it's advisable to review the specific contents or supplementary materials provided to ascertain if additional resources or data are available.
14. How can I stay updated on further developments or reports in the UAE MICE Market?
To stay informed about further developments, trends, and reports in the UAE MICE Market, consider subscribing to industry newsletters, following relevant companies and organizations, or regularly checking reputable industry news sources and publications.
Methodology
Step 1 - Identification of Relevant Samples Size from Population Database


Step 2 - Approaches for Defining Global Market Size (Value, Volume* & Price*)

Note*: In applicable scenarios
Step 3 - Data Sources
Primary Research
- Web Analytics
- Survey Reports
- Research Institute
- Latest Research Reports
- Opinion Leaders
Secondary Research
- Annual Reports
- White Paper
- Latest Press Release
- Industry Association
- Paid Database
- Investor Presentations

Step 4 - Data Triangulation
Involves using different sources of information in order to increase the validity of a study
These sources are likely to be stakeholders in a program - participants, other researchers, program staff, other community members, and so on.
Then we put all data in single framework & apply various statistical tools to find out the dynamic on the market.
During the analysis stage, feedback from the stakeholder groups would be compared to determine areas of agreement as well as areas of divergence