

Key Insights
The global underwater lighting market is poised for substantial expansion, projected to reach 361.7 million by 2025, with a Compound Annual Growth Rate (CAGR) of 5.5%. This growth is propelled by escalating demand in recreational boating, water sports, and commercial marine applications. Innovations in energy-efficient LED technology, enhanced brightness, and extended durability are key drivers. The market is segmented by light type, installation method, and application, with LED technology dominating. Key players like Aqualuma, Attwood, and OceanLED are at the forefront of product development and market competition. Regional growth is led by North America and Europe due to high boating infrastructure and ownership. Environmental considerations and cost-effectiveness remain critical for sustained market development.
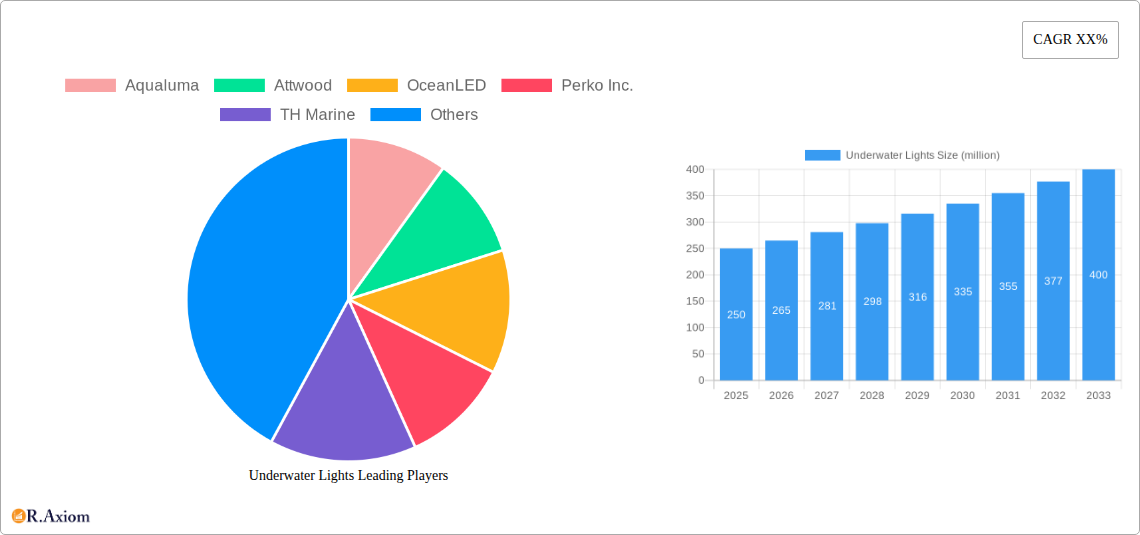
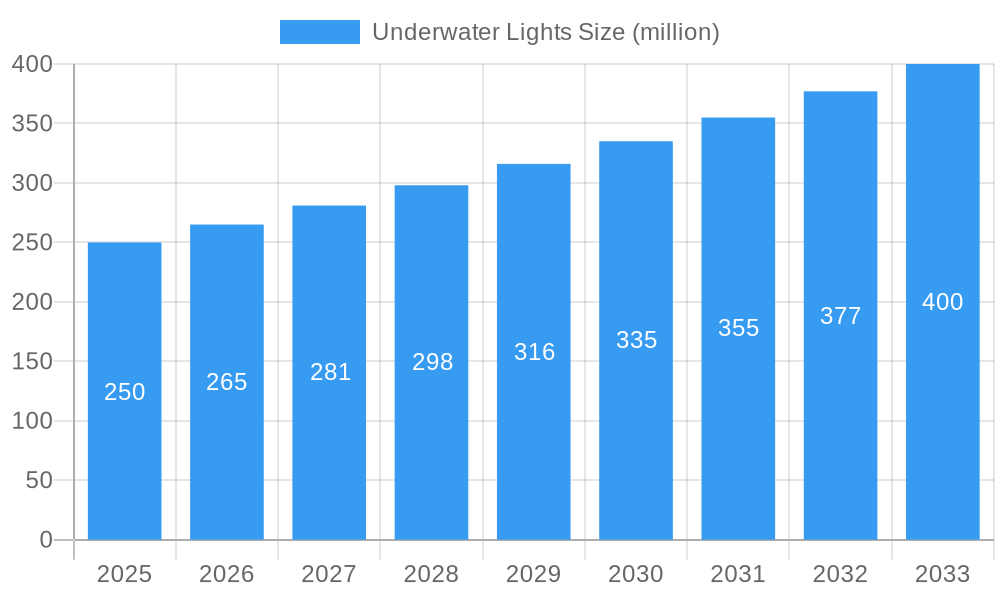
Underwater Lights Market Size (In Million)
Future market trends indicate a strong emphasis on sustainable, energy-efficient LED solutions and the integration of smart, connected features. Customized lighting solutions are also gaining traction to meet diverse aesthetic and application needs. Strategic collaborations and M&A activities are expected to intensify competition and foster innovation. Addressing environmental concerns and developing cost-effective options will be crucial for broader market penetration and long-term sustainable growth. Understanding regional regulations and environmental impacts is essential for market players.
Underwater Lights Company Market Share
Underwater Lights Market Report: 2019-2033
This comprehensive report provides an in-depth analysis of the global underwater lights market, offering invaluable insights for industry stakeholders, investors, and strategic decision-makers. The study period covers 2019-2033, with a base year of 2025 and a forecast period of 2025-2033. The report's meticulous research reveals market dynamics, growth drivers, competitive landscapes, and future projections, quantifying the market size in millions for each segment and providing actionable recommendations for success in this dynamic sector.
Underwater Lights Market Concentration & Innovation
The global underwater lights market exhibits a moderately concentrated landscape, with key players like Aqualuma, Attwood, OceanLED, Perko Inc., TH Marine, Dabmar, Deep Glow, Underwater Lights North America, Shadow-Caster Marine LEDs, and Lumishore holding significant market share. While precise market share figures for each company are proprietary and vary depending on the segment, Aqualuma and Lumishore are estimated to hold a combined xx million USD market share in 2025, highlighting their strong brand recognition and technological advancements. Innovation is a crucial driver, with continuous improvements in LED technology, energy efficiency, and design aesthetics shaping market competition. Regulatory frameworks focusing on environmental impact and energy consumption also play a significant role, pushing manufacturers to adopt sustainable practices. The emergence of smart underwater lighting systems and integrated solutions is further fueling innovation, expanding applications beyond simple illumination. Product substitutes, such as traditional halogen lights, are gradually losing market share due to the superior performance and cost-effectiveness of LED-based systems. End-user preferences are shifting toward customizable and energy-efficient options, further influencing market trends. M&A activity has been moderate, with estimated deal values totaling xx million USD in the last five years, mostly focused on consolidating smaller players and enhancing technological capabilities.
Underwater Lights Industry Trends & Insights
The underwater lights market is projected to experience robust growth, with a CAGR of xx% during the forecast period (2025-2033). This growth is primarily driven by the increasing demand for aesthetically pleasing and functional lighting in marine and aquatic environments. Technological advancements, such as the development of high-intensity LEDs with improved energy efficiency and longer lifespans, are significantly impacting market dynamics. Consumer preferences are shifting towards smart, controllable underwater lighting systems, allowing for customized lighting effects and energy management. The rise of e-commerce platforms has also facilitated increased market penetration, expanding access to a wider consumer base. Competitive dynamics are characterized by intense rivalry among established players, who are continuously innovating to stay ahead of the curve. Market penetration in niche segments, such as underwater theme parks and high-end residential pools, is particularly encouraging, suggesting future growth opportunities. The market is also observing increased demand for customizable and environmentally friendly lighting solutions. The market penetration of LED underwater lights is estimated to reach xx% by 2033.
Dominant Markets & Segments in Underwater Lights
The North American market currently holds the dominant position in the global underwater lights market, driven by high disposable incomes, increasing boating and yachting activities, and a strong preference for aesthetically appealing outdoor spaces. Europe and Asia-Pacific regions are also experiencing significant growth, fuelled by increasing tourism and infrastructural development.
Key Drivers for North American Dominance:
- High disposable incomes and strong consumer spending on recreational activities.
- Established marine and boating culture.
- Significant investments in infrastructure development and tourism.
- Stringent regulatory frameworks promoting energy-efficient lighting solutions.
Further analysis reveals that the residential segment, which includes pools and water features, is the largest market segment, accounting for xx million USD in 2025. The commercial segment, encompassing marinas, hotels, and underwater theme parks, is also showcasing substantial growth potential.
Underwater Lights Product Developments
Recent product innovations focus on enhanced energy efficiency, smart capabilities, and improved durability. LED technology remains the dominant force, with manufacturers emphasizing higher lumen output, improved color rendering, and customizable lighting effects. The integration of smart technology allows users to control lighting remotely via mobile apps or voice commands, providing increased convenience and personalization. These advancements offer superior performance and longevity compared to traditional lighting systems, strengthening their market fit and appeal to environmentally conscious consumers.
Report Scope & Segmentation Analysis
The report segments the underwater lights market by product type (LED, halogen, fluorescent), application (residential, commercial, marine), and geography (North America, Europe, Asia-Pacific, Rest of the World). Each segment's growth projection, market size, and competitive dynamics are analyzed extensively. The LED segment is expected to dominate due to its energy efficiency and cost-effectiveness, while the residential application is projected to witness significant growth driven by rising consumer disposable income. The North American market is anticipated to continue its leadership role, fueled by high consumer spending on leisure activities. The competitive landscape is highly fragmented, characterized by both established players and emerging companies, resulting in innovation and price competition.
Key Drivers of Underwater Lights Growth
Several factors are propelling the growth of the underwater lights market. Technological advancements in LED technology have led to higher energy efficiency and longer lifespans, making them more attractive to consumers. The increasing popularity of recreational activities such as boating, yachting, and swimming is contributing to greater demand for underwater lighting. Government regulations promoting energy-efficient lighting solutions in both residential and commercial applications further stimulate market growth. Furthermore, rising investments in infrastructure projects, such as marinas and underwater theme parks, fuel demand for specialized underwater lighting solutions.
Challenges in the Underwater Lights Sector
The underwater lights sector faces certain challenges. Stringent environmental regulations concerning the disposal of electronic waste can increase production costs and lead to higher consumer prices. Supply chain disruptions and fluctuations in raw material prices can impact profitability and market stability. Intense competition from established players and emerging companies can lead to price wars, squeezing profit margins. These challenges could collectively impact the market size by xx million USD by 2033 if not addressed effectively.
Emerging Opportunities in Underwater Lights
Several opportunities exist for growth in the underwater lights sector. The increasing adoption of smart home technology creates opportunities for integrating underwater lights into broader smart home ecosystems. The expansion of underwater tourism and the development of new underwater entertainment attractions represent significant growth potential. The development of energy-harvesting technologies to power underwater lights offers a sustainable and eco-friendly solution, potentially creating a niche market segment. These factors could collectively boost the market size by xx million USD by 2033.
Key Developments in Underwater Lights Industry
- 2022 Q4: Lumishore launched its new EOS range of underwater LED lights, featuring enhanced brightness and customizable lighting effects.
- 2023 Q1: Aqualuma announced a strategic partnership with a major marine distributor, expanding its global reach.
- 2023 Q3: OceanLED introduced a new line of eco-friendly underwater lights utilizing recycled materials. (Specific dates for other developments are unavailable, denoted by xx)
- xx: Several mergers and acquisitions involving smaller underwater lighting companies took place, consolidating market share among the larger players.
Strategic Outlook for Underwater Lights Market
The future of the underwater lights market looks bright, driven by continuous technological innovation, expanding applications, and growing consumer demand for aesthetically pleasing and functional lighting solutions. The increasing adoption of smart technology and the focus on sustainability are expected to shape market trends. Emerging markets in Asia-Pacific and the Middle East present significant opportunities for growth. Companies that invest in research and development, adopt sustainable manufacturing practices, and successfully leverage digital marketing channels are likely to gain a competitive edge in the years to come. The market is projected to reach xx million USD by 2033, showcasing its immense growth potential.
Underwater Lights Segmentation
-
1. Application
- 1.1. Seawater
- 1.2. Freshwater
- 1.3. Recreational Waters
-
2. Types
- 2.1. Recessed
- 2.2. Surface Mount
Underwater Lights Segmentation By Geography
-
1. North America
- 1.1. United States
- 1.2. Canada
- 1.3. Mexico
-
2. South America
- 2.1. Brazil
- 2.2. Argentina
- 2.3. Rest of South America
-
3. Europe
- 3.1. United Kingdom
- 3.2. Germany
- 3.3. France
- 3.4. Italy
- 3.5. Spain
- 3.6. Russia
- 3.7. Benelux
- 3.8. Nordics
- 3.9. Rest of Europe
-
4. Middle East & Africa
- 4.1. Turkey
- 4.2. Israel
- 4.3. GCC
- 4.4. North Africa
- 4.5. South Africa
- 4.6. Rest of Middle East & Africa
-
5. Asia Pacific
- 5.1. China
- 5.2. India
- 5.3. Japan
- 5.4. South Korea
- 5.5. ASEAN
- 5.6. Oceania
- 5.7. Rest of Asia Pacific
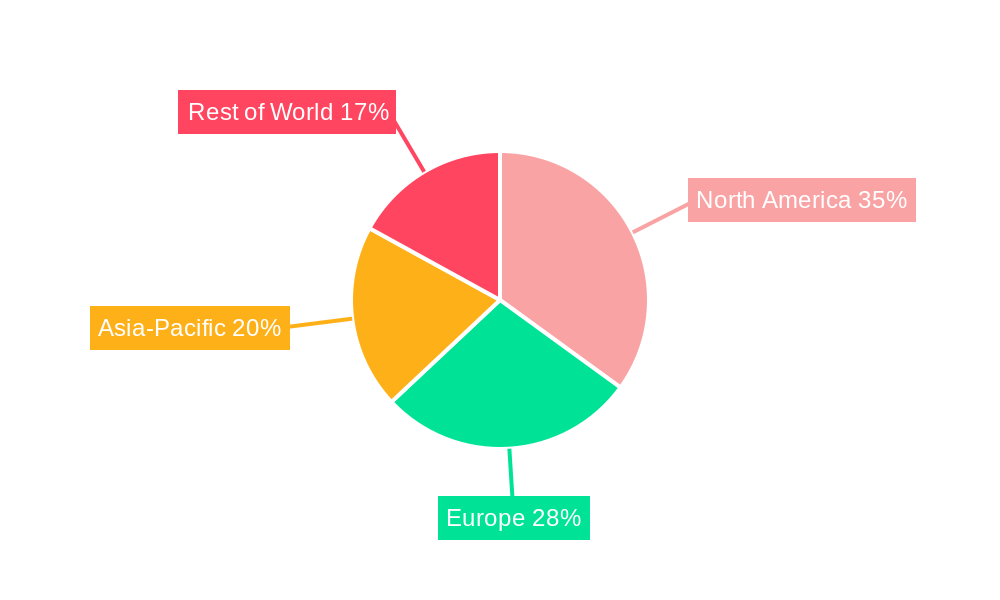
Underwater Lights Regional Market Share
Geographic Coverage of Underwater Lights
Underwater Lights REPORT HIGHLIGHTS
| Aspects | Details |
|---|---|
| Study Period | 2020-2034 |
| Base Year | 2025 |
| Estimated Year | 2026 |
| Forecast Period | 2026-2034 |
| Historical Period | 2020-2025 |
| Growth Rate | CAGR of 5.5% from 2020-2034 |
| Segmentation |
|
Table of Contents
- 1. Introduction
- 1.1. Research Scope
- 1.2. Market Segmentation
- 1.3. Research Methodology
- 1.4. Definitions and Assumptions
- 2. Executive Summary
- 2.1. Introduction
- 3. Market Dynamics
- 3.1. Introduction
- 3.2. Market Drivers
- 3.3. Market Restrains
- 3.4. Market Trends
- 4. Market Factor Analysis
- 4.1. Porters Five Forces
- 4.2. Supply/Value Chain
- 4.3. PESTEL analysis
- 4.4. Market Entropy
- 4.5. Patent/Trademark Analysis
- 5. Global Underwater Lights Analysis, Insights and Forecast, 2020-2032
- 5.1. Market Analysis, Insights and Forecast - by Application
- 5.1.1. Seawater
- 5.1.2. Freshwater
- 5.1.3. Recreational Waters
- 5.2. Market Analysis, Insights and Forecast - by Types
- 5.2.1. Recessed
- 5.2.2. Surface Mount
- 5.3. Market Analysis, Insights and Forecast - by Region
- 5.3.1. North America
- 5.3.2. South America
- 5.3.3. Europe
- 5.3.4. Middle East & Africa
- 5.3.5. Asia Pacific
- 5.1. Market Analysis, Insights and Forecast - by Application
- 6. North America Underwater Lights Analysis, Insights and Forecast, 2020-2032
- 6.1. Market Analysis, Insights and Forecast - by Application
- 6.1.1. Seawater
- 6.1.2. Freshwater
- 6.1.3. Recreational Waters
- 6.2. Market Analysis, Insights and Forecast - by Types
- 6.2.1. Recessed
- 6.2.2. Surface Mount
- 6.1. Market Analysis, Insights and Forecast - by Application
- 7. South America Underwater Lights Analysis, Insights and Forecast, 2020-2032
- 7.1. Market Analysis, Insights and Forecast - by Application
- 7.1.1. Seawater
- 7.1.2. Freshwater
- 7.1.3. Recreational Waters
- 7.2. Market Analysis, Insights and Forecast - by Types
- 7.2.1. Recessed
- 7.2.2. Surface Mount
- 7.1. Market Analysis, Insights and Forecast - by Application
- 8. Europe Underwater Lights Analysis, Insights and Forecast, 2020-2032
- 8.1. Market Analysis, Insights and Forecast - by Application
- 8.1.1. Seawater
- 8.1.2. Freshwater
- 8.1.3. Recreational Waters
- 8.2. Market Analysis, Insights and Forecast - by Types
- 8.2.1. Recessed
- 8.2.2. Surface Mount
- 8.1. Market Analysis, Insights and Forecast - by Application
- 9. Middle East & Africa Underwater Lights Analysis, Insights and Forecast, 2020-2032
- 9.1. Market Analysis, Insights and Forecast - by Application
- 9.1.1. Seawater
- 9.1.2. Freshwater
- 9.1.3. Recreational Waters
- 9.2. Market Analysis, Insights and Forecast - by Types
- 9.2.1. Recessed
- 9.2.2. Surface Mount
- 9.1. Market Analysis, Insights and Forecast - by Application
- 10. Asia Pacific Underwater Lights Analysis, Insights and Forecast, 2020-2032
- 10.1. Market Analysis, Insights and Forecast - by Application
- 10.1.1. Seawater
- 10.1.2. Freshwater
- 10.1.3. Recreational Waters
- 10.2. Market Analysis, Insights and Forecast - by Types
- 10.2.1. Recessed
- 10.2.2. Surface Mount
- 10.1. Market Analysis, Insights and Forecast - by Application
- 11. Competitive Analysis
- 11.1. Global Market Share Analysis 2025
- 11.2. Company Profiles
- 11.2.1 Aqualuma
- 11.2.1.1. Overview
- 11.2.1.2. Products
- 11.2.1.3. SWOT Analysis
- 11.2.1.4. Recent Developments
- 11.2.1.5. Financials (Based on Availability)
- 11.2.2 Attwood
- 11.2.2.1. Overview
- 11.2.2.2. Products
- 11.2.2.3. SWOT Analysis
- 11.2.2.4. Recent Developments
- 11.2.2.5. Financials (Based on Availability)
- 11.2.3 OceanLED
- 11.2.3.1. Overview
- 11.2.3.2. Products
- 11.2.3.3. SWOT Analysis
- 11.2.3.4. Recent Developments
- 11.2.3.5. Financials (Based on Availability)
- 11.2.4 Perko Inc.
- 11.2.4.1. Overview
- 11.2.4.2. Products
- 11.2.4.3. SWOT Analysis
- 11.2.4.4. Recent Developments
- 11.2.4.5. Financials (Based on Availability)
- 11.2.5 TH Marine
- 11.2.5.1. Overview
- 11.2.5.2. Products
- 11.2.5.3. SWOT Analysis
- 11.2.5.4. Recent Developments
- 11.2.5.5. Financials (Based on Availability)
- 11.2.6 Dabmar
- 11.2.6.1. Overview
- 11.2.6.2. Products
- 11.2.6.3. SWOT Analysis
- 11.2.6.4. Recent Developments
- 11.2.6.5. Financials (Based on Availability)
- 11.2.7 Deep Glow
- 11.2.7.1. Overview
- 11.2.7.2. Products
- 11.2.7.3. SWOT Analysis
- 11.2.7.4. Recent Developments
- 11.2.7.5. Financials (Based on Availability)
- 11.2.8 Underwater Lights North America
- 11.2.8.1. Overview
- 11.2.8.2. Products
- 11.2.8.3. SWOT Analysis
- 11.2.8.4. Recent Developments
- 11.2.8.5. Financials (Based on Availability)
- 11.2.9 Shadow-Caster Marine LEDs
- 11.2.9.1. Overview
- 11.2.9.2. Products
- 11.2.9.3. SWOT Analysis
- 11.2.9.4. Recent Developments
- 11.2.9.5. Financials (Based on Availability)
- 11.2.10 Lumishore
- 11.2.10.1. Overview
- 11.2.10.2. Products
- 11.2.10.3. SWOT Analysis
- 11.2.10.4. Recent Developments
- 11.2.10.5. Financials (Based on Availability)
- 11.2.1 Aqualuma
List of Figures
- Figure 1: Global Underwater Lights Revenue Breakdown (million, %) by Region 2025 & 2033
- Figure 2: Global Underwater Lights Volume Breakdown (K, %) by Region 2025 & 2033
- Figure 3: North America Underwater Lights Revenue (million), by Application 2025 & 2033
- Figure 4: North America Underwater Lights Volume (K), by Application 2025 & 2033
- Figure 5: North America Underwater Lights Revenue Share (%), by Application 2025 & 2033
- Figure 6: North America Underwater Lights Volume Share (%), by Application 2025 & 2033
- Figure 7: North America Underwater Lights Revenue (million), by Types 2025 & 2033
- Figure 8: North America Underwater Lights Volume (K), by Types 2025 & 2033
- Figure 9: North America Underwater Lights Revenue Share (%), by Types 2025 & 2033
- Figure 10: North America Underwater Lights Volume Share (%), by Types 2025 & 2033
- Figure 11: North America Underwater Lights Revenue (million), by Country 2025 & 2033
- Figure 12: North America Underwater Lights Volume (K), by Country 2025 & 2033
- Figure 13: North America Underwater Lights Revenue Share (%), by Country 2025 & 2033
- Figure 14: North America Underwater Lights Volume Share (%), by Country 2025 & 2033
- Figure 15: South America Underwater Lights Revenue (million), by Application 2025 & 2033
- Figure 16: South America Underwater Lights Volume (K), by Application 2025 & 2033
- Figure 17: South America Underwater Lights Revenue Share (%), by Application 2025 & 2033
- Figure 18: South America Underwater Lights Volume Share (%), by Application 2025 & 2033
- Figure 19: South America Underwater Lights Revenue (million), by Types 2025 & 2033
- Figure 20: South America Underwater Lights Volume (K), by Types 2025 & 2033
- Figure 21: South America Underwater Lights Revenue Share (%), by Types 2025 & 2033
- Figure 22: South America Underwater Lights Volume Share (%), by Types 2025 & 2033
- Figure 23: South America Underwater Lights Revenue (million), by Country 2025 & 2033
- Figure 24: South America Underwater Lights Volume (K), by Country 2025 & 2033
- Figure 25: South America Underwater Lights Revenue Share (%), by Country 2025 & 2033
- Figure 26: South America Underwater Lights Volume Share (%), by Country 2025 & 2033
- Figure 27: Europe Underwater Lights Revenue (million), by Application 2025 & 2033
- Figure 28: Europe Underwater Lights Volume (K), by Application 2025 & 2033
- Figure 29: Europe Underwater Lights Revenue Share (%), by Application 2025 & 2033
- Figure 30: Europe Underwater Lights Volume Share (%), by Application 2025 & 2033
- Figure 31: Europe Underwater Lights Revenue (million), by Types 2025 & 2033
- Figure 32: Europe Underwater Lights Volume (K), by Types 2025 & 2033
- Figure 33: Europe Underwater Lights Revenue Share (%), by Types 2025 & 2033
- Figure 34: Europe Underwater Lights Volume Share (%), by Types 2025 & 2033
- Figure 35: Europe Underwater Lights Revenue (million), by Country 2025 & 2033
- Figure 36: Europe Underwater Lights Volume (K), by Country 2025 & 2033
- Figure 37: Europe Underwater Lights Revenue Share (%), by Country 2025 & 2033
- Figure 38: Europe Underwater Lights Volume Share (%), by Country 2025 & 2033
- Figure 39: Middle East & Africa Underwater Lights Revenue (million), by Application 2025 & 2033
- Figure 40: Middle East & Africa Underwater Lights Volume (K), by Application 2025 & 2033
- Figure 41: Middle East & Africa Underwater Lights Revenue Share (%), by Application 2025 & 2033
- Figure 42: Middle East & Africa Underwater Lights Volume Share (%), by Application 2025 & 2033
- Figure 43: Middle East & Africa Underwater Lights Revenue (million), by Types 2025 & 2033
- Figure 44: Middle East & Africa Underwater Lights Volume (K), by Types 2025 & 2033
- Figure 45: Middle East & Africa Underwater Lights Revenue Share (%), by Types 2025 & 2033
- Figure 46: Middle East & Africa Underwater Lights Volume Share (%), by Types 2025 & 2033
- Figure 47: Middle East & Africa Underwater Lights Revenue (million), by Country 2025 & 2033
- Figure 48: Middle East & Africa Underwater Lights Volume (K), by Country 2025 & 2033
- Figure 49: Middle East & Africa Underwater Lights Revenue Share (%), by Country 2025 & 2033
- Figure 50: Middle East & Africa Underwater Lights Volume Share (%), by Country 2025 & 2033
- Figure 51: Asia Pacific Underwater Lights Revenue (million), by Application 2025 & 2033
- Figure 52: Asia Pacific Underwater Lights Volume (K), by Application 2025 & 2033
- Figure 53: Asia Pacific Underwater Lights Revenue Share (%), by Application 2025 & 2033
- Figure 54: Asia Pacific Underwater Lights Volume Share (%), by Application 2025 & 2033
- Figure 55: Asia Pacific Underwater Lights Revenue (million), by Types 2025 & 2033
- Figure 56: Asia Pacific Underwater Lights Volume (K), by Types 2025 & 2033
- Figure 57: Asia Pacific Underwater Lights Revenue Share (%), by Types 2025 & 2033
- Figure 58: Asia Pacific Underwater Lights Volume Share (%), by Types 2025 & 2033
- Figure 59: Asia Pacific Underwater Lights Revenue (million), by Country 2025 & 2033
- Figure 60: Asia Pacific Underwater Lights Volume (K), by Country 2025 & 2033
- Figure 61: Asia Pacific Underwater Lights Revenue Share (%), by Country 2025 & 2033
- Figure 62: Asia Pacific Underwater Lights Volume Share (%), by Country 2025 & 2033
List of Tables
- Table 1: Global Underwater Lights Revenue million Forecast, by Application 2020 & 2033
- Table 2: Global Underwater Lights Volume K Forecast, by Application 2020 & 2033
- Table 3: Global Underwater Lights Revenue million Forecast, by Types 2020 & 2033
- Table 4: Global Underwater Lights Volume K Forecast, by Types 2020 & 2033
- Table 5: Global Underwater Lights Revenue million Forecast, by Region 2020 & 2033
- Table 6: Global Underwater Lights Volume K Forecast, by Region 2020 & 2033
- Table 7: Global Underwater Lights Revenue million Forecast, by Application 2020 & 2033
- Table 8: Global Underwater Lights Volume K Forecast, by Application 2020 & 2033
- Table 9: Global Underwater Lights Revenue million Forecast, by Types 2020 & 2033
- Table 10: Global Underwater Lights Volume K Forecast, by Types 2020 & 2033
- Table 11: Global Underwater Lights Revenue million Forecast, by Country 2020 & 2033
- Table 12: Global Underwater Lights Volume K Forecast, by Country 2020 & 2033
- Table 13: United States Underwater Lights Revenue (million) Forecast, by Application 2020 & 2033
- Table 14: United States Underwater Lights Volume (K) Forecast, by Application 2020 & 2033
- Table 15: Canada Underwater Lights Revenue (million) Forecast, by Application 2020 & 2033
- Table 16: Canada Underwater Lights Volume (K) Forecast, by Application 2020 & 2033
- Table 17: Mexico Underwater Lights Revenue (million) Forecast, by Application 2020 & 2033
- Table 18: Mexico Underwater Lights Volume (K) Forecast, by Application 2020 & 2033
- Table 19: Global Underwater Lights Revenue million Forecast, by Application 2020 & 2033
- Table 20: Global Underwater Lights Volume K Forecast, by Application 2020 & 2033
- Table 21: Global Underwater Lights Revenue million Forecast, by Types 2020 & 2033
- Table 22: Global Underwater Lights Volume K Forecast, by Types 2020 & 2033
- Table 23: Global Underwater Lights Revenue million Forecast, by Country 2020 & 2033
- Table 24: Global Underwater Lights Volume K Forecast, by Country 2020 & 2033
- Table 25: Brazil Underwater Lights Revenue (million) Forecast, by Application 2020 & 2033
- Table 26: Brazil Underwater Lights Volume (K) Forecast, by Application 2020 & 2033
- Table 27: Argentina Underwater Lights Revenue (million) Forecast, by Application 2020 & 2033
- Table 28: Argentina Underwater Lights Volume (K) Forecast, by Application 2020 & 2033
- Table 29: Rest of South America Underwater Lights Revenue (million) Forecast, by Application 2020 & 2033
- Table 30: Rest of South America Underwater Lights Volume (K) Forecast, by Application 2020 & 2033
- Table 31: Global Underwater Lights Revenue million Forecast, by Application 2020 & 2033
- Table 32: Global Underwater Lights Volume K Forecast, by Application 2020 & 2033
- Table 33: Global Underwater Lights Revenue million Forecast, by Types 2020 & 2033
- Table 34: Global Underwater Lights Volume K Forecast, by Types 2020 & 2033
- Table 35: Global Underwater Lights Revenue million Forecast, by Country 2020 & 2033
- Table 36: Global Underwater Lights Volume K Forecast, by Country 2020 & 2033
- Table 37: United Kingdom Underwater Lights Revenue (million) Forecast, by Application 2020 & 2033
- Table 38: United Kingdom Underwater Lights Volume (K) Forecast, by Application 2020 & 2033
- Table 39: Germany Underwater Lights Revenue (million) Forecast, by Application 2020 & 2033
- Table 40: Germany Underwater Lights Volume (K) Forecast, by Application 2020 & 2033
- Table 41: France Underwater Lights Revenue (million) Forecast, by Application 2020 & 2033
- Table 42: France Underwater Lights Volume (K) Forecast, by Application 2020 & 2033
- Table 43: Italy Underwater Lights Revenue (million) Forecast, by Application 2020 & 2033
- Table 44: Italy Underwater Lights Volume (K) Forecast, by Application 2020 & 2033
- Table 45: Spain Underwater Lights Revenue (million) Forecast, by Application 2020 & 2033
- Table 46: Spain Underwater Lights Volume (K) Forecast, by Application 2020 & 2033
- Table 47: Russia Underwater Lights Revenue (million) Forecast, by Application 2020 & 2033
- Table 48: Russia Underwater Lights Volume (K) Forecast, by Application 2020 & 2033
- Table 49: Benelux Underwater Lights Revenue (million) Forecast, by Application 2020 & 2033
- Table 50: Benelux Underwater Lights Volume (K) Forecast, by Application 2020 & 2033
- Table 51: Nordics Underwater Lights Revenue (million) Forecast, by Application 2020 & 2033
- Table 52: Nordics Underwater Lights Volume (K) Forecast, by Application 2020 & 2033
- Table 53: Rest of Europe Underwater Lights Revenue (million) Forecast, by Application 2020 & 2033
- Table 54: Rest of Europe Underwater Lights Volume (K) Forecast, by Application 2020 & 2033
- Table 55: Global Underwater Lights Revenue million Forecast, by Application 2020 & 2033
- Table 56: Global Underwater Lights Volume K Forecast, by Application 2020 & 2033
- Table 57: Global Underwater Lights Revenue million Forecast, by Types 2020 & 2033
- Table 58: Global Underwater Lights Volume K Forecast, by Types 2020 & 2033
- Table 59: Global Underwater Lights Revenue million Forecast, by Country 2020 & 2033
- Table 60: Global Underwater Lights Volume K Forecast, by Country 2020 & 2033
- Table 61: Turkey Underwater Lights Revenue (million) Forecast, by Application 2020 & 2033
- Table 62: Turkey Underwater Lights Volume (K) Forecast, by Application 2020 & 2033
- Table 63: Israel Underwater Lights Revenue (million) Forecast, by Application 2020 & 2033
- Table 64: Israel Underwater Lights Volume (K) Forecast, by Application 2020 & 2033
- Table 65: GCC Underwater Lights Revenue (million) Forecast, by Application 2020 & 2033
- Table 66: GCC Underwater Lights Volume (K) Forecast, by Application 2020 & 2033
- Table 67: North Africa Underwater Lights Revenue (million) Forecast, by Application 2020 & 2033
- Table 68: North Africa Underwater Lights Volume (K) Forecast, by Application 2020 & 2033
- Table 69: South Africa Underwater Lights Revenue (million) Forecast, by Application 2020 & 2033
- Table 70: South Africa Underwater Lights Volume (K) Forecast, by Application 2020 & 2033
- Table 71: Rest of Middle East & Africa Underwater Lights Revenue (million) Forecast, by Application 2020 & 2033
- Table 72: Rest of Middle East & Africa Underwater Lights Volume (K) Forecast, by Application 2020 & 2033
- Table 73: Global Underwater Lights Revenue million Forecast, by Application 2020 & 2033
- Table 74: Global Underwater Lights Volume K Forecast, by Application 2020 & 2033
- Table 75: Global Underwater Lights Revenue million Forecast, by Types 2020 & 2033
- Table 76: Global Underwater Lights Volume K Forecast, by Types 2020 & 2033
- Table 77: Global Underwater Lights Revenue million Forecast, by Country 2020 & 2033
- Table 78: Global Underwater Lights Volume K Forecast, by Country 2020 & 2033
- Table 79: China Underwater Lights Revenue (million) Forecast, by Application 2020 & 2033
- Table 80: China Underwater Lights Volume (K) Forecast, by Application 2020 & 2033
- Table 81: India Underwater Lights Revenue (million) Forecast, by Application 2020 & 2033
- Table 82: India Underwater Lights Volume (K) Forecast, by Application 2020 & 2033
- Table 83: Japan Underwater Lights Revenue (million) Forecast, by Application 2020 & 2033
- Table 84: Japan Underwater Lights Volume (K) Forecast, by Application 2020 & 2033
- Table 85: South Korea Underwater Lights Revenue (million) Forecast, by Application 2020 & 2033
- Table 86: South Korea Underwater Lights Volume (K) Forecast, by Application 2020 & 2033
- Table 87: ASEAN Underwater Lights Revenue (million) Forecast, by Application 2020 & 2033
- Table 88: ASEAN Underwater Lights Volume (K) Forecast, by Application 2020 & 2033
- Table 89: Oceania Underwater Lights Revenue (million) Forecast, by Application 2020 & 2033
- Table 90: Oceania Underwater Lights Volume (K) Forecast, by Application 2020 & 2033
- Table 91: Rest of Asia Pacific Underwater Lights Revenue (million) Forecast, by Application 2020 & 2033
- Table 92: Rest of Asia Pacific Underwater Lights Volume (K) Forecast, by Application 2020 & 2033
Frequently Asked Questions
1. What is the projected Compound Annual Growth Rate (CAGR) of the Underwater Lights?
The projected CAGR is approximately 5.5%.
2. Which companies are prominent players in the Underwater Lights?
Key companies in the market include Aqualuma, Attwood, OceanLED, Perko Inc., TH Marine, Dabmar, Deep Glow, Underwater Lights North America, Shadow-Caster Marine LEDs, Lumishore.
3. What are the main segments of the Underwater Lights?
The market segments include Application, Types.
4. Can you provide details about the market size?
The market size is estimated to be USD 361.7 million as of 2022.
5. What are some drivers contributing to market growth?
N/A
6. What are the notable trends driving market growth?
N/A
7. Are there any restraints impacting market growth?
N/A
8. Can you provide examples of recent developments in the market?
N/A
9. What pricing options are available for accessing the report?
Pricing options include single-user, multi-user, and enterprise licenses priced at USD 3350.00, USD 5025.00, and USD 6700.00 respectively.
10. Is the market size provided in terms of value or volume?
The market size is provided in terms of value, measured in million and volume, measured in K.
11. Are there any specific market keywords associated with the report?
Yes, the market keyword associated with the report is "Underwater Lights," which aids in identifying and referencing the specific market segment covered.
12. How do I determine which pricing option suits my needs best?
The pricing options vary based on user requirements and access needs. Individual users may opt for single-user licenses, while businesses requiring broader access may choose multi-user or enterprise licenses for cost-effective access to the report.
13. Are there any additional resources or data provided in the Underwater Lights report?
While the report offers comprehensive insights, it's advisable to review the specific contents or supplementary materials provided to ascertain if additional resources or data are available.
14. How can I stay updated on further developments or reports in the Underwater Lights?
To stay informed about further developments, trends, and reports in the Underwater Lights, consider subscribing to industry newsletters, following relevant companies and organizations, or regularly checking reputable industry news sources and publications.
Methodology
Step 1 - Identification of Relevant Samples Size from Population Database


Step 2 - Approaches for Defining Global Market Size (Value, Volume* & Price*)

Note*: In applicable scenarios
Step 3 - Data Sources
Primary Research
- Web Analytics
- Survey Reports
- Research Institute
- Latest Research Reports
- Opinion Leaders
Secondary Research
- Annual Reports
- White Paper
- Latest Press Release
- Industry Association
- Paid Database
- Investor Presentations

Step 4 - Data Triangulation
Involves using different sources of information in order to increase the validity of a study
These sources are likely to be stakeholders in a program - participants, other researchers, program staff, other community members, and so on.
Then we put all data in single framework & apply various statistical tools to find out the dynamic on the market.
During the analysis stage, feedback from the stakeholder groups would be compared to determine areas of agreement as well as areas of divergence