Key Insights
The US advanced composites market, valued at $52.4 billion in 2025, is projected for significant growth with a Compound Annual Growth Rate (CAGR) of 8.9% from 2025 to 2033. Key growth drivers include widespread adoption in the automotive sector for improved fuel efficiency and performance, and increasing demand from aerospace for lightweight, high-strength materials. The renewable energy sector, particularly wind turbine blades, and construction, benefiting from durability and lightweight properties, also contribute to expansion. Technological advancements in manufacturing processes like RTM and vacuum infusion are mitigating production cost and complexity challenges. The market is segmented by material type, with thermoset polymers currently leading, and carbon fiber reinforced polymers showing steady growth. Structural assembly applications dominate due to the widespread use of composites in load-bearing components. Leading companies such as BASF, Toray Industries, and Teijin Limited are spearheading innovation. The Northeast and West regions represent substantial market share, fueled by established manufacturing and strong industrial demand.
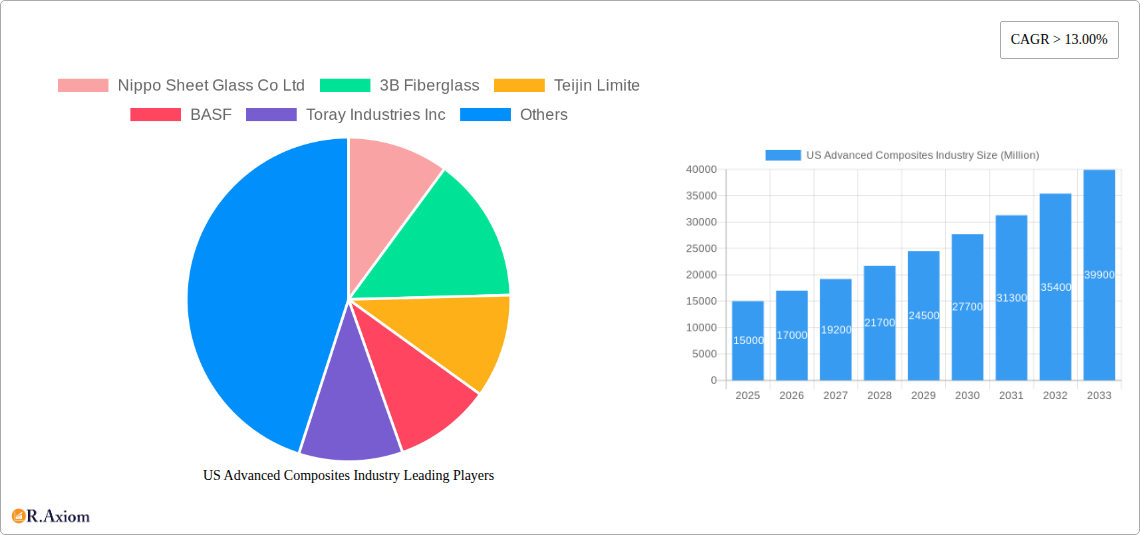
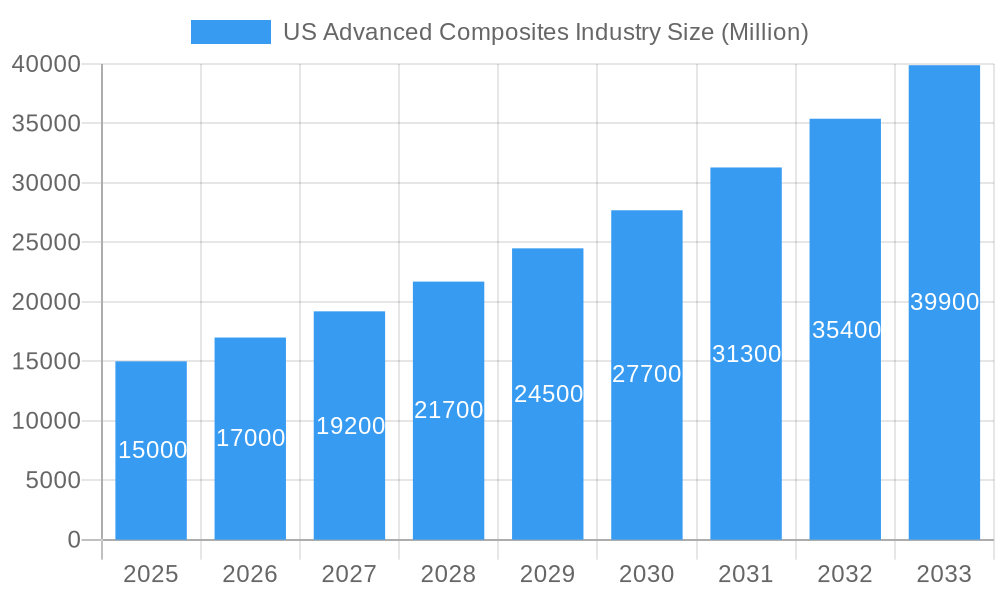
US Advanced Composites Industry Market Size (In Billion)
The forecast period (2025-2033) indicates substantial expansion. The growing adoption of thermoplastic polymers, offering enhanced recyclability and processing, is expected to influence the material type segment. Applications will diversify, with accelerated growth in powertrain components and expansion into marine and sporting goods sectors. The competitive landscape features both established and emerging players, fostering innovation and market expansion. Continued R&D investment and supportive government policies for sustainable materials will further propel the US advanced composites market.
US Advanced Composites Industry Company Market Share
US Advanced Composites Industry: 2019-2033 Market Forecast & Analysis
This comprehensive report provides a detailed analysis of the US Advanced Composites Industry, covering the period 2019-2033. It offers in-depth insights into market size, growth drivers, challenges, and opportunities, empowering stakeholders with actionable intelligence for strategic decision-making. The report leverages extensive primary and secondary research to provide a robust and reliable forecast.
US Advanced Composites Industry Market Concentration & Innovation
The US advanced composites market exhibits a moderately concentrated landscape, with a few major players holding significant market share. Key players like BASF, Toray Industries Inc, and Teijin Limited dominate various segments based on material type and application. Market share data for 2025 estimates that BASF holds approximately 15% market share, followed by Toray at 12% and Teijin at 10%. Innovation is driven by the increasing demand for lightweight, high-strength materials in automotive and aerospace applications. Stringent regulatory frameworks, particularly concerning environmental impact, are also pushing innovation towards sustainable composite materials. Significant M&A activity has shaped the industry, with deal values exceeding $xx Million in the last five years, primarily focusing on acquiring specialized technologies and expanding geographic reach. Product substitutes, such as advanced metals and high-strength plastics, pose competitive threats, particularly in cost-sensitive applications. End-user trends towards sustainability and lightweighting are driving demand for advanced composite materials.
- Market Concentration: Moderately concentrated, with top 3 players holding ~37% market share in 2025.
- Innovation Drivers: Lightweighting needs, sustainability regulations, and material performance improvements.
- M&A Activity: Over $xx Million in deal value over the past five years.
- Product Substitutes: Advanced metals and high-strength plastics.
- End-User Trends: Increased demand for lightweight and sustainable materials.
US Advanced Composites Industry Industry Trends & Insights
The US advanced composites market is experiencing robust growth, with a projected CAGR of xx% from 2025 to 2033. This growth is fueled by several factors, including increasing adoption in the automotive industry for lightweighting and fuel efficiency improvements, expanding use in aerospace applications for structural components, and rising demand from the wind energy sector. Technological disruptions, such as advancements in additive manufacturing and automated fiber placement, are transforming manufacturing processes and improving efficiency. Consumer preferences for environmentally friendly and sustainable products are driving demand for bio-based and recyclable composites. The competitive landscape is characterized by intense rivalry among established players and emerging innovators, leading to continuous product development and price competition. Market penetration of advanced composites in various applications is steadily increasing, driven by cost reductions and improved performance characteristics.
Dominant Markets & Segments in US Advanced Composites Industry
The automotive sector remains the dominant application segment, accounting for approximately 40% of the market in 2025. Within material types, carbon fiber composites command the highest value share due to their superior performance characteristics, while glass fiber composites dominate in volume due to lower costs. Resin Transfer Molding (RTM) and Vacuum Infusion Processing (VIP) are the leading production types, owing to their cost-effectiveness and suitability for large-scale manufacturing. The Western region of the US shows the highest market growth, fueled by a robust aerospace industry and government investments in infrastructure development.
Key Drivers for Automotive Dominance: Lightweighting regulations, fuel efficiency standards, and increasing vehicle production.
Key Drivers for Carbon Fiber Dominance: Superior strength-to-weight ratio and high performance capabilities.
Key Drivers for RTM & VIP Dominance: Cost-effective production methods suitable for large parts.
Key Drivers for Western Region Dominance: Strong aerospace sector and infrastructure development.
Leading Production Type: Resin Transfer Molding (RTM)
Leading Material Type: Carbon Fiber
Leading Application Type: Automotive
US Advanced Composites Industry Product Developments
Recent product innovations focus on enhancing material properties, such as improved impact resistance, fatigue strength, and thermal stability. New applications are emerging in areas such as 3D-printed composites for customized parts and high-performance sporting goods. Competitive advantages are increasingly gained through process optimization, reduced manufacturing costs, and specialized material formulations tailored to specific application needs. The trend towards sustainable composites, utilizing recycled materials and bio-based resins, is gaining significant momentum.
Report Scope & Segmentation Analysis
This report segments the US Advanced Composites Industry by Production Type (Hand Layup, RTM, VIP, Injection Molding, Compression Molding), Material Type (Thermoset Polymer, Thermoplastic Polymer, Carbon Fiber, Glass Fiber, Others), and Application Type (Structural Assembly, Power Train Components, Interior, Exterior, Others). Each segment's growth projections, market sizes (in Millions), and competitive dynamics are meticulously analyzed. Detailed forecasts are provided for the period 2025-2033, providing insights into future market trends and opportunities.
Key Drivers of US Advanced Composites Industry Growth
Several factors are driving the growth of the US advanced composites industry. Technological advancements in material science and manufacturing processes are leading to higher-performance and cost-effective composites. Government initiatives promoting lightweighting in vehicles and renewable energy infrastructure are further accelerating market growth. The increasing demand for high-performance materials in diverse applications, such as aerospace and wind energy, is a significant growth driver.
Challenges in the US Advanced Composites Industry Sector
The industry faces challenges such as high material costs, the complexity of manufacturing processes, and concerns about the environmental impact of certain composite materials. Supply chain disruptions and fluctuations in raw material prices can also affect profitability. Competition from alternative materials and technological advancements present ongoing challenges. The impact of these challenges is estimated to reduce the overall market growth by approximately xx% by 2033.
Emerging Opportunities in US Advanced Composites Industry
Emerging opportunities lie in the development and adoption of sustainable composite materials, advancements in additive manufacturing, and the expansion into new application areas, such as medical implants and consumer electronics. The increasing demand for lightweight, high-strength materials in infrastructure projects and renewable energy applications presents significant growth potential. The development of new manufacturing processes to improve efficiency and reduce costs will also create new opportunities.
Leading Players in the US Advanced Composites Industry Market
- Nippo Sheet Glass Co Ltd
- 3B Fiberglass
- Teijin Limited
- BASF
- Toray Industries Inc
- General Motors Company
- Base Group
- Cytec Industries Inc
- BMW
- Delphi Auto
- SGL Group
Key Developments in US Advanced Composites Industry Industry
- 2022 Q4: BASF announces a new bio-based resin for composite applications.
- 2023 Q1: Toray Industries invests in a new carbon fiber production facility.
- 2023 Q3: General Motors launches a new vehicle model with extensive use of composite materials. (Further developments will be added as available)
Strategic Outlook for US Advanced Composites Industry Market
The US advanced composites market is poised for continued growth, driven by technological advancements, increasing demand across diverse sectors, and supportive government policies. Opportunities exist in developing sustainable and cost-effective composite solutions to address environmental concerns and improve market competitiveness. Strategic investments in research and development, coupled with strategic partnerships and mergers and acquisitions, will play a crucial role in shaping the future of this dynamic industry.
US Advanced Composites Industry Segmentation
-
1. Productino Type
- 1.1. Hand Layup
- 1.2. Resin Transfer Molding
- 1.3. Vacuum Infusion Processing
- 1.4. Injection Molding
- 1.5. Compression Molding
-
2. Material Type
- 2.1. Thermoset Polymer
- 2.2. Thermoplastic Polymer
- 2.3. Carbon Fiber
- 2.4. Glass Fiber
- 2.5. Others
-
3. Application Type
- 3.1. Structural Assembly
- 3.2. Power Train Components
- 3.3. Interior
- 3.4. Exterior
- 3.5. Others
US Advanced Composites Industry Segmentation By Geography
-
1. North America
- 1.1. United States
- 1.2. Canada
- 1.3. Mexico
-
2. South America
- 2.1. Brazil
- 2.2. Argentina
- 2.3. Rest of South America
-
3. Europe
- 3.1. United Kingdom
- 3.2. Germany
- 3.3. France
- 3.4. Italy
- 3.5. Spain
- 3.6. Russia
- 3.7. Benelux
- 3.8. Nordics
- 3.9. Rest of Europe
-
4. Middle East & Africa
- 4.1. Turkey
- 4.2. Israel
- 4.3. GCC
- 4.4. North Africa
- 4.5. South Africa
- 4.6. Rest of Middle East & Africa
-
5. Asia Pacific
- 5.1. China
- 5.2. India
- 5.3. Japan
- 5.4. South Korea
- 5.5. ASEAN
- 5.6. Oceania
- 5.7. Rest of Asia Pacific
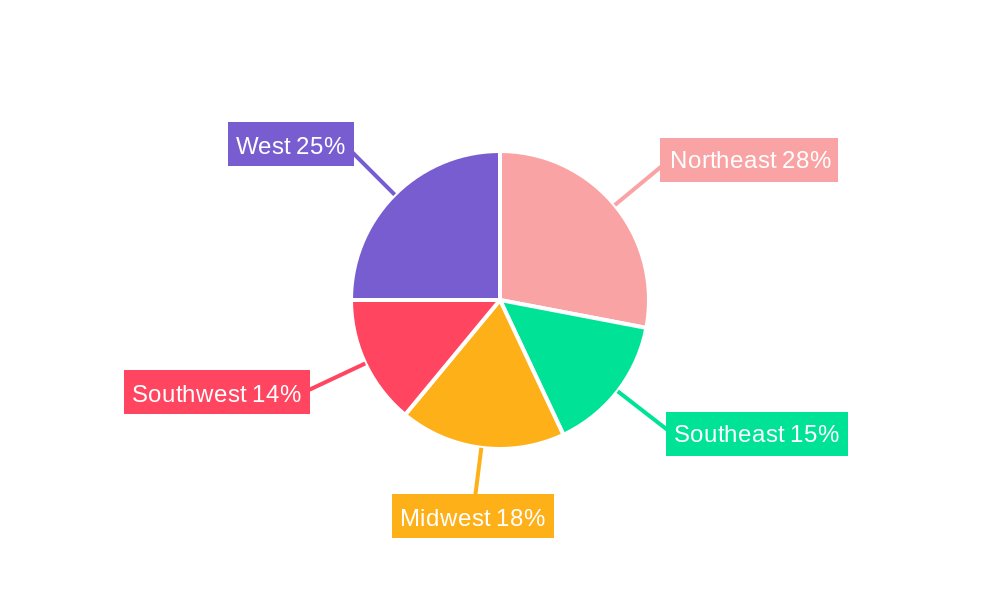
US Advanced Composites Industry Regional Market Share
Geographic Coverage of US Advanced Composites Industry
US Advanced Composites Industry REPORT HIGHLIGHTS
| Aspects | Details |
|---|---|
| Study Period | 2020-2034 |
| Base Year | 2025 |
| Estimated Year | 2026 |
| Forecast Period | 2026-2034 |
| Historical Period | 2020-2025 |
| Growth Rate | CAGR of 8.9% from 2020-2034 |
| Segmentation |
|
Table of Contents
- 1. Introduction
- 1.1. Research Scope
- 1.2. Market Segmentation
- 1.3. Research Objective
- 1.4. Definitions and Assumptions
- 2. Executive Summary
- 2.1. Market Snapshot
- 3. Market Dynamics
- 3.1. Market Drivers
- 3.2. Market Restrains
- 3.3. Market Trends
- 3.4. Market Opportunities
- 4. Market Factor Analysis
- 4.1. Porters Five Forces
- 4.1.1. Bargaining Power of Suppliers
- 4.1.2. Bargaining Power of Buyers
- 4.1.3. Threat of New Entrants
- 4.1.4. Threat of Substitutes
- 4.1.5. Competitive Rivalry
- 4.2. PESTEL analysis
- 4.3. BCG Analysis
- 4.3.1. Stars (High Growth, High Market Share)
- 4.3.2. Cash Cows (Low Growth, High Market Share)
- 4.3.3. Question Mark (High Growth, Low Market Share)
- 4.3.4. Dogs (Low Growth, Low Market Share)
- 4.4. Ansoff Matrix Analysis
- 4.5. Supply Chain Analysis
- 4.6. Regulatory Landscape
- 4.7. Current Market Potential and Opportunity Assessment (TAM–SAM–SOM Framework)
- 4.8. RAX Analyst Note
- 4.1. Porters Five Forces
- 5. Market Analysis, Insights and Forecast 2021-2033
- 5.1. Market Analysis, Insights and Forecast - by Productino Type
- 5.1.1. Hand Layup
- 5.1.2. Resin Transfer Molding
- 5.1.3. Vacuum Infusion Processing
- 5.1.4. Injection Molding
- 5.1.5. Compression Molding
- 5.2. Market Analysis, Insights and Forecast - by Material Type
- 5.2.1. Thermoset Polymer
- 5.2.2. Thermoplastic Polymer
- 5.2.3. Carbon Fiber
- 5.2.4. Glass Fiber
- 5.2.5. Others
- 5.3. Market Analysis, Insights and Forecast - by Application Type
- 5.3.1. Structural Assembly
- 5.3.2. Power Train Components
- 5.3.3. Interior
- 5.3.4. Exterior
- 5.3.5. Others
- 5.4. Market Analysis, Insights and Forecast - by Region
- 5.4.1. North America
- 5.4.2. South America
- 5.4.3. Europe
- 5.4.4. Middle East & Africa
- 5.4.5. Asia Pacific
- 5.1. Market Analysis, Insights and Forecast - by Productino Type
- 6. Global US Advanced Composites Industry Analysis, Insights and Forecast, 2021-2033
- 6.1. Market Analysis, Insights and Forecast - by Productino Type
- 6.1.1. Hand Layup
- 6.1.2. Resin Transfer Molding
- 6.1.3. Vacuum Infusion Processing
- 6.1.4. Injection Molding
- 6.1.5. Compression Molding
- 6.2. Market Analysis, Insights and Forecast - by Material Type
- 6.2.1. Thermoset Polymer
- 6.2.2. Thermoplastic Polymer
- 6.2.3. Carbon Fiber
- 6.2.4. Glass Fiber
- 6.2.5. Others
- 6.3. Market Analysis, Insights and Forecast - by Application Type
- 6.3.1. Structural Assembly
- 6.3.2. Power Train Components
- 6.3.3. Interior
- 6.3.4. Exterior
- 6.3.5. Others
- 6.1. Market Analysis, Insights and Forecast - by Productino Type
- 7. North America US Advanced Composites Industry Analysis, Insights and Forecast, 2020-2032
- 7.1. Market Analysis, Insights and Forecast - by Productino Type
- 7.1.1. Hand Layup
- 7.1.2. Resin Transfer Molding
- 7.1.3. Vacuum Infusion Processing
- 7.1.4. Injection Molding
- 7.1.5. Compression Molding
- 7.2. Market Analysis, Insights and Forecast - by Material Type
- 7.2.1. Thermoset Polymer
- 7.2.2. Thermoplastic Polymer
- 7.2.3. Carbon Fiber
- 7.2.4. Glass Fiber
- 7.2.5. Others
- 7.3. Market Analysis, Insights and Forecast - by Application Type
- 7.3.1. Structural Assembly
- 7.3.2. Power Train Components
- 7.3.3. Interior
- 7.3.4. Exterior
- 7.3.5. Others
- 7.1. Market Analysis, Insights and Forecast - by Productino Type
- 8. South America US Advanced Composites Industry Analysis, Insights and Forecast, 2020-2032
- 8.1. Market Analysis, Insights and Forecast - by Productino Type
- 8.1.1. Hand Layup
- 8.1.2. Resin Transfer Molding
- 8.1.3. Vacuum Infusion Processing
- 8.1.4. Injection Molding
- 8.1.5. Compression Molding
- 8.2. Market Analysis, Insights and Forecast - by Material Type
- 8.2.1. Thermoset Polymer
- 8.2.2. Thermoplastic Polymer
- 8.2.3. Carbon Fiber
- 8.2.4. Glass Fiber
- 8.2.5. Others
- 8.3. Market Analysis, Insights and Forecast - by Application Type
- 8.3.1. Structural Assembly
- 8.3.2. Power Train Components
- 8.3.3. Interior
- 8.3.4. Exterior
- 8.3.5. Others
- 8.1. Market Analysis, Insights and Forecast - by Productino Type
- 9. Europe US Advanced Composites Industry Analysis, Insights and Forecast, 2020-2032
- 9.1. Market Analysis, Insights and Forecast - by Productino Type
- 9.1.1. Hand Layup
- 9.1.2. Resin Transfer Molding
- 9.1.3. Vacuum Infusion Processing
- 9.1.4. Injection Molding
- 9.1.5. Compression Molding
- 9.2. Market Analysis, Insights and Forecast - by Material Type
- 9.2.1. Thermoset Polymer
- 9.2.2. Thermoplastic Polymer
- 9.2.3. Carbon Fiber
- 9.2.4. Glass Fiber
- 9.2.5. Others
- 9.3. Market Analysis, Insights and Forecast - by Application Type
- 9.3.1. Structural Assembly
- 9.3.2. Power Train Components
- 9.3.3. Interior
- 9.3.4. Exterior
- 9.3.5. Others
- 9.1. Market Analysis, Insights and Forecast - by Productino Type
- 10. Middle East & Africa US Advanced Composites Industry Analysis, Insights and Forecast, 2020-2032
- 10.1. Market Analysis, Insights and Forecast - by Productino Type
- 10.1.1. Hand Layup
- 10.1.2. Resin Transfer Molding
- 10.1.3. Vacuum Infusion Processing
- 10.1.4. Injection Molding
- 10.1.5. Compression Molding
- 10.2. Market Analysis, Insights and Forecast - by Material Type
- 10.2.1. Thermoset Polymer
- 10.2.2. Thermoplastic Polymer
- 10.2.3. Carbon Fiber
- 10.2.4. Glass Fiber
- 10.2.5. Others
- 10.3. Market Analysis, Insights and Forecast - by Application Type
- 10.3.1. Structural Assembly
- 10.3.2. Power Train Components
- 10.3.3. Interior
- 10.3.4. Exterior
- 10.3.5. Others
- 10.1. Market Analysis, Insights and Forecast - by Productino Type
- 11. Asia Pacific US Advanced Composites Industry Analysis, Insights and Forecast, 2020-2032
- 11.1. Market Analysis, Insights and Forecast - by Productino Type
- 11.1.1. Hand Layup
- 11.1.2. Resin Transfer Molding
- 11.1.3. Vacuum Infusion Processing
- 11.1.4. Injection Molding
- 11.1.5. Compression Molding
- 11.2. Market Analysis, Insights and Forecast - by Material Type
- 11.2.1. Thermoset Polymer
- 11.2.2. Thermoplastic Polymer
- 11.2.3. Carbon Fiber
- 11.2.4. Glass Fiber
- 11.2.5. Others
- 11.3. Market Analysis, Insights and Forecast - by Application Type
- 11.3.1. Structural Assembly
- 11.3.2. Power Train Components
- 11.3.3. Interior
- 11.3.4. Exterior
- 11.3.5. Others
- 11.1. Market Analysis, Insights and Forecast - by Productino Type
- 12. Competitive Analysis
- 12.1. Company Profiles
- 12.1.1 Nippo Sheet Glass Co Ltd
- 12.1.1.1. Company Overview
- 12.1.1.2. Products
- 12.1.1.3. Company Financials
- 12.1.1.4. SWOT Analysis
- 12.1.2 3B Fiberglass
- 12.1.2.1. Company Overview
- 12.1.2.2. Products
- 12.1.2.3. Company Financials
- 12.1.2.4. SWOT Analysis
- 12.1.3 Teijin Limite
- 12.1.3.1. Company Overview
- 12.1.3.2. Products
- 12.1.3.3. Company Financials
- 12.1.3.4. SWOT Analysis
- 12.1.4 BASF
- 12.1.4.1. Company Overview
- 12.1.4.2. Products
- 12.1.4.3. Company Financials
- 12.1.4.4. SWOT Analysis
- 12.1.5 Toray Industries Inc
- 12.1.5.1. Company Overview
- 12.1.5.2. Products
- 12.1.5.3. Company Financials
- 12.1.5.4. SWOT Analysis
- 12.1.6 General Motors Company
- 12.1.6.1. Company Overview
- 12.1.6.2. Products
- 12.1.6.3. Company Financials
- 12.1.6.4. SWOT Analysis
- 12.1.7 Base Group
- 12.1.7.1. Company Overview
- 12.1.7.2. Products
- 12.1.7.3. Company Financials
- 12.1.7.4. SWOT Analysis
- 12.1.8 Cytec Industries Inc
- 12.1.8.1. Company Overview
- 12.1.8.2. Products
- 12.1.8.3. Company Financials
- 12.1.8.4. SWOT Analysis
- 12.1.9 BMW
- 12.1.9.1. Company Overview
- 12.1.9.2. Products
- 12.1.9.3. Company Financials
- 12.1.9.4. SWOT Analysis
- 12.1.10 Delphi Auto
- 12.1.10.1. Company Overview
- 12.1.10.2. Products
- 12.1.10.3. Company Financials
- 12.1.10.4. SWOT Analysis
- 12.1.11 SGL Group
- 12.1.11.1. Company Overview
- 12.1.11.2. Products
- 12.1.11.3. Company Financials
- 12.1.11.4. SWOT Analysis
- 12.1.1 Nippo Sheet Glass Co Ltd
- 12.2. Market Entropy
- 12.2.1 Company's Key Areas Served
- 12.2.2 Recent Developments
- 12.3. Company Market Share Analysis 2025
- 12.3.1 Top 5 Companies Market Share Analysis
- 12.3.2 Top 3 Companies Market Share Analysis
- 12.4. List of Potential Customers
- 13. Research Methodology
List of Figures
- Figure 1: Global US Advanced Composites Industry Revenue Breakdown (billion, %) by Region 2025 & 2033
- Figure 2: North America US Advanced Composites Industry Revenue (billion), by Productino Type 2025 & 2033
- Figure 3: North America US Advanced Composites Industry Revenue Share (%), by Productino Type 2025 & 2033
- Figure 4: North America US Advanced Composites Industry Revenue (billion), by Material Type 2025 & 2033
- Figure 5: North America US Advanced Composites Industry Revenue Share (%), by Material Type 2025 & 2033
- Figure 6: North America US Advanced Composites Industry Revenue (billion), by Application Type 2025 & 2033
- Figure 7: North America US Advanced Composites Industry Revenue Share (%), by Application Type 2025 & 2033
- Figure 8: North America US Advanced Composites Industry Revenue (billion), by Country 2025 & 2033
- Figure 9: North America US Advanced Composites Industry Revenue Share (%), by Country 2025 & 2033
- Figure 10: South America US Advanced Composites Industry Revenue (billion), by Productino Type 2025 & 2033
- Figure 11: South America US Advanced Composites Industry Revenue Share (%), by Productino Type 2025 & 2033
- Figure 12: South America US Advanced Composites Industry Revenue (billion), by Material Type 2025 & 2033
- Figure 13: South America US Advanced Composites Industry Revenue Share (%), by Material Type 2025 & 2033
- Figure 14: South America US Advanced Composites Industry Revenue (billion), by Application Type 2025 & 2033
- Figure 15: South America US Advanced Composites Industry Revenue Share (%), by Application Type 2025 & 2033
- Figure 16: South America US Advanced Composites Industry Revenue (billion), by Country 2025 & 2033
- Figure 17: South America US Advanced Composites Industry Revenue Share (%), by Country 2025 & 2033
- Figure 18: Europe US Advanced Composites Industry Revenue (billion), by Productino Type 2025 & 2033
- Figure 19: Europe US Advanced Composites Industry Revenue Share (%), by Productino Type 2025 & 2033
- Figure 20: Europe US Advanced Composites Industry Revenue (billion), by Material Type 2025 & 2033
- Figure 21: Europe US Advanced Composites Industry Revenue Share (%), by Material Type 2025 & 2033
- Figure 22: Europe US Advanced Composites Industry Revenue (billion), by Application Type 2025 & 2033
- Figure 23: Europe US Advanced Composites Industry Revenue Share (%), by Application Type 2025 & 2033
- Figure 24: Europe US Advanced Composites Industry Revenue (billion), by Country 2025 & 2033
- Figure 25: Europe US Advanced Composites Industry Revenue Share (%), by Country 2025 & 2033
- Figure 26: Middle East & Africa US Advanced Composites Industry Revenue (billion), by Productino Type 2025 & 2033
- Figure 27: Middle East & Africa US Advanced Composites Industry Revenue Share (%), by Productino Type 2025 & 2033
- Figure 28: Middle East & Africa US Advanced Composites Industry Revenue (billion), by Material Type 2025 & 2033
- Figure 29: Middle East & Africa US Advanced Composites Industry Revenue Share (%), by Material Type 2025 & 2033
- Figure 30: Middle East & Africa US Advanced Composites Industry Revenue (billion), by Application Type 2025 & 2033
- Figure 31: Middle East & Africa US Advanced Composites Industry Revenue Share (%), by Application Type 2025 & 2033
- Figure 32: Middle East & Africa US Advanced Composites Industry Revenue (billion), by Country 2025 & 2033
- Figure 33: Middle East & Africa US Advanced Composites Industry Revenue Share (%), by Country 2025 & 2033
- Figure 34: Asia Pacific US Advanced Composites Industry Revenue (billion), by Productino Type 2025 & 2033
- Figure 35: Asia Pacific US Advanced Composites Industry Revenue Share (%), by Productino Type 2025 & 2033
- Figure 36: Asia Pacific US Advanced Composites Industry Revenue (billion), by Material Type 2025 & 2033
- Figure 37: Asia Pacific US Advanced Composites Industry Revenue Share (%), by Material Type 2025 & 2033
- Figure 38: Asia Pacific US Advanced Composites Industry Revenue (billion), by Application Type 2025 & 2033
- Figure 39: Asia Pacific US Advanced Composites Industry Revenue Share (%), by Application Type 2025 & 2033
- Figure 40: Asia Pacific US Advanced Composites Industry Revenue (billion), by Country 2025 & 2033
- Figure 41: Asia Pacific US Advanced Composites Industry Revenue Share (%), by Country 2025 & 2033
List of Tables
- Table 1: Global US Advanced Composites Industry Revenue billion Forecast, by Productino Type 2020 & 2033
- Table 2: Global US Advanced Composites Industry Revenue billion Forecast, by Material Type 2020 & 2033
- Table 3: Global US Advanced Composites Industry Revenue billion Forecast, by Application Type 2020 & 2033
- Table 4: Global US Advanced Composites Industry Revenue billion Forecast, by Region 2020 & 2033
- Table 5: Global US Advanced Composites Industry Revenue billion Forecast, by Productino Type 2020 & 2033
- Table 6: Global US Advanced Composites Industry Revenue billion Forecast, by Material Type 2020 & 2033
- Table 7: Global US Advanced Composites Industry Revenue billion Forecast, by Application Type 2020 & 2033
- Table 8: Global US Advanced Composites Industry Revenue billion Forecast, by Country 2020 & 2033
- Table 9: United States US Advanced Composites Industry Revenue (billion) Forecast, by Application 2020 & 2033
- Table 10: Canada US Advanced Composites Industry Revenue (billion) Forecast, by Application 2020 & 2033
- Table 11: Mexico US Advanced Composites Industry Revenue (billion) Forecast, by Application 2020 & 2033
- Table 12: Global US Advanced Composites Industry Revenue billion Forecast, by Productino Type 2020 & 2033
- Table 13: Global US Advanced Composites Industry Revenue billion Forecast, by Material Type 2020 & 2033
- Table 14: Global US Advanced Composites Industry Revenue billion Forecast, by Application Type 2020 & 2033
- Table 15: Global US Advanced Composites Industry Revenue billion Forecast, by Country 2020 & 2033
- Table 16: Brazil US Advanced Composites Industry Revenue (billion) Forecast, by Application 2020 & 2033
- Table 17: Argentina US Advanced Composites Industry Revenue (billion) Forecast, by Application 2020 & 2033
- Table 18: Rest of South America US Advanced Composites Industry Revenue (billion) Forecast, by Application 2020 & 2033
- Table 19: Global US Advanced Composites Industry Revenue billion Forecast, by Productino Type 2020 & 2033
- Table 20: Global US Advanced Composites Industry Revenue billion Forecast, by Material Type 2020 & 2033
- Table 21: Global US Advanced Composites Industry Revenue billion Forecast, by Application Type 2020 & 2033
- Table 22: Global US Advanced Composites Industry Revenue billion Forecast, by Country 2020 & 2033
- Table 23: United Kingdom US Advanced Composites Industry Revenue (billion) Forecast, by Application 2020 & 2033
- Table 24: Germany US Advanced Composites Industry Revenue (billion) Forecast, by Application 2020 & 2033
- Table 25: France US Advanced Composites Industry Revenue (billion) Forecast, by Application 2020 & 2033
- Table 26: Italy US Advanced Composites Industry Revenue (billion) Forecast, by Application 2020 & 2033
- Table 27: Spain US Advanced Composites Industry Revenue (billion) Forecast, by Application 2020 & 2033
- Table 28: Russia US Advanced Composites Industry Revenue (billion) Forecast, by Application 2020 & 2033
- Table 29: Benelux US Advanced Composites Industry Revenue (billion) Forecast, by Application 2020 & 2033
- Table 30: Nordics US Advanced Composites Industry Revenue (billion) Forecast, by Application 2020 & 2033
- Table 31: Rest of Europe US Advanced Composites Industry Revenue (billion) Forecast, by Application 2020 & 2033
- Table 32: Global US Advanced Composites Industry Revenue billion Forecast, by Productino Type 2020 & 2033
- Table 33: Global US Advanced Composites Industry Revenue billion Forecast, by Material Type 2020 & 2033
- Table 34: Global US Advanced Composites Industry Revenue billion Forecast, by Application Type 2020 & 2033
- Table 35: Global US Advanced Composites Industry Revenue billion Forecast, by Country 2020 & 2033
- Table 36: Turkey US Advanced Composites Industry Revenue (billion) Forecast, by Application 2020 & 2033
- Table 37: Israel US Advanced Composites Industry Revenue (billion) Forecast, by Application 2020 & 2033
- Table 38: GCC US Advanced Composites Industry Revenue (billion) Forecast, by Application 2020 & 2033
- Table 39: North Africa US Advanced Composites Industry Revenue (billion) Forecast, by Application 2020 & 2033
- Table 40: South Africa US Advanced Composites Industry Revenue (billion) Forecast, by Application 2020 & 2033
- Table 41: Rest of Middle East & Africa US Advanced Composites Industry Revenue (billion) Forecast, by Application 2020 & 2033
- Table 42: Global US Advanced Composites Industry Revenue billion Forecast, by Productino Type 2020 & 2033
- Table 43: Global US Advanced Composites Industry Revenue billion Forecast, by Material Type 2020 & 2033
- Table 44: Global US Advanced Composites Industry Revenue billion Forecast, by Application Type 2020 & 2033
- Table 45: Global US Advanced Composites Industry Revenue billion Forecast, by Country 2020 & 2033
- Table 46: China US Advanced Composites Industry Revenue (billion) Forecast, by Application 2020 & 2033
- Table 47: India US Advanced Composites Industry Revenue (billion) Forecast, by Application 2020 & 2033
- Table 48: Japan US Advanced Composites Industry Revenue (billion) Forecast, by Application 2020 & 2033
- Table 49: South Korea US Advanced Composites Industry Revenue (billion) Forecast, by Application 2020 & 2033
- Table 50: ASEAN US Advanced Composites Industry Revenue (billion) Forecast, by Application 2020 & 2033
- Table 51: Oceania US Advanced Composites Industry Revenue (billion) Forecast, by Application 2020 & 2033
- Table 52: Rest of Asia Pacific US Advanced Composites Industry Revenue (billion) Forecast, by Application 2020 & 2033
Frequently Asked Questions
1. What is the projected Compound Annual Growth Rate (CAGR) of the US Advanced Composites Industry?
The projected CAGR is approximately 8.9%.
2. Which companies are prominent players in the US Advanced Composites Industry?
Key companies in the market include Nippo Sheet Glass Co Ltd, 3B Fiberglass, Teijin Limite, BASF, Toray Industries Inc, General Motors Company, Base Group, Cytec Industries Inc, BMW, Delphi Auto, SGL Group.
3. What are the main segments of the US Advanced Composites Industry?
The market segments include Productino Type, Material Type, Application Type.
4. Can you provide details about the market size?
The market size is estimated to be USD 52.4 billion as of 2022.
5. What are some drivers contributing to market growth?
4.; Increasing demand from automobile industry4.; Increased focus on precision products.
6. What are the notable trends driving market growth?
Growing Demand for Lightweight Materials.
7. Are there any restraints impacting market growth?
4.; The cost of production and transportation4.; Regulations and quality standards.
8. Can you provide examples of recent developments in the market?
N/A
9. What pricing options are available for accessing the report?
Pricing options include single-user, multi-user, and enterprise licenses priced at USD 3800, USD 4500, and USD 5800 respectively.
10. Is the market size provided in terms of value or volume?
The market size is provided in terms of value, measured in billion.
11. Are there any specific market keywords associated with the report?
Yes, the market keyword associated with the report is "US Advanced Composites Industry," which aids in identifying and referencing the specific market segment covered.
12. How do I determine which pricing option suits my needs best?
The pricing options vary based on user requirements and access needs. Individual users may opt for single-user licenses, while businesses requiring broader access may choose multi-user or enterprise licenses for cost-effective access to the report.
13. Are there any additional resources or data provided in the US Advanced Composites Industry report?
While the report offers comprehensive insights, it's advisable to review the specific contents or supplementary materials provided to ascertain if additional resources or data are available.
14. How can I stay updated on further developments or reports in the US Advanced Composites Industry?
To stay informed about further developments, trends, and reports in the US Advanced Composites Industry, consider subscribing to industry newsletters, following relevant companies and organizations, or regularly checking reputable industry news sources and publications.
Methodology
Step 1 - Identification of Relevant Samples Size from Population Database


Step 2 - Approaches for Defining Global Market Size (Value, Volume* & Price*)

Note*: In applicable scenarios
Step 3 - Data Sources
Primary Research
- Web Analytics
- Survey Reports
- Research Institute
- Latest Research Reports
- Opinion Leaders
Secondary Research
- Annual Reports
- White Paper
- Latest Press Release
- Industry Association
- Paid Database
- Investor Presentations

Step 4 - Data Triangulation
Involves using different sources of information in order to increase the validity of a study
These sources are likely to be stakeholders in a program - participants, other researchers, program staff, other community members, and so on.
Then we put all data in single framework & apply various statistical tools to find out the dynamic on the market.
During the analysis stage, feedback from the stakeholder groups would be compared to determine areas of agreement as well as areas of divergence

