Key Insights
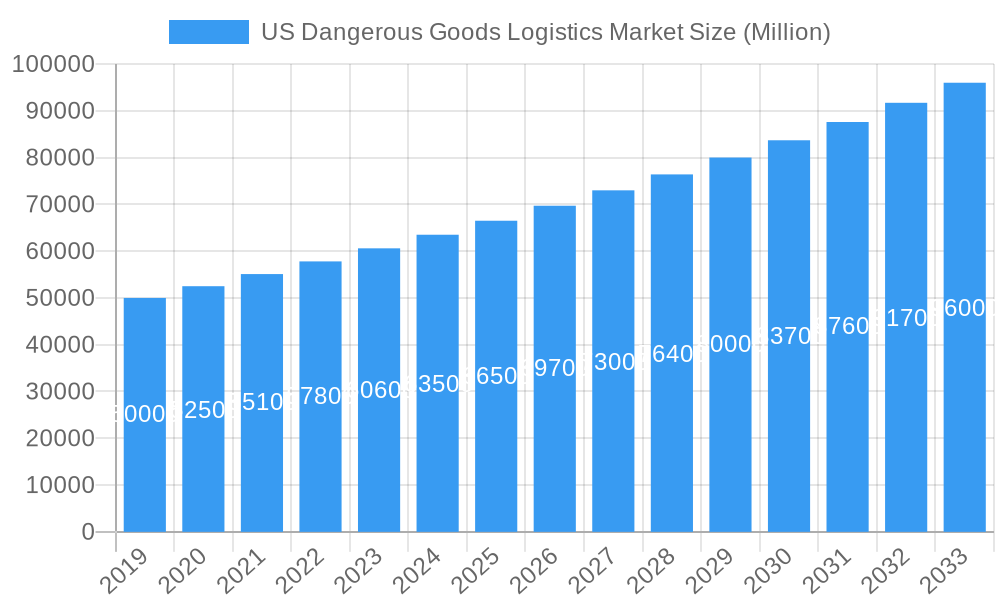
The US Dangerous Goods Logistics market is projected for substantial growth, expected to reach approximately $251.13 billion by 2025, with a Compound Annual Growth Rate (CAGR) of 7.6% through 2033. This expansion is driven by increasing global trade and the resultant rise in hazardous material movement across industries such as pharmaceuticals, chemicals, and manufacturing. Stringent regulatory compliance necessitates specialized logistics, further stimulating demand. Technological advancements, including real-time tracking, advanced safety protocols, and risk management software, are enhancing transportation efficiency and safety. Key market segments include transportation (road and air freight) and warehousing/distribution services. The growing complexity of international supply chains for hazardous materials also fuels demand for specialized international logistics solutions.
US Dangerous Goods Logistics Market Market Size (In Billion)
Market restraints include the high costs of specialized equipment, trained personnel, and comprehensive insurance. Evolving regulations also require continuous adaptation and investment in compliance. However, industry resilience, a strong commitment to safety, and strategic partnerships are expected to mitigate these challenges. Leading players are investing in specialized infrastructure and training to meet escalating demand. Emerging trends include the adoption of sustainable logistics practices and the integration of digital solutions for enhanced visibility and compliance, ensuring the secure and efficient flow of hazardous materials.
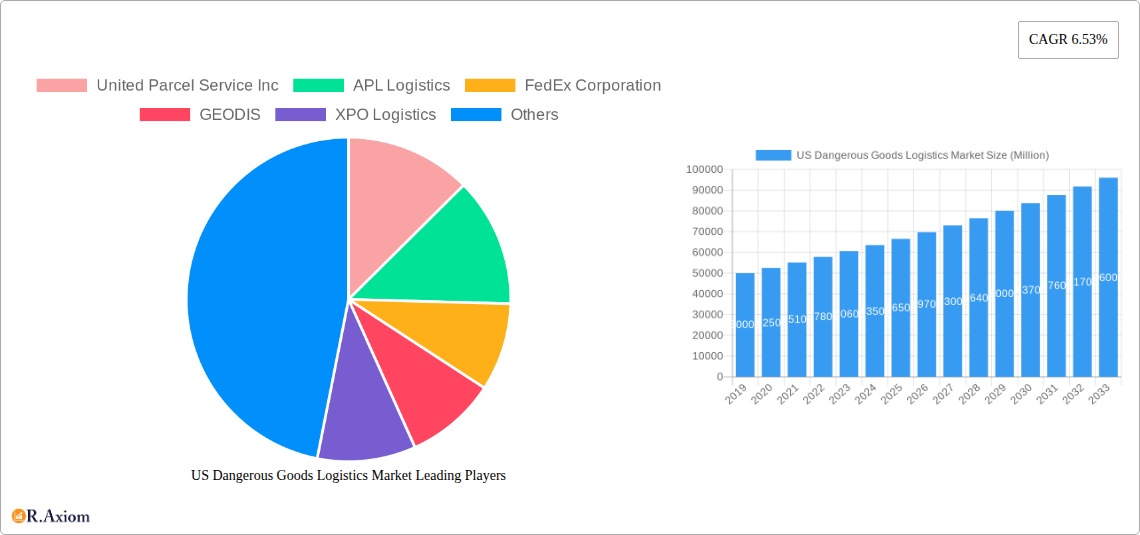
US Dangerous Goods Logistics Market Company Market Share
This report offers an exhaustive analysis of the US Dangerous Goods Logistics Market, providing critical insights for stakeholders. It covers the historical period (2019-2024), uses 2025 as the base year, and forecasts market dynamics, segmentation, competitive landscape, and future outlook through 2033.
US Dangerous Goods Logistics Market Market Concentration & Innovation
The US Dangerous Goods Logistics Market is characterized by a moderate level of concentration, with leading players like United Parcel Service Inc., FedEx Corporation, and Deutsche Post DHL Group holding significant market shares. Innovation in this sector is primarily driven by the relentless pursuit of enhanced safety protocols, technological advancements in tracking and monitoring, and the development of specialized equipment for handling hazardous materials. Regulatory frameworks, such as those enforced by the Department of Transportation (DOT) and the Occupational Safety and Health Administration (OSHA), play a pivotal role in shaping market practices and ensuring compliance. The increasing demand for specialized logistics solutions for sectors like pharmaceuticals, chemicals, and energy fuels innovation in niche services. While product substitutes are limited due to the inherent nature of dangerous goods, advancements in containment and transportation technologies offer incremental improvements. End-user trends highlight a growing preference for end-to-end logistics providers capable of managing the entire lifecycle of hazardous material shipments, from packaging and labeling to transportation and disposal. Mergers and acquisitions (M&A) activities, though not always high-value, are strategic for consolidating capabilities and expanding service offerings. For instance, past M&A activities in the broader logistics sector suggest potential for consolidation in specialized dangerous goods segments.
US Dangerous Goods Logistics Market Industry Trends & Insights
The US Dangerous Goods Logistics Market is poised for significant expansion, driven by a confluence of economic, technological, and regulatory factors. The market is projected to grow at a Compound Annual Growth Rate (CAGR) of approximately 5.8% from 2025 to 2033, reaching an estimated market value of over $180 Billion by 2033. This growth is underpinned by the robust manufacturing and industrial output across various sectors, including chemicals, pharmaceuticals, automotive, and aerospace, all of which necessitate the safe and compliant transportation of hazardous materials. Technological disruptions are at the forefront of industry evolution. The adoption of IoT-enabled sensors for real-time temperature, humidity, and shock monitoring is becoming standard, enhancing visibility and minimizing risks. Advanced tracking systems, including GPS and RFID, provide granular oversight of shipments, improving efficiency and security. Furthermore, the integration of Artificial Intelligence (AI) and Machine Learning (ML) is optimizing route planning, predictive maintenance of specialized fleets, and risk assessment, leading to more efficient and cost-effective operations. Consumer preferences, influenced by increased awareness of environmental, social, and governance (ESG) factors, are pushing logistics providers towards more sustainable practices, including the use of alternative fuel vehicles and optimized packaging solutions to reduce waste. Competitive dynamics are intensifying, with established players investing heavily in specialized infrastructure, training, and technology to differentiate themselves. New entrants, often technology-focused, are challenging incumbents by offering innovative digital solutions and specialized services. The increasing complexity of international trade regulations for dangerous goods also presents a significant market penetration opportunity for providers with expertise in global compliance. The market penetration for specialized dangerous goods logistics services is estimated to be around 75% in 2025, with significant room for growth in emerging industries and smaller enterprises.
Dominant Markets & Segments in US Dangerous Goods Logistics Market
The dominance within the US Dangerous Goods Logistics Market is multifaceted, with the Transportation segment, particularly Road transportation, currently holding the largest market share. This dominance is driven by its unparalleled flexibility, accessibility, and cost-effectiveness for regional and national movements of a wide array of dangerous goods. Key drivers for road transportation's supremacy include:
- Extensive Infrastructure: The well-developed highway network across the US enables efficient last-mile delivery and broad geographical coverage.
- Regulatory Adaptability: Road carriers have adapted well to stringent DOT regulations, investing in specialized vehicles and driver training.
- Economic Policies: Government initiatives supporting freight transportation and infrastructure development indirectly benefit road logistics.
While road transportation leads, Air transportation is gaining significant traction for high-value, time-sensitive dangerous goods, especially in sectors like pharmaceuticals and high-tech components. Its dominance is fueled by:
- Speed and Efficiency: Crucial for urgent shipments where time is of the essence.
- Global Reach: Essential for international trade and connecting remote regions.
- Technological Advancements: Innovations in air cargo handling and specialized containers are improving safety and efficiency.
The Warehousing and Distribution segment is also a critical component of the market, with specialized facilities designed for the safe storage and handling of hazardous materials. Growth here is propelled by:
- Increasing Inventory Demands: Businesses require secure storage solutions for their dangerous goods inventory.
- Value-Added Services: The demand for services like relabeling, repackaging, and waste management within warehouses is rising.
- Proximity to End-Users: Strategic placement of warehouses optimizes delivery times and reduces transportation costs.
By Destination, the Domestic segment currently represents the larger portion of the market due to the sheer volume of intra-country trade and manufacturing. However, the International segment is experiencing a robust growth trajectory, propelled by globalization and the increasing complexity of global supply chains for hazardous materials. Key drivers for international growth include:
- Global Trade Expansion: Increased cross-border movement of chemicals, raw materials, and finished goods.
- Harmonization of Regulations: Efforts to standardize international dangerous goods regulations simplify cross-border logistics.
- Emerging Markets: Growing industrialization in various regions drives demand for US-based dangerous goods logistics expertise.
Value-added services are becoming increasingly crucial differentiators, encompassing services beyond basic transportation and storage. This includes regulatory consulting, emergency response planning, and specialized training, all of which contribute to enhanced safety and compliance, driving value for end-users.
US Dangerous Goods Logistics Market Product Developments
Product innovations in the US Dangerous Goods Logistics Market are focused on enhancing safety, efficiency, and compliance. This includes the development of advanced containment systems, such as improved drum designs and specialized intermodal containers that offer superior protection against leaks and external damage. Smart packaging solutions incorporating real-time monitoring sensors for temperature, humidity, and shock are becoming more prevalent, providing unprecedented visibility into shipment conditions. Furthermore, advancements in specialized vehicle technologies, including electric and alternative fuel fleets equipped with advanced safety features, are contributing to more sustainable and secure transportation of dangerous goods. These innovations provide a competitive advantage by reducing transit risks, minimizing product spoilage or damage, and ensuring adherence to stringent regulatory standards.
Report Scope & Segmentation Analysis
This report provides a comprehensive analysis of the US Dangerous Goods Logistics Market segmented by Function and Destination.
- Transportation (Road, Rail, Water, Pipeline, Air): This segment examines the different modes of transport used for dangerous goods. Road transportation is expected to maintain its leading position due to its flexibility, with significant growth anticipated in air cargo for time-sensitive and high-value shipments. Pipeline logistics will remain crucial for bulk liquid and gas movements, while rail and water offer cost-effective options for large volumes over longer distances.
- Warehousing and Distribution: This segment focuses on the specialized storage and handling of hazardous materials. Growth is driven by the increasing need for secure, compliant warehousing solutions and the demand for value-added services within these facilities.
- Value-added: This segment encompasses services beyond core logistics, such as regulatory compliance consulting, emergency response, and specialized training. This is a high-growth area as businesses seek comprehensive solutions for managing dangerous goods.
- Domestic: This segment covers the movement of dangerous goods within the United States. It is expected to continue its substantial market share due to the robust domestic industrial and manufacturing base.
- International: This segment analyzes the cross-border movement of dangerous goods. It is projected to witness strong growth driven by global trade expansion and the increasing complexity of international regulations.
Key Drivers of US Dangerous Goods Logistics Market Growth
Several key drivers are propelling the US Dangerous Goods Logistics Market forward. The robust industrial and manufacturing sectors, particularly in chemicals, pharmaceuticals, and energy, generate consistent demand for hazardous material transportation. Stringent regulatory compliance, while a challenge, also drives innovation and investment in specialized services. Technological advancements in tracking, monitoring, and safety equipment are enhancing operational efficiency and reducing risks. Furthermore, the growing global trade necessitates sophisticated international logistics solutions for dangerous goods. The increasing emphasis on supply chain resilience and visibility is also pushing companies to partner with specialized dangerous goods logistics providers.
Challenges in the US Dangerous Goods Logistics Market Sector
The US Dangerous Goods Logistics Market faces several significant challenges. Navigating complex and evolving regulatory landscapes across federal, state, and international levels demands continuous adaptation and investment. Shortages of skilled labor, particularly trained drivers and hazardous materials handlers, pose a persistent constraint. Infrastructure limitations, especially in certain regions or for specific modes of transport, can impede efficiency. Rising operational costs, including fuel prices and insurance premiums, impact profitability. Furthermore, public perception and safety concerns surrounding the transportation of hazardous materials require constant diligence and proactive risk management.
Emerging Opportunities in US Dangerous Goods Logistics Market
Emerging opportunities in the US Dangerous Goods Logistics Market lie in several key areas. The growth of e-commerce and the increasing shipment of hazardous materials for online retail present a significant new avenue. The expansion of the biopharmaceutical and specialty chemical industries creates demand for highly specialized and temperature-controlled logistics. The development and adoption of sustainable logistics solutions, such as electric vehicles and optimized route planning, offer both environmental and cost-saving benefits. Furthermore, leveraging big data analytics and AI to provide predictive insights and optimize supply chain operations presents a substantial opportunity for differentiation and efficiency gains. The demand for integrated, end-to-end solutions that encompass compliance, risk management, and specialized handling is also a growing trend.
Leading Players in the US Dangerous Goods Logistics Market Market
- United Parcel Service Inc.
- APL Logistics
- FedEx Corporation
- GEODIS
- XPO Logistics
- Landstar System Inc
- DB Schenker (The Americas)
- Kuehne + Nagel
- Schneider Logistics
- Deutsche Post DHL Group
- DSV
Key Developments in US Dangerous Goods Logistics Market Industry
- 2023: FedEx Corporation announced significant investments in its specialized fleet and training programs to enhance dangerous goods handling capabilities.
- 2023: United Parcel Service Inc. expanded its network of dedicated hazardous materials facilities to improve regional capacity and response times.
- 2022: DB Schenker (The Americas) launched a new digital platform for real-time tracking and compliance management of dangerous goods shipments.
- 2022: APL Logistics invested in advanced temperature-controlled containers to cater to the growing demand for pharmaceutical and chemical logistics.
- 2021: GEODIS acquired a specialized dangerous goods logistics provider to strengthen its chemical sector offerings.
- 2021: Kuehne + Nagel enhanced its dangerous goods consulting services, offering more comprehensive regulatory support to clients.
- 2020: XPO Logistics implemented AI-powered route optimization for its hazardous materials transportation division, leading to reduced transit times.
- 2019: Schneider Logistics introduced a new fleet of environmentally friendly trucks equipped with advanced safety features for dangerous goods.
Strategic Outlook for US Dangerous Goods Logistics Market Market
The strategic outlook for the US Dangerous Goods Logistics Market is overwhelmingly positive, driven by sustained demand from critical industries and continuous technological innovation. The market's growth will be further catalyzed by the increasing emphasis on supply chain resilience, digital transformation, and sustainability. Companies that invest in specialized infrastructure, advanced technologies, and robust compliance protocols will be best positioned to capture market share. Strategic partnerships and M&A activities are likely to continue as players seek to expand their service portfolios and geographical reach. The ability to offer integrated, end-to-end solutions that address the complex safety and regulatory requirements of dangerous goods will be paramount for long-term success and growth in this vital sector.
US Dangerous Goods Logistics Market Segmentation
-
1. BY FUNCTION
-
1.1. Transportation
- 1.1.1. Road
- 1.1.2. Rail
- 1.1.3. Water
- 1.1.4. Pipeline
- 1.1.5. Air
- 1.2. Warehousing and Distribution
- 1.3. Value-ad
-
1.1. Transportation
-
2. BY DESTINATION
- 2.1. Domestic
- 2.2. International
US Dangerous Goods Logistics Market Segmentation By Geography
-
1. North America
- 1.1. United States
- 1.2. Canada
- 1.3. Mexico
-
2. South America
- 2.1. Brazil
- 2.2. Argentina
- 2.3. Rest of South America
-
3. Europe
- 3.1. United Kingdom
- 3.2. Germany
- 3.3. France
- 3.4. Italy
- 3.5. Spain
- 3.6. Russia
- 3.7. Benelux
- 3.8. Nordics
- 3.9. Rest of Europe
-
4. Middle East & Africa
- 4.1. Turkey
- 4.2. Israel
- 4.3. GCC
- 4.4. North Africa
- 4.5. South Africa
- 4.6. Rest of Middle East & Africa
-
5. Asia Pacific
- 5.1. China
- 5.2. India
- 5.3. Japan
- 5.4. South Korea
- 5.5. ASEAN
- 5.6. Oceania
- 5.7. Rest of Asia Pacific
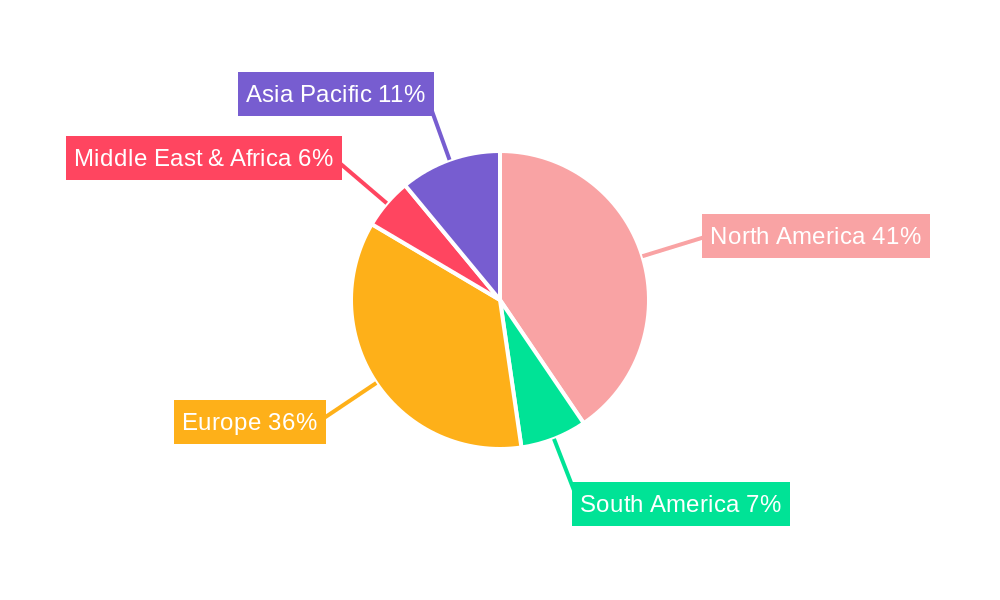
US Dangerous Goods Logistics Market Regional Market Share
Geographic Coverage of US Dangerous Goods Logistics Market
US Dangerous Goods Logistics Market REPORT HIGHLIGHTS
| Aspects | Details |
|---|---|
| Study Period | 2020-2034 |
| Base Year | 2025 |
| Estimated Year | 2026 |
| Forecast Period | 2026-2034 |
| Historical Period | 2020-2025 |
| Growth Rate | CAGR of 7.6% from 2020-2034 |
| Segmentation |
|
Table of Contents
- 1. Introduction
- 1.1. Research Scope
- 1.2. Market Segmentation
- 1.3. Research Objective
- 1.4. Definitions and Assumptions
- 2. Executive Summary
- 2.1. Market Snapshot
- 3. Market Dynamics
- 3.1. Market Drivers
- 3.2. Market Restrains
- 3.3. Market Trends
- 3.4. Market Opportunities
- 4. Market Factor Analysis
- 4.1. Porters Five Forces
- 4.1.1. Bargaining Power of Suppliers
- 4.1.2. Bargaining Power of Buyers
- 4.1.3. Threat of New Entrants
- 4.1.4. Threat of Substitutes
- 4.1.5. Competitive Rivalry
- 4.2. PESTEL analysis
- 4.3. BCG Analysis
- 4.3.1. Stars (High Growth, High Market Share)
- 4.3.2. Cash Cows (Low Growth, High Market Share)
- 4.3.3. Question Mark (High Growth, Low Market Share)
- 4.3.4. Dogs (Low Growth, Low Market Share)
- 4.4. Ansoff Matrix Analysis
- 4.5. Supply Chain Analysis
- 4.6. Regulatory Landscape
- 4.7. Current Market Potential and Opportunity Assessment (TAM–SAM–SOM Framework)
- 4.8. RAX Analyst Note
- 4.1. Porters Five Forces
- 5. Market Analysis, Insights and Forecast 2021-2033
- 5.1. Market Analysis, Insights and Forecast - by BY FUNCTION
- 5.1.1. Transportation
- 5.1.1.1. Road
- 5.1.1.2. Rail
- 5.1.1.3. Water
- 5.1.1.4. Pipeline
- 5.1.1.5. Air
- 5.1.2. Warehousing and Distribution
- 5.1.3. Value-ad
- 5.1.1. Transportation
- 5.2. Market Analysis, Insights and Forecast - by BY DESTINATION
- 5.2.1. Domestic
- 5.2.2. International
- 5.3. Market Analysis, Insights and Forecast - by Region
- 5.3.1. North America
- 5.3.2. South America
- 5.3.3. Europe
- 5.3.4. Middle East & Africa
- 5.3.5. Asia Pacific
- 5.1. Market Analysis, Insights and Forecast - by BY FUNCTION
- 6. Global US Dangerous Goods Logistics Market Analysis, Insights and Forecast, 2021-2033
- 6.1. Market Analysis, Insights and Forecast - by BY FUNCTION
- 6.1.1. Transportation
- 6.1.1.1. Road
- 6.1.1.2. Rail
- 6.1.1.3. Water
- 6.1.1.4. Pipeline
- 6.1.1.5. Air
- 6.1.2. Warehousing and Distribution
- 6.1.3. Value-ad
- 6.1.1. Transportation
- 6.2. Market Analysis, Insights and Forecast - by BY DESTINATION
- 6.2.1. Domestic
- 6.2.2. International
- 6.1. Market Analysis, Insights and Forecast - by BY FUNCTION
- 7. North America US Dangerous Goods Logistics Market Analysis, Insights and Forecast, 2020-2032
- 7.1. Market Analysis, Insights and Forecast - by BY FUNCTION
- 7.1.1. Transportation
- 7.1.1.1. Road
- 7.1.1.2. Rail
- 7.1.1.3. Water
- 7.1.1.4. Pipeline
- 7.1.1.5. Air
- 7.1.2. Warehousing and Distribution
- 7.1.3. Value-ad
- 7.1.1. Transportation
- 7.2. Market Analysis, Insights and Forecast - by BY DESTINATION
- 7.2.1. Domestic
- 7.2.2. International
- 7.1. Market Analysis, Insights and Forecast - by BY FUNCTION
- 8. South America US Dangerous Goods Logistics Market Analysis, Insights and Forecast, 2020-2032
- 8.1. Market Analysis, Insights and Forecast - by BY FUNCTION
- 8.1.1. Transportation
- 8.1.1.1. Road
- 8.1.1.2. Rail
- 8.1.1.3. Water
- 8.1.1.4. Pipeline
- 8.1.1.5. Air
- 8.1.2. Warehousing and Distribution
- 8.1.3. Value-ad
- 8.1.1. Transportation
- 8.2. Market Analysis, Insights and Forecast - by BY DESTINATION
- 8.2.1. Domestic
- 8.2.2. International
- 8.1. Market Analysis, Insights and Forecast - by BY FUNCTION
- 9. Europe US Dangerous Goods Logistics Market Analysis, Insights and Forecast, 2020-2032
- 9.1. Market Analysis, Insights and Forecast - by BY FUNCTION
- 9.1.1. Transportation
- 9.1.1.1. Road
- 9.1.1.2. Rail
- 9.1.1.3. Water
- 9.1.1.4. Pipeline
- 9.1.1.5. Air
- 9.1.2. Warehousing and Distribution
- 9.1.3. Value-ad
- 9.1.1. Transportation
- 9.2. Market Analysis, Insights and Forecast - by BY DESTINATION
- 9.2.1. Domestic
- 9.2.2. International
- 9.1. Market Analysis, Insights and Forecast - by BY FUNCTION
- 10. Middle East & Africa US Dangerous Goods Logistics Market Analysis, Insights and Forecast, 2020-2032
- 10.1. Market Analysis, Insights and Forecast - by BY FUNCTION
- 10.1.1. Transportation
- 10.1.1.1. Road
- 10.1.1.2. Rail
- 10.1.1.3. Water
- 10.1.1.4. Pipeline
- 10.1.1.5. Air
- 10.1.2. Warehousing and Distribution
- 10.1.3. Value-ad
- 10.1.1. Transportation
- 10.2. Market Analysis, Insights and Forecast - by BY DESTINATION
- 10.2.1. Domestic
- 10.2.2. International
- 10.1. Market Analysis, Insights and Forecast - by BY FUNCTION
- 11. Asia Pacific US Dangerous Goods Logistics Market Analysis, Insights and Forecast, 2020-2032
- 11.1. Market Analysis, Insights and Forecast - by BY FUNCTION
- 11.1.1. Transportation
- 11.1.1.1. Road
- 11.1.1.2. Rail
- 11.1.1.3. Water
- 11.1.1.4. Pipeline
- 11.1.1.5. Air
- 11.1.2. Warehousing and Distribution
- 11.1.3. Value-ad
- 11.1.1. Transportation
- 11.2. Market Analysis, Insights and Forecast - by BY DESTINATION
- 11.2.1. Domestic
- 11.2.2. International
- 11.1. Market Analysis, Insights and Forecast - by BY FUNCTION
- 12. Competitive Analysis
- 12.1. Company Profiles
- 12.1.1 United Parcel Service Inc
- 12.1.1.1. Company Overview
- 12.1.1.2. Products
- 12.1.1.3. Company Financials
- 12.1.1.4. SWOT Analysis
- 12.1.2 APL Logistics
- 12.1.2.1. Company Overview
- 12.1.2.2. Products
- 12.1.2.3. Company Financials
- 12.1.2.4. SWOT Analysis
- 12.1.3 FedEx Corporation
- 12.1.3.1. Company Overview
- 12.1.3.2. Products
- 12.1.3.3. Company Financials
- 12.1.3.4. SWOT Analysis
- 12.1.4 GEODIS
- 12.1.4.1. Company Overview
- 12.1.4.2. Products
- 12.1.4.3. Company Financials
- 12.1.4.4. SWOT Analysis
- 12.1.5 XPO Logistics
- 12.1.5.1. Company Overview
- 12.1.5.2. Products
- 12.1.5.3. Company Financials
- 12.1.5.4. SWOT Analysis
- 12.1.6 Landstar System Inc **List Not Exhaustive
- 12.1.6.1. Company Overview
- 12.1.6.2. Products
- 12.1.6.3. Company Financials
- 12.1.6.4. SWOT Analysis
- 12.1.7 DB Schenker (The Americas)
- 12.1.7.1. Company Overview
- 12.1.7.2. Products
- 12.1.7.3. Company Financials
- 12.1.7.4. SWOT Analysis
- 12.1.8 Kuehne + Nagel
- 12.1.8.1. Company Overview
- 12.1.8.2. Products
- 12.1.8.3. Company Financials
- 12.1.8.4. SWOT Analysis
- 12.1.9 Schneider Logistics
- 12.1.9.1. Company Overview
- 12.1.9.2. Products
- 12.1.9.3. Company Financials
- 12.1.9.4. SWOT Analysis
- 12.1.10 Deutsche Post DHL Group
- 12.1.10.1. Company Overview
- 12.1.10.2. Products
- 12.1.10.3. Company Financials
- 12.1.10.4. SWOT Analysis
- 12.1.11 DSV
- 12.1.11.1. Company Overview
- 12.1.11.2. Products
- 12.1.11.3. Company Financials
- 12.1.11.4. SWOT Analysis
- 12.1.1 United Parcel Service Inc
- 12.2. Market Entropy
- 12.2.1 Company's Key Areas Served
- 12.2.2 Recent Developments
- 12.3. Company Market Share Analysis 2025
- 12.3.1 Top 5 Companies Market Share Analysis
- 12.3.2 Top 3 Companies Market Share Analysis
- 12.4. List of Potential Customers
- 13. Research Methodology
List of Figures
- Figure 1: Global US Dangerous Goods Logistics Market Revenue Breakdown (billion, %) by Region 2025 & 2033
- Figure 2: North America US Dangerous Goods Logistics Market Revenue (billion), by BY FUNCTION 2025 & 2033
- Figure 3: North America US Dangerous Goods Logistics Market Revenue Share (%), by BY FUNCTION 2025 & 2033
- Figure 4: North America US Dangerous Goods Logistics Market Revenue (billion), by BY DESTINATION 2025 & 2033
- Figure 5: North America US Dangerous Goods Logistics Market Revenue Share (%), by BY DESTINATION 2025 & 2033
- Figure 6: North America US Dangerous Goods Logistics Market Revenue (billion), by Country 2025 & 2033
- Figure 7: North America US Dangerous Goods Logistics Market Revenue Share (%), by Country 2025 & 2033
- Figure 8: South America US Dangerous Goods Logistics Market Revenue (billion), by BY FUNCTION 2025 & 2033
- Figure 9: South America US Dangerous Goods Logistics Market Revenue Share (%), by BY FUNCTION 2025 & 2033
- Figure 10: South America US Dangerous Goods Logistics Market Revenue (billion), by BY DESTINATION 2025 & 2033
- Figure 11: South America US Dangerous Goods Logistics Market Revenue Share (%), by BY DESTINATION 2025 & 2033
- Figure 12: South America US Dangerous Goods Logistics Market Revenue (billion), by Country 2025 & 2033
- Figure 13: South America US Dangerous Goods Logistics Market Revenue Share (%), by Country 2025 & 2033
- Figure 14: Europe US Dangerous Goods Logistics Market Revenue (billion), by BY FUNCTION 2025 & 2033
- Figure 15: Europe US Dangerous Goods Logistics Market Revenue Share (%), by BY FUNCTION 2025 & 2033
- Figure 16: Europe US Dangerous Goods Logistics Market Revenue (billion), by BY DESTINATION 2025 & 2033
- Figure 17: Europe US Dangerous Goods Logistics Market Revenue Share (%), by BY DESTINATION 2025 & 2033
- Figure 18: Europe US Dangerous Goods Logistics Market Revenue (billion), by Country 2025 & 2033
- Figure 19: Europe US Dangerous Goods Logistics Market Revenue Share (%), by Country 2025 & 2033
- Figure 20: Middle East & Africa US Dangerous Goods Logistics Market Revenue (billion), by BY FUNCTION 2025 & 2033
- Figure 21: Middle East & Africa US Dangerous Goods Logistics Market Revenue Share (%), by BY FUNCTION 2025 & 2033
- Figure 22: Middle East & Africa US Dangerous Goods Logistics Market Revenue (billion), by BY DESTINATION 2025 & 2033
- Figure 23: Middle East & Africa US Dangerous Goods Logistics Market Revenue Share (%), by BY DESTINATION 2025 & 2033
- Figure 24: Middle East & Africa US Dangerous Goods Logistics Market Revenue (billion), by Country 2025 & 2033
- Figure 25: Middle East & Africa US Dangerous Goods Logistics Market Revenue Share (%), by Country 2025 & 2033
- Figure 26: Asia Pacific US Dangerous Goods Logistics Market Revenue (billion), by BY FUNCTION 2025 & 2033
- Figure 27: Asia Pacific US Dangerous Goods Logistics Market Revenue Share (%), by BY FUNCTION 2025 & 2033
- Figure 28: Asia Pacific US Dangerous Goods Logistics Market Revenue (billion), by BY DESTINATION 2025 & 2033
- Figure 29: Asia Pacific US Dangerous Goods Logistics Market Revenue Share (%), by BY DESTINATION 2025 & 2033
- Figure 30: Asia Pacific US Dangerous Goods Logistics Market Revenue (billion), by Country 2025 & 2033
- Figure 31: Asia Pacific US Dangerous Goods Logistics Market Revenue Share (%), by Country 2025 & 2033
List of Tables
- Table 1: Global US Dangerous Goods Logistics Market Revenue billion Forecast, by BY FUNCTION 2020 & 2033
- Table 2: Global US Dangerous Goods Logistics Market Revenue billion Forecast, by BY DESTINATION 2020 & 2033
- Table 3: Global US Dangerous Goods Logistics Market Revenue billion Forecast, by Region 2020 & 2033
- Table 4: Global US Dangerous Goods Logistics Market Revenue billion Forecast, by BY FUNCTION 2020 & 2033
- Table 5: Global US Dangerous Goods Logistics Market Revenue billion Forecast, by BY DESTINATION 2020 & 2033
- Table 6: Global US Dangerous Goods Logistics Market Revenue billion Forecast, by Country 2020 & 2033
- Table 7: United States US Dangerous Goods Logistics Market Revenue (billion) Forecast, by Application 2020 & 2033
- Table 8: Canada US Dangerous Goods Logistics Market Revenue (billion) Forecast, by Application 2020 & 2033
- Table 9: Mexico US Dangerous Goods Logistics Market Revenue (billion) Forecast, by Application 2020 & 2033
- Table 10: Global US Dangerous Goods Logistics Market Revenue billion Forecast, by BY FUNCTION 2020 & 2033
- Table 11: Global US Dangerous Goods Logistics Market Revenue billion Forecast, by BY DESTINATION 2020 & 2033
- Table 12: Global US Dangerous Goods Logistics Market Revenue billion Forecast, by Country 2020 & 2033
- Table 13: Brazil US Dangerous Goods Logistics Market Revenue (billion) Forecast, by Application 2020 & 2033
- Table 14: Argentina US Dangerous Goods Logistics Market Revenue (billion) Forecast, by Application 2020 & 2033
- Table 15: Rest of South America US Dangerous Goods Logistics Market Revenue (billion) Forecast, by Application 2020 & 2033
- Table 16: Global US Dangerous Goods Logistics Market Revenue billion Forecast, by BY FUNCTION 2020 & 2033
- Table 17: Global US Dangerous Goods Logistics Market Revenue billion Forecast, by BY DESTINATION 2020 & 2033
- Table 18: Global US Dangerous Goods Logistics Market Revenue billion Forecast, by Country 2020 & 2033
- Table 19: United Kingdom US Dangerous Goods Logistics Market Revenue (billion) Forecast, by Application 2020 & 2033
- Table 20: Germany US Dangerous Goods Logistics Market Revenue (billion) Forecast, by Application 2020 & 2033
- Table 21: France US Dangerous Goods Logistics Market Revenue (billion) Forecast, by Application 2020 & 2033
- Table 22: Italy US Dangerous Goods Logistics Market Revenue (billion) Forecast, by Application 2020 & 2033
- Table 23: Spain US Dangerous Goods Logistics Market Revenue (billion) Forecast, by Application 2020 & 2033
- Table 24: Russia US Dangerous Goods Logistics Market Revenue (billion) Forecast, by Application 2020 & 2033
- Table 25: Benelux US Dangerous Goods Logistics Market Revenue (billion) Forecast, by Application 2020 & 2033
- Table 26: Nordics US Dangerous Goods Logistics Market Revenue (billion) Forecast, by Application 2020 & 2033
- Table 27: Rest of Europe US Dangerous Goods Logistics Market Revenue (billion) Forecast, by Application 2020 & 2033
- Table 28: Global US Dangerous Goods Logistics Market Revenue billion Forecast, by BY FUNCTION 2020 & 2033
- Table 29: Global US Dangerous Goods Logistics Market Revenue billion Forecast, by BY DESTINATION 2020 & 2033
- Table 30: Global US Dangerous Goods Logistics Market Revenue billion Forecast, by Country 2020 & 2033
- Table 31: Turkey US Dangerous Goods Logistics Market Revenue (billion) Forecast, by Application 2020 & 2033
- Table 32: Israel US Dangerous Goods Logistics Market Revenue (billion) Forecast, by Application 2020 & 2033
- Table 33: GCC US Dangerous Goods Logistics Market Revenue (billion) Forecast, by Application 2020 & 2033
- Table 34: North Africa US Dangerous Goods Logistics Market Revenue (billion) Forecast, by Application 2020 & 2033
- Table 35: South Africa US Dangerous Goods Logistics Market Revenue (billion) Forecast, by Application 2020 & 2033
- Table 36: Rest of Middle East & Africa US Dangerous Goods Logistics Market Revenue (billion) Forecast, by Application 2020 & 2033
- Table 37: Global US Dangerous Goods Logistics Market Revenue billion Forecast, by BY FUNCTION 2020 & 2033
- Table 38: Global US Dangerous Goods Logistics Market Revenue billion Forecast, by BY DESTINATION 2020 & 2033
- Table 39: Global US Dangerous Goods Logistics Market Revenue billion Forecast, by Country 2020 & 2033
- Table 40: China US Dangerous Goods Logistics Market Revenue (billion) Forecast, by Application 2020 & 2033
- Table 41: India US Dangerous Goods Logistics Market Revenue (billion) Forecast, by Application 2020 & 2033
- Table 42: Japan US Dangerous Goods Logistics Market Revenue (billion) Forecast, by Application 2020 & 2033
- Table 43: South Korea US Dangerous Goods Logistics Market Revenue (billion) Forecast, by Application 2020 & 2033
- Table 44: ASEAN US Dangerous Goods Logistics Market Revenue (billion) Forecast, by Application 2020 & 2033
- Table 45: Oceania US Dangerous Goods Logistics Market Revenue (billion) Forecast, by Application 2020 & 2033
- Table 46: Rest of Asia Pacific US Dangerous Goods Logistics Market Revenue (billion) Forecast, by Application 2020 & 2033
Frequently Asked Questions
1. What is the projected Compound Annual Growth Rate (CAGR) of the US Dangerous Goods Logistics Market?
The projected CAGR is approximately 7.6%.
2. Which companies are prominent players in the US Dangerous Goods Logistics Market?
Key companies in the market include United Parcel Service Inc, APL Logistics, FedEx Corporation, GEODIS, XPO Logistics, Landstar System Inc **List Not Exhaustive, DB Schenker (The Americas), Kuehne + Nagel, Schneider Logistics, Deutsche Post DHL Group, DSV.
3. What are the main segments of the US Dangerous Goods Logistics Market?
The market segments include BY FUNCTION, BY DESTINATION.
4. Can you provide details about the market size?
The market size is estimated to be USD 251.13 billion as of 2022.
5. What are some drivers contributing to market growth?
5.1 Drivers 5.2 Restraints 5.3 Opportunities 5.4 Porter's Five Forces Analysis 5.5 Industry Value Chain Analysis.
6. What are the notable trends driving market growth?
The US Oil Industry Growth.
7. Are there any restraints impacting market growth?
5.1 Drivers 5.2 Restraints 5.3 Opportunities 5.4 Porter's Five Forces Analysis 5.5 Industry Value Chain Analysis.
8. Can you provide examples of recent developments in the market?
N/A
9. What pricing options are available for accessing the report?
Pricing options include single-user, multi-user, and enterprise licenses priced at USD 3800, USD 4500, and USD 5800 respectively.
10. Is the market size provided in terms of value or volume?
The market size is provided in terms of value, measured in billion.
11. Are there any specific market keywords associated with the report?
Yes, the market keyword associated with the report is "US Dangerous Goods Logistics Market," which aids in identifying and referencing the specific market segment covered.
12. How do I determine which pricing option suits my needs best?
The pricing options vary based on user requirements and access needs. Individual users may opt for single-user licenses, while businesses requiring broader access may choose multi-user or enterprise licenses for cost-effective access to the report.
13. Are there any additional resources or data provided in the US Dangerous Goods Logistics Market report?
While the report offers comprehensive insights, it's advisable to review the specific contents or supplementary materials provided to ascertain if additional resources or data are available.
14. How can I stay updated on further developments or reports in the US Dangerous Goods Logistics Market?
To stay informed about further developments, trends, and reports in the US Dangerous Goods Logistics Market, consider subscribing to industry newsletters, following relevant companies and organizations, or regularly checking reputable industry news sources and publications.
Methodology
Step 1 - Identification of Relevant Samples Size from Population Database


Step 2 - Approaches for Defining Global Market Size (Value, Volume* & Price*)

Note*: In applicable scenarios
Step 3 - Data Sources
Primary Research
- Web Analytics
- Survey Reports
- Research Institute
- Latest Research Reports
- Opinion Leaders
Secondary Research
- Annual Reports
- White Paper
- Latest Press Release
- Industry Association
- Paid Database
- Investor Presentations

Step 4 - Data Triangulation
Involves using different sources of information in order to increase the validity of a study
These sources are likely to be stakeholders in a program - participants, other researchers, program staff, other community members, and so on.
Then we put all data in single framework & apply various statistical tools to find out the dynamic on the market.
During the analysis stage, feedback from the stakeholder groups would be compared to determine areas of agreement as well as areas of divergence

