

Key Insights
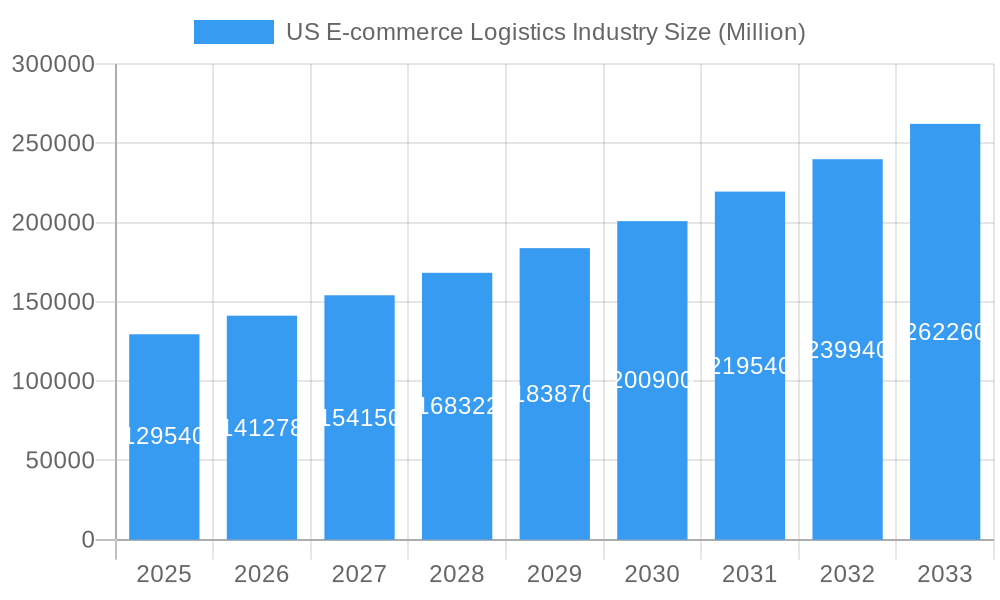
The US e-commerce logistics industry is experiencing robust growth, projected to reach a market size of $129.54 billion in 2025, expanding at a Compound Annual Growth Rate (CAGR) of 8.90% from 2025 to 2033. This expansion is fueled by several key drivers: the continued surge in online shopping, increasing consumer demand for faster and more convenient delivery options (including same-day and next-day delivery), the rise of omnichannel retail strategies requiring seamless integration of online and offline fulfillment, and the growing adoption of advanced technologies like artificial intelligence (AI) and automation in warehouse operations and last-mile delivery. Significant growth is observed across all segments: B2C continues to dominate, but B2B e-commerce is also exhibiting strong growth, demanding efficient and specialized logistical solutions. The transportation segment, encompassing trucking, air freight, and parcel delivery, constitutes a major share of the market, while warehousing and inventory management solutions are crucial for optimizing efficiency and reducing costs. Value-added services like labeling, packaging, and returns management are gaining traction as businesses focus on enhancing customer experience. The geographical distribution shows significant activity across all US regions, with concentration likely higher in densely populated areas like the Northeast and West Coast. Competitive pressures remain intense, with established players like UPS, FedEx, and DHL competing with emerging players and specialized logistics providers.
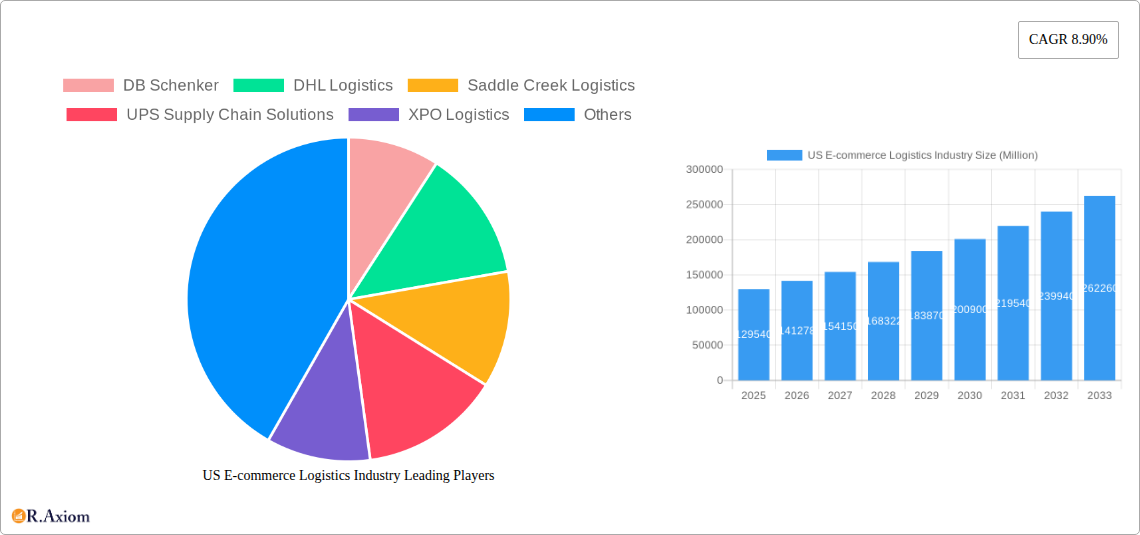
US E-commerce Logistics Industry Market Size (In Billion)
The industry faces challenges, including rising fuel costs, labor shortages, and the complexities of managing last-mile delivery in urban environments. However, technological advancements and innovative solutions are mitigating some of these issues. The increasing demand for sustainability and environmentally friendly logistics practices will also shape the industry's future. The diverse product segments, from fashion and apparel to consumer electronics and home appliances, each have unique logistical requirements, contributing to the overall market complexity and growth opportunities. The forecast period of 2025-2033 presents significant potential for continued growth, driven by evolving consumer preferences, technological innovation, and the ongoing expansion of e-commerce.
US E-commerce Logistics Industry Company Market Share
US E-commerce Logistics Industry: A Comprehensive Market Report (2019-2033)
This in-depth report provides a comprehensive analysis of the US e-commerce logistics industry, covering market size, segmentation, key players, growth drivers, challenges, and future outlook. The study period spans from 2019 to 2033, with 2025 as the base and estimated year. The report offers actionable insights for industry stakeholders, investors, and businesses operating within this dynamic sector. This report is meticulously researched and requires no further modification.
US E-commerce Logistics Industry Market Concentration & Innovation
The US e-commerce logistics industry is characterized by a moderately concentrated market with a few dominant players and numerous smaller specialized firms. Major players like FedEx, UPS Supply Chain Solutions, DHL Logistics, and XPO Logistics hold significant market share, estimated at approximately xx% collectively in 2025. However, the market exhibits considerable dynamism due to continuous innovation and M&A activity. Recent mergers and acquisitions, totaling an estimated $xx Million in deal value in 2024, illustrate the strategic consolidation within the sector.
Innovation is driven by the need for enhanced efficiency, automation, and sustainability. Technological advancements, such as AI-powered route optimization, autonomous vehicles, and advanced warehouse management systems (WMS), are transforming logistics operations. Regulatory frameworks, including those related to environmental sustainability and data privacy, significantly influence industry practices. Product substitutes, such as drone delivery and alternative transportation modes, are emerging but currently hold a limited market share, estimated at less than xx% in 2025. End-user trends, including a preference for faster delivery and increased transparency, drive demand for advanced logistics solutions.
US E-commerce Logistics Industry Industry Trends & Insights
The US e-commerce logistics market is experiencing robust growth, fueled by the sustained expansion of online retail and changing consumer preferences. The market is projected to register a Compound Annual Growth Rate (CAGR) of xx% during the forecast period (2025-2033), reaching an estimated market size of $xx Million by 2033. This growth is driven by several key factors: the increasing adoption of e-commerce by businesses of all sizes (B2B and B2C), the rise of omnichannel retailing, and the growing demand for faster and more reliable delivery options. Technological disruptions, including the rise of automation and the Internet of Things (IoT), are significantly impacting operational efficiency and cost optimization. Consumer preference for same-day and next-day delivery puts considerable pressure on logistics providers to invest in advanced technologies and infrastructure. Competitive dynamics are intense, with established players and new entrants vying for market share through strategic partnerships, investments in technology, and service differentiation. Market penetration of advanced logistics solutions like AI-powered route optimization is expected to reach xx% by 2033.
Dominant Markets & Segments in US E-commerce Logistics Industry
- By Service: Transportation (particularly last-mile delivery) holds the largest market share, followed by warehousing and inventory management. Value-added services are growing rapidly.
- By Business: B2C dominates the market due to the sheer volume of individual online purchases, although B2B e-commerce logistics is also expanding significantly.
- By Destination: Domestic shipping constitutes the largest segment, given the vast size of the US market. However, international/cross-border e-commerce logistics is experiencing significant growth, driven by globalization and increased online cross-border shopping.
- By Product: Fashion and apparel, consumer electronics, and home appliances are major segments, though growth is observed across all product categories. The diversity of products handled reflects the broad nature of e-commerce.
The dominance of specific segments is influenced by factors such as population density, infrastructure development, economic policies favoring e-commerce, and the availability of skilled labor. The southeastern and western regions of the US experience higher growth due to favorable demographics and increased e-commerce penetration.
US E-commerce Logistics Industry Product Developments
Recent product innovations center around enhanced automation, data analytics, and sustainability. Automated guided vehicles (AGVs), robotic process automation (RPA), and advanced warehouse management systems (WMS) are improving efficiency and reducing operational costs. Data analytics tools provide real-time visibility into supply chains, enabling better decision-making and risk management. The industry is increasingly focused on sustainable practices, including the use of alternative fuels and eco-friendly packaging. These innovations improve speed, efficiency, and meet evolving customer expectations for sustainable practices, leading to a competitive advantage in the market.
Report Scope & Segmentation Analysis
This comprehensive report meticulously segments the US e-commerce logistics market across critical dimensions: by service (including transportation, warehousing, and advanced value-added services), business type (differentiating between B2B and B2C operations), destination (encompassing both domestic and international shipping), and product type (covering fashion, electronics, appliances, furniture, beauty, and a broad 'other' category). Each identified segment is rigorously analyzed for its current market size, future growth trajectories, and the prevailing competitive dynamics. Notably, growth projections indicate particularly robust expansion potential within the value-added services sector and international shipping. The competitive landscape is shaped by key differentiators such as cutting-edge technological capabilities, the breadth and depth of service offerings, and agile pricing strategies.
Key Drivers of US E-commerce Logistics Industry Growth
Several factors drive the growth of the US e-commerce logistics industry. Technological advancements, such as automation and AI, enhance efficiency and reduce costs. Economic factors, including rising disposable incomes and increased online shopping, fuel demand. Government regulations supporting e-commerce and infrastructure development further stimulate industry growth. For example, the recent infrastructure investments in the US are expected to improve last-mile delivery efficiency.
Challenges in the US E-commerce Logistics Industry Sector
The industry faces challenges, including rising fuel costs, labor shortages, and increasing competition. Supply chain disruptions can significantly impact operations, causing delays and increased costs. Stringent regulatory compliance requirements add complexity and expense. These factors can lead to decreased profitability and limit market expansion. The impact of these challenges is estimated to be a xx% reduction in profit margins for some logistics companies.
Emerging Opportunities in US E-commerce Logistics Industry
The US e-commerce logistics landscape is ripe with opportunities for significant growth and pioneering innovation. The ongoing expansion of e-commerce into new and emerging markets, coupled with the diversification of product categories being sold online, presents a vast untapped potential. Furthermore, the strategic adoption of transformative technologies, such as advanced drone delivery systems and autonomous vehicle fleets, promises to revolutionize last-mile delivery, enhancing speed and efficiency. Critically, meeting the escalating consumer demand for environmentally responsible and ethically sourced logistics practices presents a substantial and growing opportunity for differentiation and market leadership.
Leading Players in the US E-commerce Logistics Industry Market
- DB Schenker
- DHL Logistics
- Saddle Creek Logistics
- UPS Supply Chain Solutions
- XPO Logistics
- Rakuten Super Logistics
- FedEx
- Geodis Logistics
- Kenco Logistics Services
- Kuehne and Nagel Logistics (List Not Exhaustive)
Key Developments in US E-commerce Logistics Industry Industry
- August 2023: DHL eCommerce marked a significant expansion with the inauguration of a new 352,000 sq ft distribution center in Melrose Park, Illinois. This state-of-the-art facility boasts an advanced automated sorter system capable of processing an impressive 40,000 parcels per hour, underscoring a substantial investment in enhancing capacity and integrating cutting-edge automation. This development is part of a broader strategic initiative, with eleven warehouses already constructed or relocated, and seven more slated for development.
- April 2023: In a move to champion environmental responsibility, DHL Express launched GoGreen Plus. This innovative service empowers Small and Medium-sized Enterprises (SMEs) to proactively offset the carbon footprint associated with their shipments, directly addressing the escalating industry-wide concerns around sustainability and corporate environmental impact.
Strategic Outlook for US E-commerce Logistics Industry Market
The US e-commerce logistics industry is strategically positioned for sustained and accelerated growth, propelled by the relentless pace of technological innovation, the ever-expanding penetration of e-commerce across diverse consumer segments, and the dynamic evolution of consumer expectations. Promising opportunities are abundant in the realms of advanced automation, comprehensive sustainability initiatives, and the development of agile and responsive last-mile delivery solutions. Companies that proactively embrace and effectively leverage transformative technologies, relentlessly optimize their operational efficiencies, and demonstrate agility in adapting to evolving regulatory frameworks will undoubtedly secure a competitive advantage and achieve success in this dynamic market. The prevailing strategic focus will be centered on the continuous enhancement of operational efficiency, the demonstrable improvement of environmental sustainability, and the consistent delivery of personalized, reliable, and exceptional delivery experiences to meet and exceed customer demands.
US E-commerce Logistics Industry Segmentation
-
1. Service
- 1.1. Transportation
- 1.2. Warehousing and Inventory management
- 1.3. Value-added services (Labeling, Packaging, etc)
-
2. Business
- 2.1. B2B
- 2.2. B2C
-
3. Destination
- 3.1. Domestic
- 3.2. International/cross-border
-
4. Product
- 4.1. Fashion and Apparel
- 4.2. Consumer Electronics
- 4.3. Home Appliances
- 4.4. Furniture
- 4.5. Beauty and Personal Care Products
- 4.6. Other Products (Toys, Food Products, etc.)
US E-commerce Logistics Industry Segmentation By Geography
-
1. North America
- 1.1. United States
- 1.2. Canada
- 1.3. Mexico
-
2. South America
- 2.1. Brazil
- 2.2. Argentina
- 2.3. Rest of South America
-
3. Europe
- 3.1. United Kingdom
- 3.2. Germany
- 3.3. France
- 3.4. Italy
- 3.5. Spain
- 3.6. Russia
- 3.7. Benelux
- 3.8. Nordics
- 3.9. Rest of Europe
-
4. Middle East & Africa
- 4.1. Turkey
- 4.2. Israel
- 4.3. GCC
- 4.4. North Africa
- 4.5. South Africa
- 4.6. Rest of Middle East & Africa
-
5. Asia Pacific
- 5.1. China
- 5.2. India
- 5.3. Japan
- 5.4. South Korea
- 5.5. ASEAN
- 5.6. Oceania
- 5.7. Rest of Asia Pacific
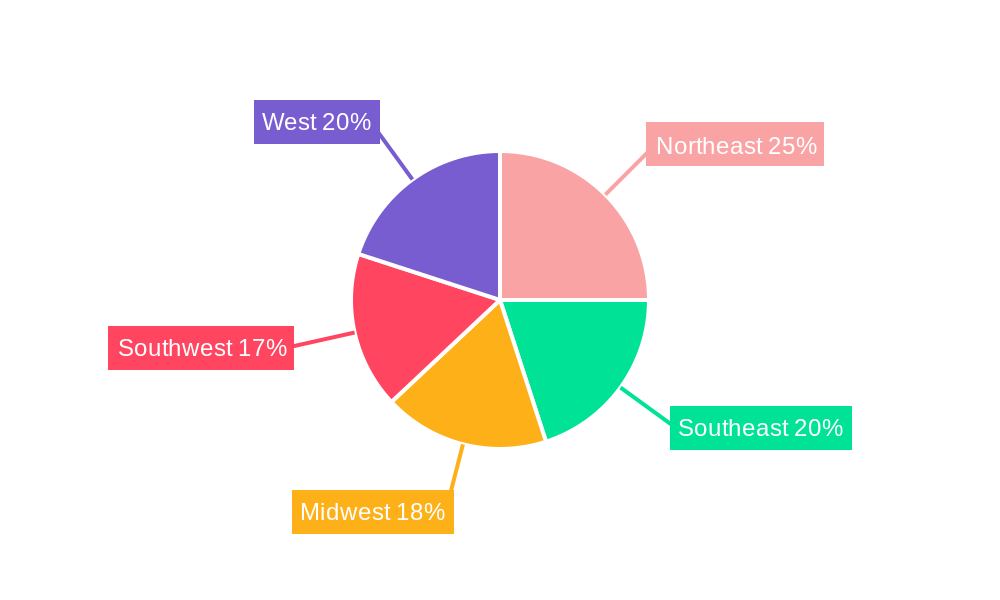
US E-commerce Logistics Industry Regional Market Share
Geographic Coverage of US E-commerce Logistics Industry
US E-commerce Logistics Industry REPORT HIGHLIGHTS
| Aspects | Details |
|---|---|
| Study Period | 2020-2034 |
| Base Year | 2025 |
| Estimated Year | 2026 |
| Forecast Period | 2026-2034 |
| Historical Period | 2020-2025 |
| Growth Rate | CAGR of 8.90% from 2020-2034 |
| Segmentation |
|
Table of Contents
- 1. Introduction
- 1.1. Research Scope
- 1.2. Market Segmentation
- 1.3. Research Objective
- 1.4. Definitions and Assumptions
- 2. Executive Summary
- 2.1. Market Snapshot
- 3. Market Dynamics
- 3.1. Market Drivers
- 3.2. Market Restrains
- 3.3. Market Trends
- 3.4. Market Opportunities
- 4. Market Factor Analysis
- 4.1. Porters Five Forces
- 4.1.1. Bargaining Power of Suppliers
- 4.1.2. Bargaining Power of Buyers
- 4.1.3. Threat of New Entrants
- 4.1.4. Threat of Substitutes
- 4.1.5. Competitive Rivalry
- 4.2. PESTEL analysis
- 4.3. BCG Analysis
- 4.3.1. Stars (High Growth, High Market Share)
- 4.3.2. Cash Cows (Low Growth, High Market Share)
- 4.3.3. Question Mark (High Growth, Low Market Share)
- 4.3.4. Dogs (Low Growth, Low Market Share)
- 4.4. Ansoff Matrix Analysis
- 4.5. Supply Chain Analysis
- 4.6. Regulatory Landscape
- 4.7. Current Market Potential and Opportunity Assessment (TAM–SAM–SOM Framework)
- 4.8. RAX Analyst Note
- 4.1. Porters Five Forces
- 5. Market Analysis, Insights and Forecast 2021-2033
- 5.1. Market Analysis, Insights and Forecast - by Service
- 5.1.1. Transportation
- 5.1.2. Warehousing and Inventory management
- 5.1.3. Value-added services (Labeling, Packaging, etc)
- 5.2. Market Analysis, Insights and Forecast - by Business
- 5.2.1. B2B
- 5.2.2. B2C
- 5.3. Market Analysis, Insights and Forecast - by Destination
- 5.3.1. Domestic
- 5.3.2. International/cross-border
- 5.4. Market Analysis, Insights and Forecast - by Product
- 5.4.1. Fashion and Apparel
- 5.4.2. Consumer Electronics
- 5.4.3. Home Appliances
- 5.4.4. Furniture
- 5.4.5. Beauty and Personal Care Products
- 5.4.6. Other Products (Toys, Food Products, etc.)
- 5.5. Market Analysis, Insights and Forecast - by Region
- 5.5.1. North America
- 5.5.2. South America
- 5.5.3. Europe
- 5.5.4. Middle East & Africa
- 5.5.5. Asia Pacific
- 5.1. Market Analysis, Insights and Forecast - by Service
- 6. Global US E-commerce Logistics Industry Analysis, Insights and Forecast, 2021-2033
- 6.1. Market Analysis, Insights and Forecast - by Service
- 6.1.1. Transportation
- 6.1.2. Warehousing and Inventory management
- 6.1.3. Value-added services (Labeling, Packaging, etc)
- 6.2. Market Analysis, Insights and Forecast - by Business
- 6.2.1. B2B
- 6.2.2. B2C
- 6.3. Market Analysis, Insights and Forecast - by Destination
- 6.3.1. Domestic
- 6.3.2. International/cross-border
- 6.4. Market Analysis, Insights and Forecast - by Product
- 6.4.1. Fashion and Apparel
- 6.4.2. Consumer Electronics
- 6.4.3. Home Appliances
- 6.4.4. Furniture
- 6.4.5. Beauty and Personal Care Products
- 6.4.6. Other Products (Toys, Food Products, etc.)
- 6.1. Market Analysis, Insights and Forecast - by Service
- 7. North America US E-commerce Logistics Industry Analysis, Insights and Forecast, 2020-2032
- 7.1. Market Analysis, Insights and Forecast - by Service
- 7.1.1. Transportation
- 7.1.2. Warehousing and Inventory management
- 7.1.3. Value-added services (Labeling, Packaging, etc)
- 7.2. Market Analysis, Insights and Forecast - by Business
- 7.2.1. B2B
- 7.2.2. B2C
- 7.3. Market Analysis, Insights and Forecast - by Destination
- 7.3.1. Domestic
- 7.3.2. International/cross-border
- 7.4. Market Analysis, Insights and Forecast - by Product
- 7.4.1. Fashion and Apparel
- 7.4.2. Consumer Electronics
- 7.4.3. Home Appliances
- 7.4.4. Furniture
- 7.4.5. Beauty and Personal Care Products
- 7.4.6. Other Products (Toys, Food Products, etc.)
- 7.1. Market Analysis, Insights and Forecast - by Service
- 8. South America US E-commerce Logistics Industry Analysis, Insights and Forecast, 2020-2032
- 8.1. Market Analysis, Insights and Forecast - by Service
- 8.1.1. Transportation
- 8.1.2. Warehousing and Inventory management
- 8.1.3. Value-added services (Labeling, Packaging, etc)
- 8.2. Market Analysis, Insights and Forecast - by Business
- 8.2.1. B2B
- 8.2.2. B2C
- 8.3. Market Analysis, Insights and Forecast - by Destination
- 8.3.1. Domestic
- 8.3.2. International/cross-border
- 8.4. Market Analysis, Insights and Forecast - by Product
- 8.4.1. Fashion and Apparel
- 8.4.2. Consumer Electronics
- 8.4.3. Home Appliances
- 8.4.4. Furniture
- 8.4.5. Beauty and Personal Care Products
- 8.4.6. Other Products (Toys, Food Products, etc.)
- 8.1. Market Analysis, Insights and Forecast - by Service
- 9. Europe US E-commerce Logistics Industry Analysis, Insights and Forecast, 2020-2032
- 9.1. Market Analysis, Insights and Forecast - by Service
- 9.1.1. Transportation
- 9.1.2. Warehousing and Inventory management
- 9.1.3. Value-added services (Labeling, Packaging, etc)
- 9.2. Market Analysis, Insights and Forecast - by Business
- 9.2.1. B2B
- 9.2.2. B2C
- 9.3. Market Analysis, Insights and Forecast - by Destination
- 9.3.1. Domestic
- 9.3.2. International/cross-border
- 9.4. Market Analysis, Insights and Forecast - by Product
- 9.4.1. Fashion and Apparel
- 9.4.2. Consumer Electronics
- 9.4.3. Home Appliances
- 9.4.4. Furniture
- 9.4.5. Beauty and Personal Care Products
- 9.4.6. Other Products (Toys, Food Products, etc.)
- 9.1. Market Analysis, Insights and Forecast - by Service
- 10. Middle East & Africa US E-commerce Logistics Industry Analysis, Insights and Forecast, 2020-2032
- 10.1. Market Analysis, Insights and Forecast - by Service
- 10.1.1. Transportation
- 10.1.2. Warehousing and Inventory management
- 10.1.3. Value-added services (Labeling, Packaging, etc)
- 10.2. Market Analysis, Insights and Forecast - by Business
- 10.2.1. B2B
- 10.2.2. B2C
- 10.3. Market Analysis, Insights and Forecast - by Destination
- 10.3.1. Domestic
- 10.3.2. International/cross-border
- 10.4. Market Analysis, Insights and Forecast - by Product
- 10.4.1. Fashion and Apparel
- 10.4.2. Consumer Electronics
- 10.4.3. Home Appliances
- 10.4.4. Furniture
- 10.4.5. Beauty and Personal Care Products
- 10.4.6. Other Products (Toys, Food Products, etc.)
- 10.1. Market Analysis, Insights and Forecast - by Service
- 11. Asia Pacific US E-commerce Logistics Industry Analysis, Insights and Forecast, 2020-2032
- 11.1. Market Analysis, Insights and Forecast - by Service
- 11.1.1. Transportation
- 11.1.2. Warehousing and Inventory management
- 11.1.3. Value-added services (Labeling, Packaging, etc)
- 11.2. Market Analysis, Insights and Forecast - by Business
- 11.2.1. B2B
- 11.2.2. B2C
- 11.3. Market Analysis, Insights and Forecast - by Destination
- 11.3.1. Domestic
- 11.3.2. International/cross-border
- 11.4. Market Analysis, Insights and Forecast - by Product
- 11.4.1. Fashion and Apparel
- 11.4.2. Consumer Electronics
- 11.4.3. Home Appliances
- 11.4.4. Furniture
- 11.4.5. Beauty and Personal Care Products
- 11.4.6. Other Products (Toys, Food Products, etc.)
- 11.1. Market Analysis, Insights and Forecast - by Service
- 12. Competitive Analysis
- 12.1. Company Profiles
- 12.1.1 DB Schenker
- 12.1.1.1. Company Overview
- 12.1.1.2. Products
- 12.1.1.3. Company Financials
- 12.1.1.4. SWOT Analysis
- 12.1.2 DHL Logistics
- 12.1.2.1. Company Overview
- 12.1.2.2. Products
- 12.1.2.3. Company Financials
- 12.1.2.4. SWOT Analysis
- 12.1.3 Saddle Creek Logistics
- 12.1.3.1. Company Overview
- 12.1.3.2. Products
- 12.1.3.3. Company Financials
- 12.1.3.4. SWOT Analysis
- 12.1.4 UPS Supply Chain Solutions
- 12.1.4.1. Company Overview
- 12.1.4.2. Products
- 12.1.4.3. Company Financials
- 12.1.4.4. SWOT Analysis
- 12.1.5 XPO Logistics
- 12.1.5.1. Company Overview
- 12.1.5.2. Products
- 12.1.5.3. Company Financials
- 12.1.5.4. SWOT Analysis
- 12.1.6 Rakuten Super Logistics
- 12.1.6.1. Company Overview
- 12.1.6.2. Products
- 12.1.6.3. Company Financials
- 12.1.6.4. SWOT Analysis
- 12.1.7 FedEx
- 12.1.7.1. Company Overview
- 12.1.7.2. Products
- 12.1.7.3. Company Financials
- 12.1.7.4. SWOT Analysis
- 12.1.8 Geodis Logistics
- 12.1.8.1. Company Overview
- 12.1.8.2. Products
- 12.1.8.3. Company Financials
- 12.1.8.4. SWOT Analysis
- 12.1.9 Kenco Logistics Services
- 12.1.9.1. Company Overview
- 12.1.9.2. Products
- 12.1.9.3. Company Financials
- 12.1.9.4. SWOT Analysis
- 12.1.10 Kuehne and Nagel Logistics**List Not Exhaustive
- 12.1.10.1. Company Overview
- 12.1.10.2. Products
- 12.1.10.3. Company Financials
- 12.1.10.4. SWOT Analysis
- 12.1.1 DB Schenker
- 12.2. Market Entropy
- 12.2.1 Company's Key Areas Served
- 12.2.2 Recent Developments
- 12.3. Company Market Share Analysis 2025
- 12.3.1 Top 5 Companies Market Share Analysis
- 12.3.2 Top 3 Companies Market Share Analysis
- 12.4. List of Potential Customers
- 13. Research Methodology
List of Figures
- Figure 1: Global US E-commerce Logistics Industry Revenue Breakdown (Million, %) by Region 2025 & 2033
- Figure 2: North America US E-commerce Logistics Industry Revenue (Million), by Service 2025 & 2033
- Figure 3: North America US E-commerce Logistics Industry Revenue Share (%), by Service 2025 & 2033
- Figure 4: North America US E-commerce Logistics Industry Revenue (Million), by Business 2025 & 2033
- Figure 5: North America US E-commerce Logistics Industry Revenue Share (%), by Business 2025 & 2033
- Figure 6: North America US E-commerce Logistics Industry Revenue (Million), by Destination 2025 & 2033
- Figure 7: North America US E-commerce Logistics Industry Revenue Share (%), by Destination 2025 & 2033
- Figure 8: North America US E-commerce Logistics Industry Revenue (Million), by Product 2025 & 2033
- Figure 9: North America US E-commerce Logistics Industry Revenue Share (%), by Product 2025 & 2033
- Figure 10: North America US E-commerce Logistics Industry Revenue (Million), by Country 2025 & 2033
- Figure 11: North America US E-commerce Logistics Industry Revenue Share (%), by Country 2025 & 2033
- Figure 12: South America US E-commerce Logistics Industry Revenue (Million), by Service 2025 & 2033
- Figure 13: South America US E-commerce Logistics Industry Revenue Share (%), by Service 2025 & 2033
- Figure 14: South America US E-commerce Logistics Industry Revenue (Million), by Business 2025 & 2033
- Figure 15: South America US E-commerce Logistics Industry Revenue Share (%), by Business 2025 & 2033
- Figure 16: South America US E-commerce Logistics Industry Revenue (Million), by Destination 2025 & 2033
- Figure 17: South America US E-commerce Logistics Industry Revenue Share (%), by Destination 2025 & 2033
- Figure 18: South America US E-commerce Logistics Industry Revenue (Million), by Product 2025 & 2033
- Figure 19: South America US E-commerce Logistics Industry Revenue Share (%), by Product 2025 & 2033
- Figure 20: South America US E-commerce Logistics Industry Revenue (Million), by Country 2025 & 2033
- Figure 21: South America US E-commerce Logistics Industry Revenue Share (%), by Country 2025 & 2033
- Figure 22: Europe US E-commerce Logistics Industry Revenue (Million), by Service 2025 & 2033
- Figure 23: Europe US E-commerce Logistics Industry Revenue Share (%), by Service 2025 & 2033
- Figure 24: Europe US E-commerce Logistics Industry Revenue (Million), by Business 2025 & 2033
- Figure 25: Europe US E-commerce Logistics Industry Revenue Share (%), by Business 2025 & 2033
- Figure 26: Europe US E-commerce Logistics Industry Revenue (Million), by Destination 2025 & 2033
- Figure 27: Europe US E-commerce Logistics Industry Revenue Share (%), by Destination 2025 & 2033
- Figure 28: Europe US E-commerce Logistics Industry Revenue (Million), by Product 2025 & 2033
- Figure 29: Europe US E-commerce Logistics Industry Revenue Share (%), by Product 2025 & 2033
- Figure 30: Europe US E-commerce Logistics Industry Revenue (Million), by Country 2025 & 2033
- Figure 31: Europe US E-commerce Logistics Industry Revenue Share (%), by Country 2025 & 2033
- Figure 32: Middle East & Africa US E-commerce Logistics Industry Revenue (Million), by Service 2025 & 2033
- Figure 33: Middle East & Africa US E-commerce Logistics Industry Revenue Share (%), by Service 2025 & 2033
- Figure 34: Middle East & Africa US E-commerce Logistics Industry Revenue (Million), by Business 2025 & 2033
- Figure 35: Middle East & Africa US E-commerce Logistics Industry Revenue Share (%), by Business 2025 & 2033
- Figure 36: Middle East & Africa US E-commerce Logistics Industry Revenue (Million), by Destination 2025 & 2033
- Figure 37: Middle East & Africa US E-commerce Logistics Industry Revenue Share (%), by Destination 2025 & 2033
- Figure 38: Middle East & Africa US E-commerce Logistics Industry Revenue (Million), by Product 2025 & 2033
- Figure 39: Middle East & Africa US E-commerce Logistics Industry Revenue Share (%), by Product 2025 & 2033
- Figure 40: Middle East & Africa US E-commerce Logistics Industry Revenue (Million), by Country 2025 & 2033
- Figure 41: Middle East & Africa US E-commerce Logistics Industry Revenue Share (%), by Country 2025 & 2033
- Figure 42: Asia Pacific US E-commerce Logistics Industry Revenue (Million), by Service 2025 & 2033
- Figure 43: Asia Pacific US E-commerce Logistics Industry Revenue Share (%), by Service 2025 & 2033
- Figure 44: Asia Pacific US E-commerce Logistics Industry Revenue (Million), by Business 2025 & 2033
- Figure 45: Asia Pacific US E-commerce Logistics Industry Revenue Share (%), by Business 2025 & 2033
- Figure 46: Asia Pacific US E-commerce Logistics Industry Revenue (Million), by Destination 2025 & 2033
- Figure 47: Asia Pacific US E-commerce Logistics Industry Revenue Share (%), by Destination 2025 & 2033
- Figure 48: Asia Pacific US E-commerce Logistics Industry Revenue (Million), by Product 2025 & 2033
- Figure 49: Asia Pacific US E-commerce Logistics Industry Revenue Share (%), by Product 2025 & 2033
- Figure 50: Asia Pacific US E-commerce Logistics Industry Revenue (Million), by Country 2025 & 2033
- Figure 51: Asia Pacific US E-commerce Logistics Industry Revenue Share (%), by Country 2025 & 2033
List of Tables
- Table 1: Global US E-commerce Logistics Industry Revenue Million Forecast, by Service 2020 & 2033
- Table 2: Global US E-commerce Logistics Industry Revenue Million Forecast, by Business 2020 & 2033
- Table 3: Global US E-commerce Logistics Industry Revenue Million Forecast, by Destination 2020 & 2033
- Table 4: Global US E-commerce Logistics Industry Revenue Million Forecast, by Product 2020 & 2033
- Table 5: Global US E-commerce Logistics Industry Revenue Million Forecast, by Region 2020 & 2033
- Table 6: Global US E-commerce Logistics Industry Revenue Million Forecast, by Service 2020 & 2033
- Table 7: Global US E-commerce Logistics Industry Revenue Million Forecast, by Business 2020 & 2033
- Table 8: Global US E-commerce Logistics Industry Revenue Million Forecast, by Destination 2020 & 2033
- Table 9: Global US E-commerce Logistics Industry Revenue Million Forecast, by Product 2020 & 2033
- Table 10: Global US E-commerce Logistics Industry Revenue Million Forecast, by Country 2020 & 2033
- Table 11: United States US E-commerce Logistics Industry Revenue (Million) Forecast, by Application 2020 & 2033
- Table 12: Canada US E-commerce Logistics Industry Revenue (Million) Forecast, by Application 2020 & 2033
- Table 13: Mexico US E-commerce Logistics Industry Revenue (Million) Forecast, by Application 2020 & 2033
- Table 14: Global US E-commerce Logistics Industry Revenue Million Forecast, by Service 2020 & 2033
- Table 15: Global US E-commerce Logistics Industry Revenue Million Forecast, by Business 2020 & 2033
- Table 16: Global US E-commerce Logistics Industry Revenue Million Forecast, by Destination 2020 & 2033
- Table 17: Global US E-commerce Logistics Industry Revenue Million Forecast, by Product 2020 & 2033
- Table 18: Global US E-commerce Logistics Industry Revenue Million Forecast, by Country 2020 & 2033
- Table 19: Brazil US E-commerce Logistics Industry Revenue (Million) Forecast, by Application 2020 & 2033
- Table 20: Argentina US E-commerce Logistics Industry Revenue (Million) Forecast, by Application 2020 & 2033
- Table 21: Rest of South America US E-commerce Logistics Industry Revenue (Million) Forecast, by Application 2020 & 2033
- Table 22: Global US E-commerce Logistics Industry Revenue Million Forecast, by Service 2020 & 2033
- Table 23: Global US E-commerce Logistics Industry Revenue Million Forecast, by Business 2020 & 2033
- Table 24: Global US E-commerce Logistics Industry Revenue Million Forecast, by Destination 2020 & 2033
- Table 25: Global US E-commerce Logistics Industry Revenue Million Forecast, by Product 2020 & 2033
- Table 26: Global US E-commerce Logistics Industry Revenue Million Forecast, by Country 2020 & 2033
- Table 27: United Kingdom US E-commerce Logistics Industry Revenue (Million) Forecast, by Application 2020 & 2033
- Table 28: Germany US E-commerce Logistics Industry Revenue (Million) Forecast, by Application 2020 & 2033
- Table 29: France US E-commerce Logistics Industry Revenue (Million) Forecast, by Application 2020 & 2033
- Table 30: Italy US E-commerce Logistics Industry Revenue (Million) Forecast, by Application 2020 & 2033
- Table 31: Spain US E-commerce Logistics Industry Revenue (Million) Forecast, by Application 2020 & 2033
- Table 32: Russia US E-commerce Logistics Industry Revenue (Million) Forecast, by Application 2020 & 2033
- Table 33: Benelux US E-commerce Logistics Industry Revenue (Million) Forecast, by Application 2020 & 2033
- Table 34: Nordics US E-commerce Logistics Industry Revenue (Million) Forecast, by Application 2020 & 2033
- Table 35: Rest of Europe US E-commerce Logistics Industry Revenue (Million) Forecast, by Application 2020 & 2033
- Table 36: Global US E-commerce Logistics Industry Revenue Million Forecast, by Service 2020 & 2033
- Table 37: Global US E-commerce Logistics Industry Revenue Million Forecast, by Business 2020 & 2033
- Table 38: Global US E-commerce Logistics Industry Revenue Million Forecast, by Destination 2020 & 2033
- Table 39: Global US E-commerce Logistics Industry Revenue Million Forecast, by Product 2020 & 2033
- Table 40: Global US E-commerce Logistics Industry Revenue Million Forecast, by Country 2020 & 2033
- Table 41: Turkey US E-commerce Logistics Industry Revenue (Million) Forecast, by Application 2020 & 2033
- Table 42: Israel US E-commerce Logistics Industry Revenue (Million) Forecast, by Application 2020 & 2033
- Table 43: GCC US E-commerce Logistics Industry Revenue (Million) Forecast, by Application 2020 & 2033
- Table 44: North Africa US E-commerce Logistics Industry Revenue (Million) Forecast, by Application 2020 & 2033
- Table 45: South Africa US E-commerce Logistics Industry Revenue (Million) Forecast, by Application 2020 & 2033
- Table 46: Rest of Middle East & Africa US E-commerce Logistics Industry Revenue (Million) Forecast, by Application 2020 & 2033
- Table 47: Global US E-commerce Logistics Industry Revenue Million Forecast, by Service 2020 & 2033
- Table 48: Global US E-commerce Logistics Industry Revenue Million Forecast, by Business 2020 & 2033
- Table 49: Global US E-commerce Logistics Industry Revenue Million Forecast, by Destination 2020 & 2033
- Table 50: Global US E-commerce Logistics Industry Revenue Million Forecast, by Product 2020 & 2033
- Table 51: Global US E-commerce Logistics Industry Revenue Million Forecast, by Country 2020 & 2033
- Table 52: China US E-commerce Logistics Industry Revenue (Million) Forecast, by Application 2020 & 2033
- Table 53: India US E-commerce Logistics Industry Revenue (Million) Forecast, by Application 2020 & 2033
- Table 54: Japan US E-commerce Logistics Industry Revenue (Million) Forecast, by Application 2020 & 2033
- Table 55: South Korea US E-commerce Logistics Industry Revenue (Million) Forecast, by Application 2020 & 2033
- Table 56: ASEAN US E-commerce Logistics Industry Revenue (Million) Forecast, by Application 2020 & 2033
- Table 57: Oceania US E-commerce Logistics Industry Revenue (Million) Forecast, by Application 2020 & 2033
- Table 58: Rest of Asia Pacific US E-commerce Logistics Industry Revenue (Million) Forecast, by Application 2020 & 2033
Frequently Asked Questions
1. What is the projected Compound Annual Growth Rate (CAGR) of the US E-commerce Logistics Industry?
The projected CAGR is approximately 8.90%.
2. Which companies are prominent players in the US E-commerce Logistics Industry?
Key companies in the market include DB Schenker, DHL Logistics, Saddle Creek Logistics, UPS Supply Chain Solutions, XPO Logistics, Rakuten Super Logistics, FedEx, Geodis Logistics, Kenco Logistics Services, Kuehne and Nagel Logistics**List Not Exhaustive.
3. What are the main segments of the US E-commerce Logistics Industry?
The market segments include Service, Business, Destination, Product.
4. Can you provide details about the market size?
The market size is estimated to be USD 129.54 Million as of 2022.
5. What are some drivers contributing to market growth?
Rise In Cross Border Logistics; Upgrade e-commerce with new supply chain technology.
6. What are the notable trends driving market growth?
Upgrade e-commerce with new supply chain technology.
7. Are there any restraints impacting market growth?
Supply Chain Disruptions; Warehousing and Inventory management.
8. Can you provide examples of recent developments in the market?
August 2023: A new distribution center has been opened by DHL eCommerce as part of its five-year strategic growth plan. The new facility, located in the city of Melrose Park in Illinois, encompasses a total area of 352,000 square feet. In addition to capacity enhancement, the facility is equipped with an Automated Honeywell Cross-belt Loop Sorter, which is capable of handling up to forty thousand parcels and packages an hour. As part of the logistics provider's recent expansion, 11 warehouses have been constructed or relocated, and seven more are expected to be finished at some point in the near future, as reported by the sources.
9. What pricing options are available for accessing the report?
Pricing options include single-user, multi-user, and enterprise licenses priced at USD 3800, USD 4500, and USD 5800 respectively.
10. Is the market size provided in terms of value or volume?
The market size is provided in terms of value, measured in Million.
11. Are there any specific market keywords associated with the report?
Yes, the market keyword associated with the report is "US E-commerce Logistics Industry," which aids in identifying and referencing the specific market segment covered.
12. How do I determine which pricing option suits my needs best?
The pricing options vary based on user requirements and access needs. Individual users may opt for single-user licenses, while businesses requiring broader access may choose multi-user or enterprise licenses for cost-effective access to the report.
13. Are there any additional resources or data provided in the US E-commerce Logistics Industry report?
While the report offers comprehensive insights, it's advisable to review the specific contents or supplementary materials provided to ascertain if additional resources or data are available.
14. How can I stay updated on further developments or reports in the US E-commerce Logistics Industry?
To stay informed about further developments, trends, and reports in the US E-commerce Logistics Industry, consider subscribing to industry newsletters, following relevant companies and organizations, or regularly checking reputable industry news sources and publications.
Methodology
Step 1 - Identification of Relevant Samples Size from Population Database


Step 2 - Approaches for Defining Global Market Size (Value, Volume* & Price*)

Note*: In applicable scenarios
Step 3 - Data Sources
Primary Research
- Web Analytics
- Survey Reports
- Research Institute
- Latest Research Reports
- Opinion Leaders
Secondary Research
- Annual Reports
- White Paper
- Latest Press Release
- Industry Association
- Paid Database
- Investor Presentations

Step 4 - Data Triangulation
Involves using different sources of information in order to increase the validity of a study
These sources are likely to be stakeholders in a program - participants, other researchers, program staff, other community members, and so on.
Then we put all data in single framework & apply various statistical tools to find out the dynamic on the market.
During the analysis stage, feedback from the stakeholder groups would be compared to determine areas of agreement as well as areas of divergence