

Key Insights
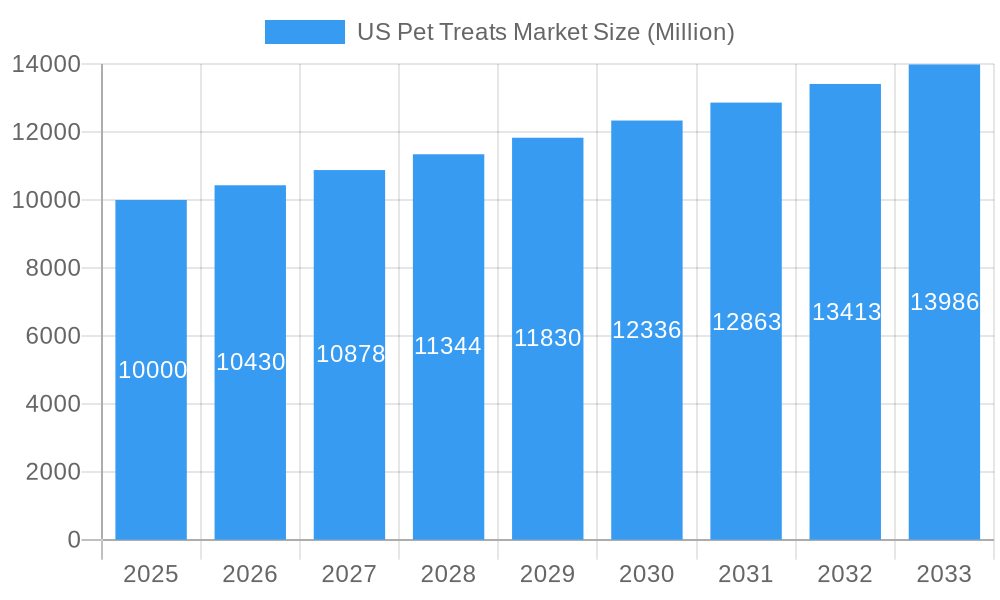
The U.S. pet treats market is poised for significant expansion, projecting a Compound Annual Growth Rate (CAGR) of 4.8%. The market size was valued at $5.1 billion in the base year 2025. This growth is driven by increasing pet adoption, the humanization of pets leading to premiumization in spending, and the rising demand for functional treats addressing specific health needs like dental and digestive support. Evolving consumer preferences favor natural, organic, and sustainably sourced ingredients. Key product segments include crunchy, dental, and soft & chewy treats, with online retail and supermarkets/hypermarkets as primary distribution channels. Market restraints include raw material price volatility and intense competition. Major players are strategically innovating and marketing to capitalize on these trends.
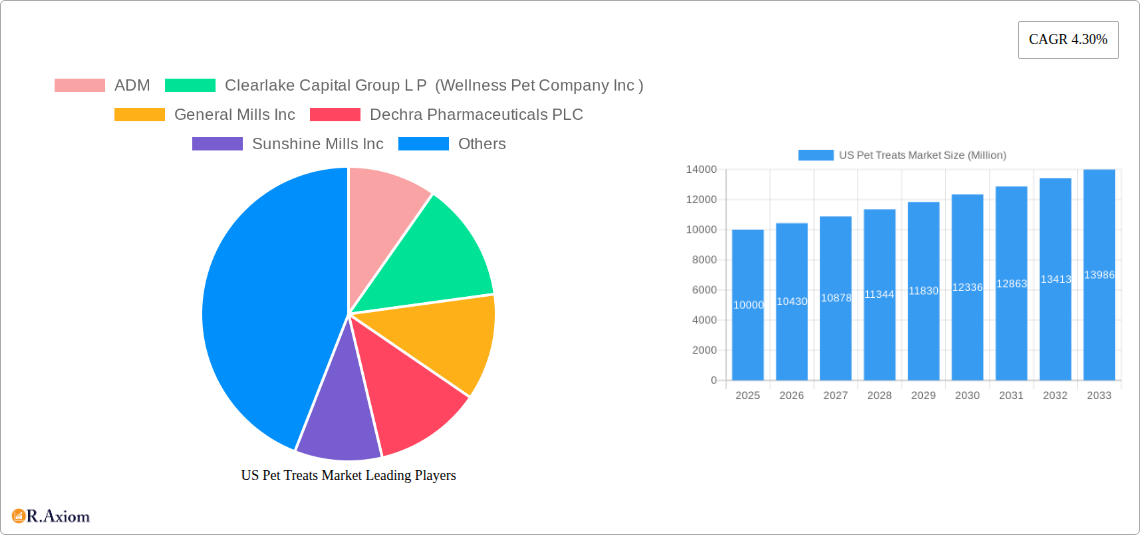
US Pet Treats Market Market Size (In Billion)
The competitive environment features both large corporations and specialized niche players. Future growth will be shaped by continued product innovation, advanced e-commerce strategies, and a focus on sustainability and transparency. Further analysis of regional trends indicates opportunities for tailored product development. Ongoing market research is crucial for tracking specific market shifts.
US Pet Treats Market Company Market Share
US Pet Treats Market: A Comprehensive Report (2019-2033)
This in-depth report provides a comprehensive analysis of the US Pet Treats Market, encompassing market size, segmentation, growth drivers, challenges, and key players. The study period spans 2019-2033, with 2025 serving as the base and estimated year. The report offers actionable insights for industry stakeholders, investors, and businesses seeking to navigate this dynamic market. The total market value in 2025 is estimated at xx Million.
US Pet Treats Market Concentration & Innovation
This section analyzes the competitive landscape of the US pet treats market, examining market concentration, innovation drivers, regulatory aspects, and key industry activities. The market is characterized by a combination of large multinational corporations and smaller, specialized players. Major players such as Mars Incorporated, Nestle (Purina), and Colgate-Palmove Company (Hill's Pet Nutrition Inc) hold significant market share, while smaller companies often focus on niche segments like organic or specialized pet treats. The market share of the top 5 players is estimated at xx% in 2025.
- Market Concentration: The market exhibits moderate concentration, with a few dominant players and numerous smaller competitors.
- Innovation Drivers: Increasing pet humanization, rising demand for premium and functional treats (e.g., dental, weight management), and technological advancements in treat formulation and packaging drive innovation.
- Regulatory Framework: FDA regulations concerning pet food safety and labeling significantly impact the industry. Compliance is crucial for all market participants.
- Product Substitutes: Homemade treats and alternative pet food products pose some level of competition.
- End-User Trends: Growing awareness of pet health and wellness fuels demand for functional treats. Consumers are increasingly seeking natural, organic, and grain-free options.
- M&A Activities: The market has witnessed significant M&A activity in recent years, with deals such as Nestle's acquisition of Red Collar Pet Foods illustrating the strategic importance of the US pet treats market. The total value of M&A deals in the last 5 years is estimated to be xx Million. Specific deal values are not publicly available for all transactions.
US Pet Treats Market Industry Trends & Insights
The US pet treats market is experiencing robust growth, driven by several key factors. The increasing humanization of pets, coupled with rising pet ownership and disposable incomes, is a primary growth catalyst. Consumers are willing to spend more on premium and specialized treats to enhance their pets’ well-being. The market is also witnessing a shift toward healthier and more natural options, leading to increased demand for organic, grain-free, and functional treats. Technological advancements, such as improved manufacturing processes and innovative packaging solutions, are further contributing to market expansion.
The market is characterized by strong competition, with key players constantly launching new products and engaging in aggressive marketing campaigns to gain market share. The CAGR for the US Pet Treats Market from 2025 to 2033 is projected to be xx%. Market penetration of premium pet treats is expected to reach xx% by 2033. E-commerce channels are experiencing rapid growth, offering increased convenience to consumers and expanding market reach for businesses. The changing consumer preferences toward healthier and more convenient options are also shaping the market dynamics.
Dominant Markets & Segments in US Pet Treats Market
The US pet treats market is segmented by distribution channel, sub-product type, and pet type.
- Distribution Channel: Supermarkets/hypermarkets constitute the largest distribution channel due to widespread availability and consumer familiarity. Online channels are experiencing the fastest growth, fueled by e-commerce penetration and consumer preference for convenience.
- Sub-Product: Soft & Chewy Treats hold the largest market share due to their palatability and ease of consumption for pets. The demand for functional treats, such as dental and freeze-dried treats, is growing rapidly due to increased awareness of pet health.
- Pets: Dogs remain the dominant segment, owning a significantly larger market share compared to cats and other pets. However, the cat treat segment is experiencing growth alongside a surge in cat ownership.
Key Drivers:
- Economic Factors: Rising disposable incomes and increasing pet ownership directly impact market growth.
- Infrastructure: Efficient supply chains and widespread retail distribution networks contribute to market accessibility.
US Pet Treats Market Product Developments
Recent product innovations have focused on functional treats catering to specific pet health needs, such as dental health, weight management, and joint support. The market also shows a trend towards natural, organic, and grain-free ingredients. Technological advancements in treat formulation and packaging contribute to improved shelf life, palatability, and overall product quality. This focus on health and convenience ensures the continued growth and evolution of the market, meeting consumers’ evolving expectations.
Report Scope & Segmentation Analysis
This report comprehensively segments the US Pet Treats Market by:
- Distribution Channel: Convenience Stores, Online Channel, Specialty Stores, Supermarkets/Hypermarkets, Other Channels (with growth projections and market size for each).
- Sub-Product: Crunchy Treats, Dental Treats, Freeze-dried and Jerky Treats, Soft & Chewy Treats, Other Treats (with growth projections and market size for each).
- Pets: Cats, Dogs, Other Pets (with growth projections and market size for each).
Key Drivers of US Pet Treats Market Growth
The US pet treats market's growth is driven by several factors: increasing pet humanization leading to higher spending on premium treats; rising pet ownership rates across the country; a growing preference for convenient, healthy, and functional treats; and technological innovations enhancing product quality and manufacturing efficiency. The expanding e-commerce sector also provides significant growth opportunities.
Challenges in the US Pet Treats Market Sector
The US pet treats market faces challenges including increased competition, fluctuating raw material prices affecting production costs, and stringent regulatory requirements impacting product development and launch timelines. Supply chain disruptions can lead to production delays and increased costs, and maintaining high-quality standards while balancing affordability remains a key challenge.
Emerging Opportunities in US Pet Treats Market
Emerging opportunities lie in the increasing demand for functional and specialized treats addressing specific health needs, the rise of online retail channels, and the growing popularity of subscription services for pet treats. Expansion into niche segments, such as treats for senior pets or pets with allergies, presents further growth potential.
Leading Players in the US Pet Treats Market Market
- ADM
- Clearlake Capital Group L P (Wellness Pet Company Inc)
- General Mills Inc
- Dechra Pharmaceuticals PLC
- Sunshine Mills Inc
- Mars Incorporated
- Nestle (Purina)
- Colgate-Palmolive Company (Hill's Pet Nutrition Inc)
- Virba
- The J M Smucker Company
Key Developments in US Pet Treats Market Industry
- February 2023: Nestle SA acquired the US pet treats factory from Red Collar Pet Foods, aiming to expand its pet food business in North America.
- March 2023: Temptations (Mars Incorporated) launched Temptation Tender Fills treats and new flavors of Temptations Creamy Purrrr-ee treats.
- May 2023: Nestle Purina launched new Friskies Playfuls cat treats in chicken/liver and salmon/shrimp flavors.
Strategic Outlook for US Pet Treats Market Market
The US pet treats market exhibits strong growth potential, driven by sustained consumer spending on premium pet products and the increasing adoption of e-commerce. Continued innovation in product formulation, packaging, and marketing strategies will be crucial for success. Focusing on functional treats catering to specific pet health needs and leveraging digital channels to reach a broader audience will shape the future of this dynamic market.
US Pet Treats Market Segmentation
-
1. Sub Product
- 1.1. Crunchy Treats
- 1.2. Dental Treats
- 1.3. Freeze-dried and Jerky Treats
- 1.4. Soft & Chewy Treats
- 1.5. Other Treats
-
2. Pets
- 2.1. Cats
- 2.2. Dogs
- 2.3. Other Pets
-
3. Distribution Channel
- 3.1. Convenience Stores
- 3.2. Online Channel
- 3.3. Specialty Stores
- 3.4. Supermarkets/Hypermarkets
- 3.5. Other Channels
US Pet Treats Market Segmentation By Geography
-
1. North America
- 1.1. United States
- 1.2. Canada
- 1.3. Mexico
-
2. South America
- 2.1. Brazil
- 2.2. Argentina
- 2.3. Rest of South America
-
3. Europe
- 3.1. United Kingdom
- 3.2. Germany
- 3.3. France
- 3.4. Italy
- 3.5. Spain
- 3.6. Russia
- 3.7. Benelux
- 3.8. Nordics
- 3.9. Rest of Europe
-
4. Middle East & Africa
- 4.1. Turkey
- 4.2. Israel
- 4.3. GCC
- 4.4. North Africa
- 4.5. South Africa
- 4.6. Rest of Middle East & Africa
-
5. Asia Pacific
- 5.1. China
- 5.2. India
- 5.3. Japan
- 5.4. South Korea
- 5.5. ASEAN
- 5.6. Oceania
- 5.7. Rest of Asia Pacific
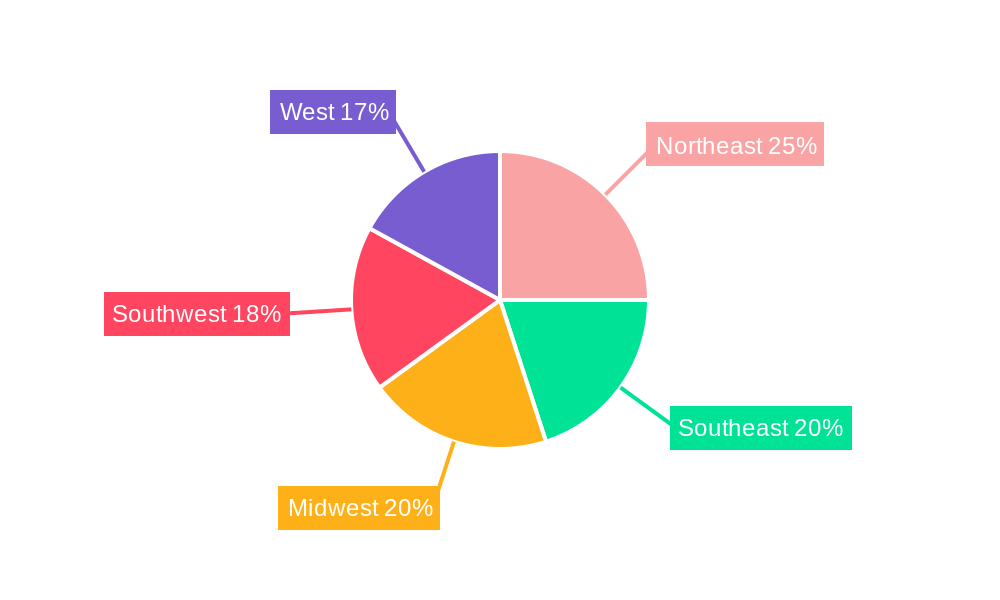
US Pet Treats Market Regional Market Share
Geographic Coverage of US Pet Treats Market
US Pet Treats Market REPORT HIGHLIGHTS
| Aspects | Details |
|---|---|
| Study Period | 2020-2034 |
| Base Year | 2025 |
| Estimated Year | 2026 |
| Forecast Period | 2026-2034 |
| Historical Period | 2020-2025 |
| Growth Rate | CAGR of 4.8% from 2020-2034 |
| Segmentation |
|
Table of Contents
- 1. Introduction
- 1.1. Research Scope
- 1.2. Market Segmentation
- 1.3. Research Objective
- 1.4. Definitions and Assumptions
- 2. Executive Summary
- 2.1. Market Snapshot
- 3. Market Dynamics
- 3.1. Market Drivers
- 3.2. Market Restrains
- 3.3. Market Trends
- 3.4. Market Opportunities
- 4. Market Factor Analysis
- 4.1. Porters Five Forces
- 4.1.1. Bargaining Power of Suppliers
- 4.1.2. Bargaining Power of Buyers
- 4.1.3. Threat of New Entrants
- 4.1.4. Threat of Substitutes
- 4.1.5. Competitive Rivalry
- 4.2. PESTEL analysis
- 4.3. BCG Analysis
- 4.3.1. Stars (High Growth, High Market Share)
- 4.3.2. Cash Cows (Low Growth, High Market Share)
- 4.3.3. Question Mark (High Growth, Low Market Share)
- 4.3.4. Dogs (Low Growth, Low Market Share)
- 4.4. Ansoff Matrix Analysis
- 4.5. Supply Chain Analysis
- 4.6. Regulatory Landscape
- 4.7. Current Market Potential and Opportunity Assessment (TAM–SAM–SOM Framework)
- 4.8. RAX Analyst Note
- 4.1. Porters Five Forces
- 5. Market Analysis, Insights and Forecast 2021-2033
- 5.1. Market Analysis, Insights and Forecast - by Sub Product
- 5.1.1. Crunchy Treats
- 5.1.2. Dental Treats
- 5.1.3. Freeze-dried and Jerky Treats
- 5.1.4. Soft & Chewy Treats
- 5.1.5. Other Treats
- 5.2. Market Analysis, Insights and Forecast - by Pets
- 5.2.1. Cats
- 5.2.2. Dogs
- 5.2.3. Other Pets
- 5.3. Market Analysis, Insights and Forecast - by Distribution Channel
- 5.3.1. Convenience Stores
- 5.3.2. Online Channel
- 5.3.3. Specialty Stores
- 5.3.4. Supermarkets/Hypermarkets
- 5.3.5. Other Channels
- 5.4. Market Analysis, Insights and Forecast - by Region
- 5.4.1. North America
- 5.4.2. South America
- 5.4.3. Europe
- 5.4.4. Middle East & Africa
- 5.4.5. Asia Pacific
- 5.1. Market Analysis, Insights and Forecast - by Sub Product
- 6. Global US Pet Treats Market Analysis, Insights and Forecast, 2021-2033
- 6.1. Market Analysis, Insights and Forecast - by Sub Product
- 6.1.1. Crunchy Treats
- 6.1.2. Dental Treats
- 6.1.3. Freeze-dried and Jerky Treats
- 6.1.4. Soft & Chewy Treats
- 6.1.5. Other Treats
- 6.2. Market Analysis, Insights and Forecast - by Pets
- 6.2.1. Cats
- 6.2.2. Dogs
- 6.2.3. Other Pets
- 6.3. Market Analysis, Insights and Forecast - by Distribution Channel
- 6.3.1. Convenience Stores
- 6.3.2. Online Channel
- 6.3.3. Specialty Stores
- 6.3.4. Supermarkets/Hypermarkets
- 6.3.5. Other Channels
- 6.1. Market Analysis, Insights and Forecast - by Sub Product
- 7. North America US Pet Treats Market Analysis, Insights and Forecast, 2020-2032
- 7.1. Market Analysis, Insights and Forecast - by Sub Product
- 7.1.1. Crunchy Treats
- 7.1.2. Dental Treats
- 7.1.3. Freeze-dried and Jerky Treats
- 7.1.4. Soft & Chewy Treats
- 7.1.5. Other Treats
- 7.2. Market Analysis, Insights and Forecast - by Pets
- 7.2.1. Cats
- 7.2.2. Dogs
- 7.2.3. Other Pets
- 7.3. Market Analysis, Insights and Forecast - by Distribution Channel
- 7.3.1. Convenience Stores
- 7.3.2. Online Channel
- 7.3.3. Specialty Stores
- 7.3.4. Supermarkets/Hypermarkets
- 7.3.5. Other Channels
- 7.1. Market Analysis, Insights and Forecast - by Sub Product
- 8. South America US Pet Treats Market Analysis, Insights and Forecast, 2020-2032
- 8.1. Market Analysis, Insights and Forecast - by Sub Product
- 8.1.1. Crunchy Treats
- 8.1.2. Dental Treats
- 8.1.3. Freeze-dried and Jerky Treats
- 8.1.4. Soft & Chewy Treats
- 8.1.5. Other Treats
- 8.2. Market Analysis, Insights and Forecast - by Pets
- 8.2.1. Cats
- 8.2.2. Dogs
- 8.2.3. Other Pets
- 8.3. Market Analysis, Insights and Forecast - by Distribution Channel
- 8.3.1. Convenience Stores
- 8.3.2. Online Channel
- 8.3.3. Specialty Stores
- 8.3.4. Supermarkets/Hypermarkets
- 8.3.5. Other Channels
- 8.1. Market Analysis, Insights and Forecast - by Sub Product
- 9. Europe US Pet Treats Market Analysis, Insights and Forecast, 2020-2032
- 9.1. Market Analysis, Insights and Forecast - by Sub Product
- 9.1.1. Crunchy Treats
- 9.1.2. Dental Treats
- 9.1.3. Freeze-dried and Jerky Treats
- 9.1.4. Soft & Chewy Treats
- 9.1.5. Other Treats
- 9.2. Market Analysis, Insights and Forecast - by Pets
- 9.2.1. Cats
- 9.2.2. Dogs
- 9.2.3. Other Pets
- 9.3. Market Analysis, Insights and Forecast - by Distribution Channel
- 9.3.1. Convenience Stores
- 9.3.2. Online Channel
- 9.3.3. Specialty Stores
- 9.3.4. Supermarkets/Hypermarkets
- 9.3.5. Other Channels
- 9.1. Market Analysis, Insights and Forecast - by Sub Product
- 10. Middle East & Africa US Pet Treats Market Analysis, Insights and Forecast, 2020-2032
- 10.1. Market Analysis, Insights and Forecast - by Sub Product
- 10.1.1. Crunchy Treats
- 10.1.2. Dental Treats
- 10.1.3. Freeze-dried and Jerky Treats
- 10.1.4. Soft & Chewy Treats
- 10.1.5. Other Treats
- 10.2. Market Analysis, Insights and Forecast - by Pets
- 10.2.1. Cats
- 10.2.2. Dogs
- 10.2.3. Other Pets
- 10.3. Market Analysis, Insights and Forecast - by Distribution Channel
- 10.3.1. Convenience Stores
- 10.3.2. Online Channel
- 10.3.3. Specialty Stores
- 10.3.4. Supermarkets/Hypermarkets
- 10.3.5. Other Channels
- 10.1. Market Analysis, Insights and Forecast - by Sub Product
- 11. Asia Pacific US Pet Treats Market Analysis, Insights and Forecast, 2020-2032
- 11.1. Market Analysis, Insights and Forecast - by Sub Product
- 11.1.1. Crunchy Treats
- 11.1.2. Dental Treats
- 11.1.3. Freeze-dried and Jerky Treats
- 11.1.4. Soft & Chewy Treats
- 11.1.5. Other Treats
- 11.2. Market Analysis, Insights and Forecast - by Pets
- 11.2.1. Cats
- 11.2.2. Dogs
- 11.2.3. Other Pets
- 11.3. Market Analysis, Insights and Forecast - by Distribution Channel
- 11.3.1. Convenience Stores
- 11.3.2. Online Channel
- 11.3.3. Specialty Stores
- 11.3.4. Supermarkets/Hypermarkets
- 11.3.5. Other Channels
- 11.1. Market Analysis, Insights and Forecast - by Sub Product
- 12. Competitive Analysis
- 12.1. Company Profiles
- 12.1.1 ADM
- 12.1.1.1. Company Overview
- 12.1.1.2. Products
- 12.1.1.3. Company Financials
- 12.1.1.4. SWOT Analysis
- 12.1.2 Clearlake Capital Group L P (Wellness Pet Company Inc )
- 12.1.2.1. Company Overview
- 12.1.2.2. Products
- 12.1.2.3. Company Financials
- 12.1.2.4. SWOT Analysis
- 12.1.3 General Mills Inc
- 12.1.3.1. Company Overview
- 12.1.3.2. Products
- 12.1.3.3. Company Financials
- 12.1.3.4. SWOT Analysis
- 12.1.4 Dechra Pharmaceuticals PLC
- 12.1.4.1. Company Overview
- 12.1.4.2. Products
- 12.1.4.3. Company Financials
- 12.1.4.4. SWOT Analysis
- 12.1.5 Sunshine Mills Inc
- 12.1.5.1. Company Overview
- 12.1.5.2. Products
- 12.1.5.3. Company Financials
- 12.1.5.4. SWOT Analysis
- 12.1.6 Mars Incorporated
- 12.1.6.1. Company Overview
- 12.1.6.2. Products
- 12.1.6.3. Company Financials
- 12.1.6.4. SWOT Analysis
- 12.1.7 Nestle (Purina)
- 12.1.7.1. Company Overview
- 12.1.7.2. Products
- 12.1.7.3. Company Financials
- 12.1.7.4. SWOT Analysis
- 12.1.8 Colgate-Palmolive Company (Hill's Pet Nutrition Inc )
- 12.1.8.1. Company Overview
- 12.1.8.2. Products
- 12.1.8.3. Company Financials
- 12.1.8.4. SWOT Analysis
- 12.1.9 Virba
- 12.1.9.1. Company Overview
- 12.1.9.2. Products
- 12.1.9.3. Company Financials
- 12.1.9.4. SWOT Analysis
- 12.1.10 The J M Smucker Company
- 12.1.10.1. Company Overview
- 12.1.10.2. Products
- 12.1.10.3. Company Financials
- 12.1.10.4. SWOT Analysis
- 12.1.1 ADM
- 12.2. Market Entropy
- 12.2.1 Company's Key Areas Served
- 12.2.2 Recent Developments
- 12.3. Company Market Share Analysis 2025
- 12.3.1 Top 5 Companies Market Share Analysis
- 12.3.2 Top 3 Companies Market Share Analysis
- 12.4. List of Potential Customers
- 13. Research Methodology
List of Figures
- Figure 1: Global US Pet Treats Market Revenue Breakdown (billion, %) by Region 2025 & 2033
- Figure 2: North America US Pet Treats Market Revenue (billion), by Sub Product 2025 & 2033
- Figure 3: North America US Pet Treats Market Revenue Share (%), by Sub Product 2025 & 2033
- Figure 4: North America US Pet Treats Market Revenue (billion), by Pets 2025 & 2033
- Figure 5: North America US Pet Treats Market Revenue Share (%), by Pets 2025 & 2033
- Figure 6: North America US Pet Treats Market Revenue (billion), by Distribution Channel 2025 & 2033
- Figure 7: North America US Pet Treats Market Revenue Share (%), by Distribution Channel 2025 & 2033
- Figure 8: North America US Pet Treats Market Revenue (billion), by Country 2025 & 2033
- Figure 9: North America US Pet Treats Market Revenue Share (%), by Country 2025 & 2033
- Figure 10: South America US Pet Treats Market Revenue (billion), by Sub Product 2025 & 2033
- Figure 11: South America US Pet Treats Market Revenue Share (%), by Sub Product 2025 & 2033
- Figure 12: South America US Pet Treats Market Revenue (billion), by Pets 2025 & 2033
- Figure 13: South America US Pet Treats Market Revenue Share (%), by Pets 2025 & 2033
- Figure 14: South America US Pet Treats Market Revenue (billion), by Distribution Channel 2025 & 2033
- Figure 15: South America US Pet Treats Market Revenue Share (%), by Distribution Channel 2025 & 2033
- Figure 16: South America US Pet Treats Market Revenue (billion), by Country 2025 & 2033
- Figure 17: South America US Pet Treats Market Revenue Share (%), by Country 2025 & 2033
- Figure 18: Europe US Pet Treats Market Revenue (billion), by Sub Product 2025 & 2033
- Figure 19: Europe US Pet Treats Market Revenue Share (%), by Sub Product 2025 & 2033
- Figure 20: Europe US Pet Treats Market Revenue (billion), by Pets 2025 & 2033
- Figure 21: Europe US Pet Treats Market Revenue Share (%), by Pets 2025 & 2033
- Figure 22: Europe US Pet Treats Market Revenue (billion), by Distribution Channel 2025 & 2033
- Figure 23: Europe US Pet Treats Market Revenue Share (%), by Distribution Channel 2025 & 2033
- Figure 24: Europe US Pet Treats Market Revenue (billion), by Country 2025 & 2033
- Figure 25: Europe US Pet Treats Market Revenue Share (%), by Country 2025 & 2033
- Figure 26: Middle East & Africa US Pet Treats Market Revenue (billion), by Sub Product 2025 & 2033
- Figure 27: Middle East & Africa US Pet Treats Market Revenue Share (%), by Sub Product 2025 & 2033
- Figure 28: Middle East & Africa US Pet Treats Market Revenue (billion), by Pets 2025 & 2033
- Figure 29: Middle East & Africa US Pet Treats Market Revenue Share (%), by Pets 2025 & 2033
- Figure 30: Middle East & Africa US Pet Treats Market Revenue (billion), by Distribution Channel 2025 & 2033
- Figure 31: Middle East & Africa US Pet Treats Market Revenue Share (%), by Distribution Channel 2025 & 2033
- Figure 32: Middle East & Africa US Pet Treats Market Revenue (billion), by Country 2025 & 2033
- Figure 33: Middle East & Africa US Pet Treats Market Revenue Share (%), by Country 2025 & 2033
- Figure 34: Asia Pacific US Pet Treats Market Revenue (billion), by Sub Product 2025 & 2033
- Figure 35: Asia Pacific US Pet Treats Market Revenue Share (%), by Sub Product 2025 & 2033
- Figure 36: Asia Pacific US Pet Treats Market Revenue (billion), by Pets 2025 & 2033
- Figure 37: Asia Pacific US Pet Treats Market Revenue Share (%), by Pets 2025 & 2033
- Figure 38: Asia Pacific US Pet Treats Market Revenue (billion), by Distribution Channel 2025 & 2033
- Figure 39: Asia Pacific US Pet Treats Market Revenue Share (%), by Distribution Channel 2025 & 2033
- Figure 40: Asia Pacific US Pet Treats Market Revenue (billion), by Country 2025 & 2033
- Figure 41: Asia Pacific US Pet Treats Market Revenue Share (%), by Country 2025 & 2033
List of Tables
- Table 1: Global US Pet Treats Market Revenue billion Forecast, by Sub Product 2020 & 2033
- Table 2: Global US Pet Treats Market Revenue billion Forecast, by Pets 2020 & 2033
- Table 3: Global US Pet Treats Market Revenue billion Forecast, by Distribution Channel 2020 & 2033
- Table 4: Global US Pet Treats Market Revenue billion Forecast, by Region 2020 & 2033
- Table 5: Global US Pet Treats Market Revenue billion Forecast, by Sub Product 2020 & 2033
- Table 6: Global US Pet Treats Market Revenue billion Forecast, by Pets 2020 & 2033
- Table 7: Global US Pet Treats Market Revenue billion Forecast, by Distribution Channel 2020 & 2033
- Table 8: Global US Pet Treats Market Revenue billion Forecast, by Country 2020 & 2033
- Table 9: United States US Pet Treats Market Revenue (billion) Forecast, by Application 2020 & 2033
- Table 10: Canada US Pet Treats Market Revenue (billion) Forecast, by Application 2020 & 2033
- Table 11: Mexico US Pet Treats Market Revenue (billion) Forecast, by Application 2020 & 2033
- Table 12: Global US Pet Treats Market Revenue billion Forecast, by Sub Product 2020 & 2033
- Table 13: Global US Pet Treats Market Revenue billion Forecast, by Pets 2020 & 2033
- Table 14: Global US Pet Treats Market Revenue billion Forecast, by Distribution Channel 2020 & 2033
- Table 15: Global US Pet Treats Market Revenue billion Forecast, by Country 2020 & 2033
- Table 16: Brazil US Pet Treats Market Revenue (billion) Forecast, by Application 2020 & 2033
- Table 17: Argentina US Pet Treats Market Revenue (billion) Forecast, by Application 2020 & 2033
- Table 18: Rest of South America US Pet Treats Market Revenue (billion) Forecast, by Application 2020 & 2033
- Table 19: Global US Pet Treats Market Revenue billion Forecast, by Sub Product 2020 & 2033
- Table 20: Global US Pet Treats Market Revenue billion Forecast, by Pets 2020 & 2033
- Table 21: Global US Pet Treats Market Revenue billion Forecast, by Distribution Channel 2020 & 2033
- Table 22: Global US Pet Treats Market Revenue billion Forecast, by Country 2020 & 2033
- Table 23: United Kingdom US Pet Treats Market Revenue (billion) Forecast, by Application 2020 & 2033
- Table 24: Germany US Pet Treats Market Revenue (billion) Forecast, by Application 2020 & 2033
- Table 25: France US Pet Treats Market Revenue (billion) Forecast, by Application 2020 & 2033
- Table 26: Italy US Pet Treats Market Revenue (billion) Forecast, by Application 2020 & 2033
- Table 27: Spain US Pet Treats Market Revenue (billion) Forecast, by Application 2020 & 2033
- Table 28: Russia US Pet Treats Market Revenue (billion) Forecast, by Application 2020 & 2033
- Table 29: Benelux US Pet Treats Market Revenue (billion) Forecast, by Application 2020 & 2033
- Table 30: Nordics US Pet Treats Market Revenue (billion) Forecast, by Application 2020 & 2033
- Table 31: Rest of Europe US Pet Treats Market Revenue (billion) Forecast, by Application 2020 & 2033
- Table 32: Global US Pet Treats Market Revenue billion Forecast, by Sub Product 2020 & 2033
- Table 33: Global US Pet Treats Market Revenue billion Forecast, by Pets 2020 & 2033
- Table 34: Global US Pet Treats Market Revenue billion Forecast, by Distribution Channel 2020 & 2033
- Table 35: Global US Pet Treats Market Revenue billion Forecast, by Country 2020 & 2033
- Table 36: Turkey US Pet Treats Market Revenue (billion) Forecast, by Application 2020 & 2033
- Table 37: Israel US Pet Treats Market Revenue (billion) Forecast, by Application 2020 & 2033
- Table 38: GCC US Pet Treats Market Revenue (billion) Forecast, by Application 2020 & 2033
- Table 39: North Africa US Pet Treats Market Revenue (billion) Forecast, by Application 2020 & 2033
- Table 40: South Africa US Pet Treats Market Revenue (billion) Forecast, by Application 2020 & 2033
- Table 41: Rest of Middle East & Africa US Pet Treats Market Revenue (billion) Forecast, by Application 2020 & 2033
- Table 42: Global US Pet Treats Market Revenue billion Forecast, by Sub Product 2020 & 2033
- Table 43: Global US Pet Treats Market Revenue billion Forecast, by Pets 2020 & 2033
- Table 44: Global US Pet Treats Market Revenue billion Forecast, by Distribution Channel 2020 & 2033
- Table 45: Global US Pet Treats Market Revenue billion Forecast, by Country 2020 & 2033
- Table 46: China US Pet Treats Market Revenue (billion) Forecast, by Application 2020 & 2033
- Table 47: India US Pet Treats Market Revenue (billion) Forecast, by Application 2020 & 2033
- Table 48: Japan US Pet Treats Market Revenue (billion) Forecast, by Application 2020 & 2033
- Table 49: South Korea US Pet Treats Market Revenue (billion) Forecast, by Application 2020 & 2033
- Table 50: ASEAN US Pet Treats Market Revenue (billion) Forecast, by Application 2020 & 2033
- Table 51: Oceania US Pet Treats Market Revenue (billion) Forecast, by Application 2020 & 2033
- Table 52: Rest of Asia Pacific US Pet Treats Market Revenue (billion) Forecast, by Application 2020 & 2033
Frequently Asked Questions
1. What is the projected Compound Annual Growth Rate (CAGR) of the US Pet Treats Market?
The projected CAGR is approximately 4.8%.
2. Which companies are prominent players in the US Pet Treats Market?
Key companies in the market include ADM, Clearlake Capital Group L P (Wellness Pet Company Inc ), General Mills Inc, Dechra Pharmaceuticals PLC, Sunshine Mills Inc, Mars Incorporated, Nestle (Purina), Colgate-Palmolive Company (Hill's Pet Nutrition Inc ), Virba, The J M Smucker Company.
3. What are the main segments of the US Pet Treats Market?
The market segments include Sub Product, Pets, Distribution Channel.
4. Can you provide details about the market size?
The market size is estimated to be USD 5.1 billion as of 2022.
5. What are some drivers contributing to market growth?
Increased Demand for Meat; Initiatives By the Key Players; Focus on Animal nutrition and Health.
6. What are the notable trends driving market growth?
OTHER KEY INDUSTRY TRENDS COVERED IN THE REPORT.
7. Are there any restraints impacting market growth?
Shift Toward Vegan- Based Diet; Changing Raw Material Prices and Strict Government Rules to Restrict Market Growth.
8. Can you provide examples of recent developments in the market?
May 2023: Nestle Purina launched new cat treats under the Friskies "Friskies Playfuls - treats" brand. These treats are round in shape and are available in chicken and liver and salmon and shrimp flavors for adult cats.March 2023: Temptations, a brand under Mars Incorporated, expanded its treats offerings with a new product called Temptation Tender Fills treats and two new flavors of its Temptations Creamy Purrrr-ee treats.February 2023: Nestle SA acquired the US pet treats factory from investor-backed local supplier Red Collar Pet Foods. The company aims to expand its pet food business in North America.
9. What pricing options are available for accessing the report?
Pricing options include single-user, multi-user, and enterprise licenses priced at USD 3800, USD 4500, and USD 5800 respectively.
10. Is the market size provided in terms of value or volume?
The market size is provided in terms of value, measured in billion.
11. Are there any specific market keywords associated with the report?
Yes, the market keyword associated with the report is "US Pet Treats Market," which aids in identifying and referencing the specific market segment covered.
12. How do I determine which pricing option suits my needs best?
The pricing options vary based on user requirements and access needs. Individual users may opt for single-user licenses, while businesses requiring broader access may choose multi-user or enterprise licenses for cost-effective access to the report.
13. Are there any additional resources or data provided in the US Pet Treats Market report?
While the report offers comprehensive insights, it's advisable to review the specific contents or supplementary materials provided to ascertain if additional resources or data are available.
14. How can I stay updated on further developments or reports in the US Pet Treats Market?
To stay informed about further developments, trends, and reports in the US Pet Treats Market, consider subscribing to industry newsletters, following relevant companies and organizations, or regularly checking reputable industry news sources and publications.
Methodology
Step 1 - Identification of Relevant Samples Size from Population Database


Step 2 - Approaches for Defining Global Market Size (Value, Volume* & Price*)

Note*: In applicable scenarios
Step 3 - Data Sources
Primary Research
- Web Analytics
- Survey Reports
- Research Institute
- Latest Research Reports
- Opinion Leaders
Secondary Research
- Annual Reports
- White Paper
- Latest Press Release
- Industry Association
- Paid Database
- Investor Presentations

Step 4 - Data Triangulation
Involves using different sources of information in order to increase the validity of a study
These sources are likely to be stakeholders in a program - participants, other researchers, program staff, other community members, and so on.
Then we put all data in single framework & apply various statistical tools to find out the dynamic on the market.
During the analysis stage, feedback from the stakeholder groups would be compared to determine areas of agreement as well as areas of divergence