

Key Insights
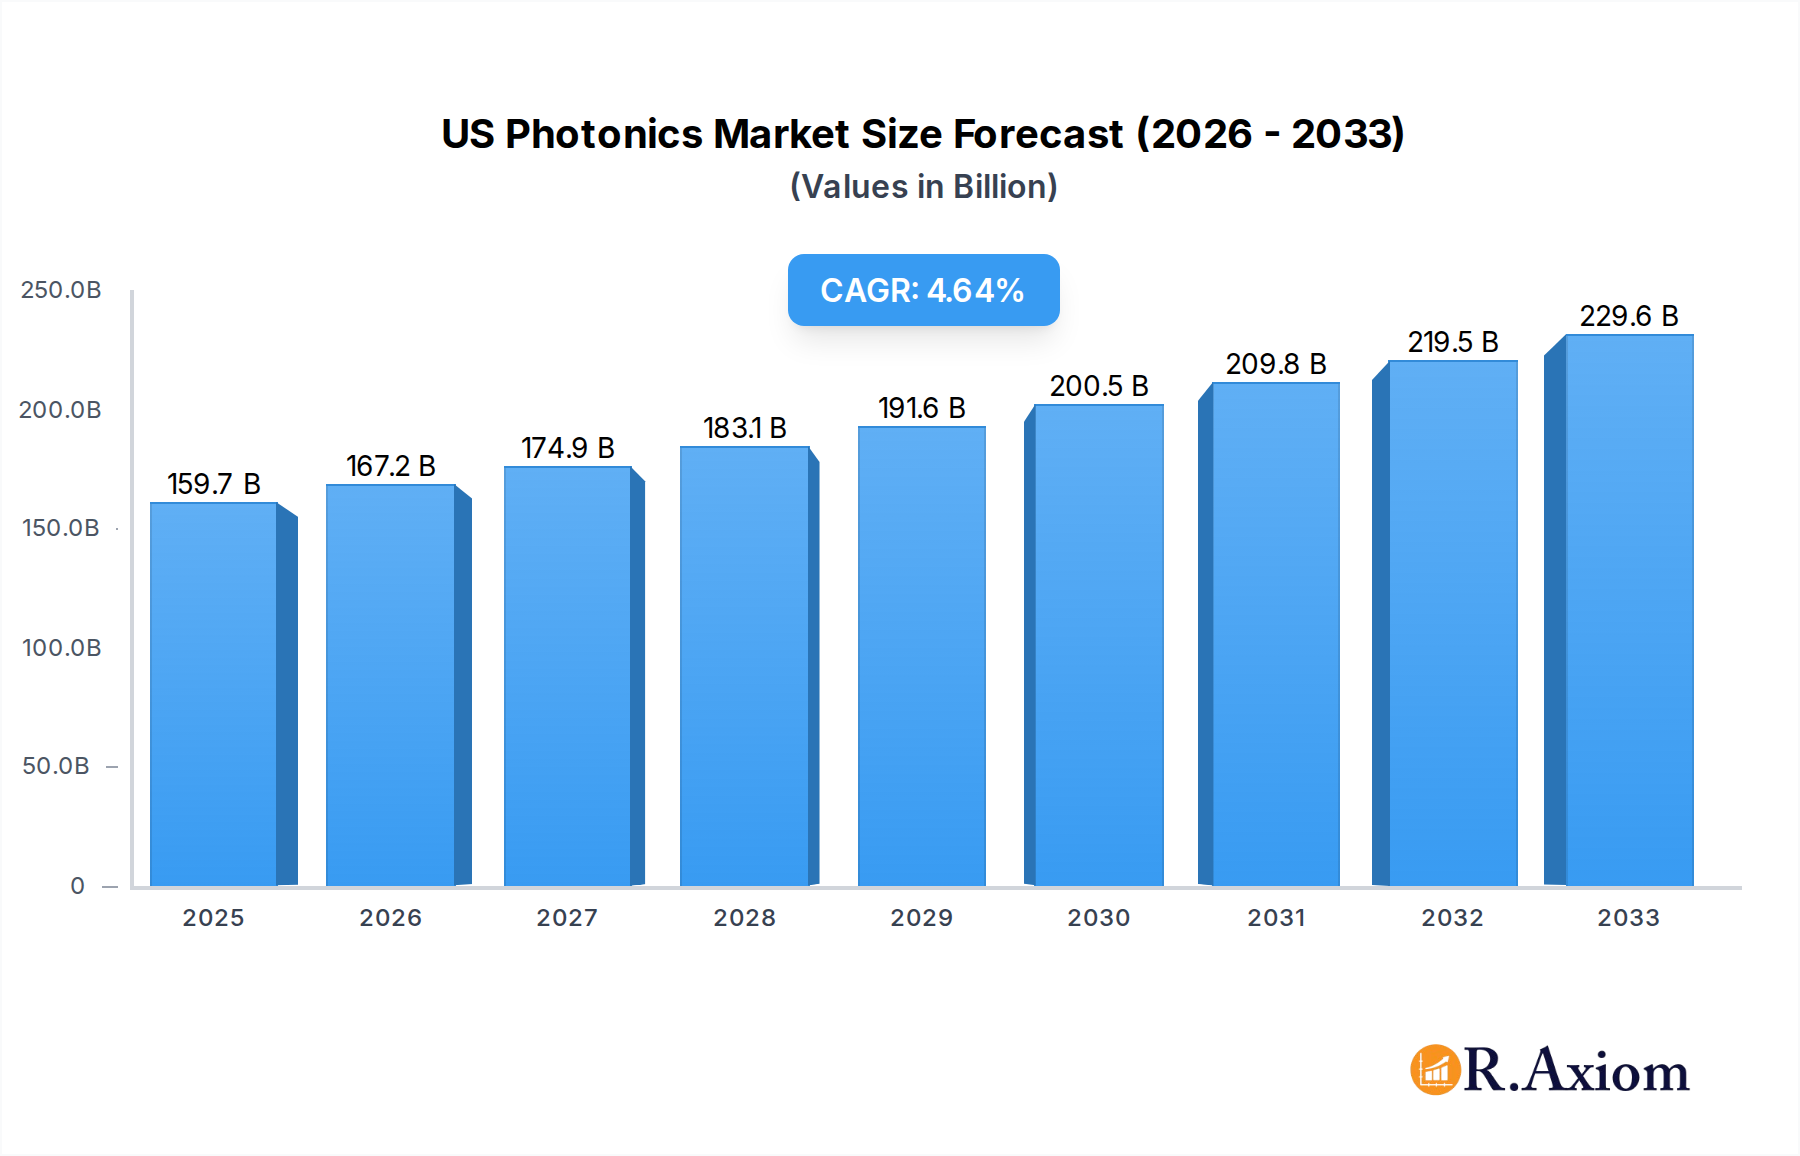
The US photonics market is poised for significant expansion, with an estimated market size of $159.69 billion in 2025. This robust growth is projected to continue at a Compound Annual Growth Rate (CAGR) of 4.71% through 2033. This upward trajectory is fueled by a confluence of powerful drivers, including the relentless advancements in production technology, the increasing demand for high-speed data communication, and the burgeoning applications within medical technology and sophisticated imaging systems. Furthermore, the ubiquitous need for energy-efficient lighting solutions and the ever-evolving landscape of surveying and detection technologies are providing substantial impetus. The photonics industry's ability to enable breakthroughs in these diverse sectors positions it as a cornerstone of technological innovation and economic development in the United States.

US Photonics Market Market Size (In Billion)
Key trends shaping the US photonics market include the miniaturization of photonic components, the integration of artificial intelligence with photonic systems for enhanced data analysis and control, and the growing adoption of photonic solutions in quantum computing and advanced sensing. While the market demonstrates strong growth, it is not without its challenges. Restraints such as the high cost of research and development for cutting-edge photonics technologies and complex manufacturing processes may present hurdles. However, the sustained investment in innovation by leading companies like Hamamatsu Photonics KK, Intel Corporation, and ams OSRAM AG, alongside increasing government support for advanced manufacturing and R&D, are expected to mitigate these limitations. The diverse applications, ranging from telecommunications to advanced manufacturing and healthcare, underscore the strategic importance and future potential of the US photonics sector.
US Photonics Market Company Market Share
This in-depth report offers a definitive analysis of the US Photonics Market, a sector poised for significant expansion driven by relentless innovation and expanding applications. Covering the historical period of 2019–2024 and projecting growth through 2033, with a base year of 2025, this research provides critical insights for industry stakeholders. The study explores key segments including Surveying and Detection, Production Technology, Data Communication, Image Capture and Display, Medical Technology, Lighting, and Other Applications. Understand the market dynamics, competitive landscape, and emerging opportunities within this transformative industry. The report is essential for companies seeking to capitalize on the $50 billion US Photonics Market by 2025.
US Photonics Market Market Concentration & Innovation
The US Photonics Market exhibits a moderate level of concentration, with several key players dominating specific application niches. Innovation is a primary driver, fueled by substantial R&D investments exceeding $5 billion annually from leading companies. The regulatory framework, while supporting innovation, also introduces compliance considerations for advanced photonics technologies. Product substitutes, while emerging in certain areas like advanced sensing, have yet to fully displace the unique capabilities offered by photonics. End-user trends are overwhelmingly positive, with an increasing demand for higher bandwidth, faster processing, and more precise measurement tools. Merger and acquisition (M&A) activities are strategic, with recent deals valued in the hundreds of millions of dollars, indicating a consolidation trend among companies seeking to broaden their technology portfolios and market reach. Notable M&A activity reflects the industry's pursuit of enhanced capabilities and market share.
- Market Share Drivers: Technological advancement, intellectual property, and strategic partnerships.
- M&A Valuations: Averaging between $100 million and $500 million for significant acquisitions in recent years.
- Innovation Hubs: Concentrated in areas like Silicon Valley, Boston, and Rochester, NY.
- Regulatory Impact: FDA approvals for medical photonics, FCC regulations for communication technologies.
US Photonics Market Industry Trends & Insights
The US Photonics Market is experiencing robust growth, projected to achieve a Compound Annual Growth Rate (CAGR) of approximately 8.5% from 2025 to 2033. This expansion is fundamentally driven by the ever-increasing demand for high-speed data communication, a critical pillar for the digital economy. The proliferation of 5G networks, cloud computing, and the burgeoning Internet of Things (IoT) ecosystem necessitate advanced optical components and systems for efficient data transmission. Furthermore, the integration of photonics in advanced manufacturing processes, such as laser-based precision machining and additive manufacturing, is a significant growth catalyst. The Medical Technology segment is also witnessing a surge, with photonics playing a crucial role in diagnostics, imaging, and minimally invasive surgical procedures. Consumer preferences are leaning towards enhanced visual experiences, driving demand in the Image Capture and Display segment, including augmented and virtual reality applications. The competitive dynamics are characterized by intense R&D efforts, strategic alliances, and a keen focus on cost-effectiveness and miniaturization. Market penetration is deepening across all sectors as photonics solutions become more accessible and their benefits more widely recognized. The data communication segment alone is estimated to exceed $20 billion by 2025, underscoring its dominance. The trend towards photonics integrated circuits (PICs) is also gaining momentum, promising further integration and performance improvements.
- Data Communication Growth: Driven by data center expansion and telecom infrastructure upgrades.
- Medical Photonics Advancements: Enabling earlier disease detection and more personalized treatments.
- Manufacturing Automation: Laser processing for increased efficiency and reduced waste.
- Consumer Electronics: Higher resolution displays and advanced imaging capabilities.
- Market Penetration: Expected to reach 70% in key industrial applications by 2030.
Dominant Markets & Segments in US Photonics Market
The Data Communication segment is currently the dominant force in the US Photonics Market, driven by the insatiable global appetite for high-speed internet and massive data transfer. The infrastructure build-out for 5G networks, coupled with the expansion of hyperscale data centers, directly fuels the demand for optical transceivers, fiber optics, and related components. The projected market size for this segment alone is expected to surpass $25 billion by 2025. Economic policies supporting digital infrastructure development and investment in broadband expansion are key enablers.
- Data Communication Dominance:
- Key Drivers: 5G deployment, cloud computing growth, hyperscale data centers, e-commerce expansion.
- Infrastructure Investment: Government initiatives and private sector funding for broadband expansion.
- Technological Advancements: Development of higher bandwidth optical modules and faster switching technologies.
The Medical Technology segment represents a rapidly growing and highly impactful area within the US Photonics Market, projected to reach over $10 billion by 2025. Photonics is revolutionizing healthcare through advanced imaging techniques like optical coherence tomography (OCT), laser-based diagnostics for early disease detection, and therapeutic applications such as laser surgery and photodynamic therapy. The aging population and increasing healthcare expenditure are significant underlying factors.
- Medical Technology Growth:
- Key Drivers: Aging demographics, rising chronic disease prevalence, demand for minimally invasive procedures, personalized medicine trends.
- Diagnostic Innovation: Development of point-of-care photonics-based diagnostic devices.
- Therapeutic Applications: Advancements in laser surgery, ophthalmology, and dermatology.
The Production Technology segment, valued at over $8 billion by 2025, is another critical area, showcasing the transformative power of photonics in modern manufacturing. Laser-based systems are essential for precision welding, cutting, marking, and additive manufacturing across diverse industries, including automotive, aerospace, and electronics. Automation and efficiency gains are major selling points.
- Production Technology Expansion:
- Key Drivers: Automation in manufacturing, demand for precision engineering, Industry 4.0 adoption, materials processing advancements.
- Additive Manufacturing: Growth of 3D printing utilizing laser-based technologies.
- Materials Science: Development of new materials optimized for laser processing.
Image Capture and Display applications, while perhaps less dominant in sheer market value than data communication, are experiencing significant innovation and growth, driven by consumer electronics and emerging technologies. The market is estimated to reach around $7 billion by 2025.
- Image Capture and Display Evolution:
- Key Drivers: Augmented Reality (AR) and Virtual Reality (VR) headset development, advanced camera systems, high-resolution displays.
- Consumer Electronics: Demand for better imaging in smartphones and digital cameras.
- Automotive Applications: Advanced driver-assistance systems (ADAS) and infotainment displays.
Surveying and Detection applications, projected to be around $5 billion by 2025, leverage photonics for applications like LiDAR in autonomous vehicles and surveying equipment, environmental monitoring, and security systems.
- Surveying and Detection Advancements:
- Key Drivers: Autonomous vehicle development, smart city initiatives, environmental sensing, security and surveillance needs.
- LiDAR Technology: Integration in autonomous systems and geospatial mapping.
- Sensor Miniaturization: Development of compact and efficient optical sensors.
Lighting applications, while mature in some areas, are seeing innovation in specialized high-power and energy-efficient LED and laser lighting solutions, estimated at $4 billion by 2025.
- Lighting Innovations:
- Key Drivers: Energy efficiency mandates, smart lighting systems, specialized industrial and horticultural lighting.
- LED Technology: Continued advancements in brightness, color rendering, and lifespan.
Other Applications, encompassing areas like scientific research, defense, and entertainment, represent a diverse and growing segment, contributing an estimated $3 billion by 2025.
- Emerging Applications:
- Key Drivers: Scientific instrumentation, quantum computing, advanced research, defense technologies.
US Photonics Market Product Developments
Product development in the US Photonics Market is characterized by a relentless pursuit of higher performance, smaller form factors, and increased energy efficiency. Innovations are primarily focused on next-generation optical transceivers for faster data rates, advanced laser sources for precision manufacturing, and compact, high-resolution imaging sensors for medical and consumer applications. The competitive advantage lies in proprietary technologies, patent portfolios, and the ability to integrate complex photonic functions onto single chips. Key trends include the miniaturization of components and the development of cost-effective manufacturing processes.
Report Scope & Segmentation Analysis
This report provides a granular analysis of the US Photonics Market segmented by Application. Each application segment is analyzed for its current market size, projected growth trajectory, and competitive dynamics within the forecast period of 2025–2033. The Data Communication segment is projected to lead in terms of market share and growth, followed by Medical Technology and Production Technology. The report delves into the specific drivers and challenges within each application, offering a comprehensive understanding of their individual market potential and competitive landscape.
- Data Communication: Expected to dominate, driven by 5G and data center growth.
- Medical Technology: Significant growth due to advancements in diagnostics and therapeutics.
- Production Technology: Essential for advanced manufacturing and automation.
- Image Capture and Display: Fueled by consumer electronics and AR/VR.
- Surveying and Detection: Key for autonomous systems and sensing.
- Lighting: Driven by energy efficiency and specialized applications.
- Other Applications: Diverse growth in research and defense sectors.
Key Drivers of US Photonics Market Growth
The US Photonics Market is propelled by several interconnected growth drivers. Technological advancements are paramount, with continuous innovation in laser technology, optical fibers, and semiconductor components enabling new applications and improving existing ones. The increasing demand for high-speed data transfer, fueled by the digital transformation across industries, is a primary economic driver. Furthermore, government initiatives and funding for research and development in areas like advanced manufacturing and healthcare, coupled with favorable regulatory environments, contribute significantly to market expansion.
- Technological Innovation: Development of novel photonic devices and materials.
- Digital Transformation: Increased data generation and consumption.
- Government Investment: Funding for R&D and critical infrastructure.
- Healthcare Advancements: Growing adoption of photonics in diagnostics and treatment.
Challenges in the US Photonics Market Sector
Despite its robust growth, the US Photonics Market faces certain challenges. High R&D costs and the long development cycles for some advanced photonic technologies can be a barrier. Intense global competition, particularly from Asian manufacturers, puts pressure on pricing and market share. Supply chain disruptions and the sourcing of specialized raw materials can also pose significant hurdles. Additionally, the need for highly skilled personnel to develop, manufacture, and implement complex photonic systems presents a talent acquisition challenge.
- High R&D Investment: Requires substantial capital outlay and long-term commitment.
- Global Competition: Intense price pressure from international markets.
- Supply Chain Volatility: Dependence on specialized materials and components.
- Skilled Workforce Shortage: Demand for specialized expertise in photonics.
Emerging Opportunities in US Photonics Market
Emerging opportunities in the US Photonics Market are abundant and diverse. The burgeoning field of quantum computing presents a significant avenue for growth, requiring highly specialized photonic components. The continuous evolution of augmented and virtual reality technologies will drive demand for advanced optical displays and sensors. Furthermore, the increasing adoption of photonics in environmental monitoring, defense applications, and advanced materials science offers substantial untapped potential. The integration of photonics with artificial intelligence (AI) for enhanced data processing and analysis is another key area for future development.
- Quantum Technologies: Development of photonic systems for quantum computing.
- AR/VR Market Expansion: Demand for advanced optical components.
- Smart Sensors: Applications in IoT and environmental monitoring.
- AI Integration: Enhanced data processing and machine vision.
Leading Players in the US Photonics Market Market
- Hamamatsu Photonics KK
- Polatis Incorporated (huber+suhner)
- Molex Inc
- Infinera Corporation
- Neophotonics Corporation (lumentum Holdings)
- ams OSRAM AG
- Vescent Photonics LLC
- NEC Corporation
- Alcatel-lucent SA (Nokia Corporation)
- Photonic Systems Inc
- Coherent Inc (Coherent Corp )
- Trumpf Group
- Thorlabs Inc
- Intel Corporation
- IPG Photonics
Key Developments in US Photonics Market Industry
- June 2023: IPG Photonics, a leading fiber laser solutions provider, showcased its latest technologies and solutions for e-mobility manufacturing, materials processing, and specialized applications. IPG also introduced a breakthrough in thermal processing with its "Cold Oven" laser diode heating. This technology replaces traditional infrared bulbs and convection drying furnaces, delivering faster heating and drying processes with higher energy efficiency.
- February 2023: Hamamatsu Photonics developed an optical transceiver P16671-01AS that achieves fiber-optic communications at a data transmission speed of 1.25 Gbps (gigabits per second). The company applied its unique design technology based on opto-semiconductor manufacturing technology fostered over the years.
Strategic Outlook for US Photonics Market Market
The strategic outlook for the US Photonics Market remains exceptionally positive. The market is poised for sustained growth driven by the indispensable role of photonics in enabling critical advancements across multiple sectors, from telecommunications and healthcare to advanced manufacturing and emerging technologies like quantum computing. Continued investment in research and development, coupled with strategic collaborations and potential M&A activities, will be crucial for companies aiming to capture market share. The increasing demand for miniaturization, higher performance, and energy efficiency will shape future product roadmaps. Embracing innovation in areas like integrated photonics and AI-powered photonic solutions will be key to navigating the competitive landscape and unlocking future market potential.
US Photonics Market Segmentation
-
1. Application
- 1.1. Surveying And Detection
- 1.2. Production Technology
- 1.3. Data Communication
- 1.4. Image Capture and Display
- 1.5. Medical Technology
- 1.6. Lighting
- 1.7. Other Applications
US Photonics Market Segmentation By Geography
-
1. North America
- 1.1. United States
- 1.2. Canada
- 1.3. Mexico
-
2. South America
- 2.1. Brazil
- 2.2. Argentina
- 2.3. Rest of South America
-
3. Europe
- 3.1. United Kingdom
- 3.2. Germany
- 3.3. France
- 3.4. Italy
- 3.5. Spain
- 3.6. Russia
- 3.7. Benelux
- 3.8. Nordics
- 3.9. Rest of Europe
-
4. Middle East & Africa
- 4.1. Turkey
- 4.2. Israel
- 4.3. GCC
- 4.4. North Africa
- 4.5. South Africa
- 4.6. Rest of Middle East & Africa
-
5. Asia Pacific
- 5.1. China
- 5.2. India
- 5.3. Japan
- 5.4. South Korea
- 5.5. ASEAN
- 5.6. Oceania
- 5.7. Rest of Asia Pacific
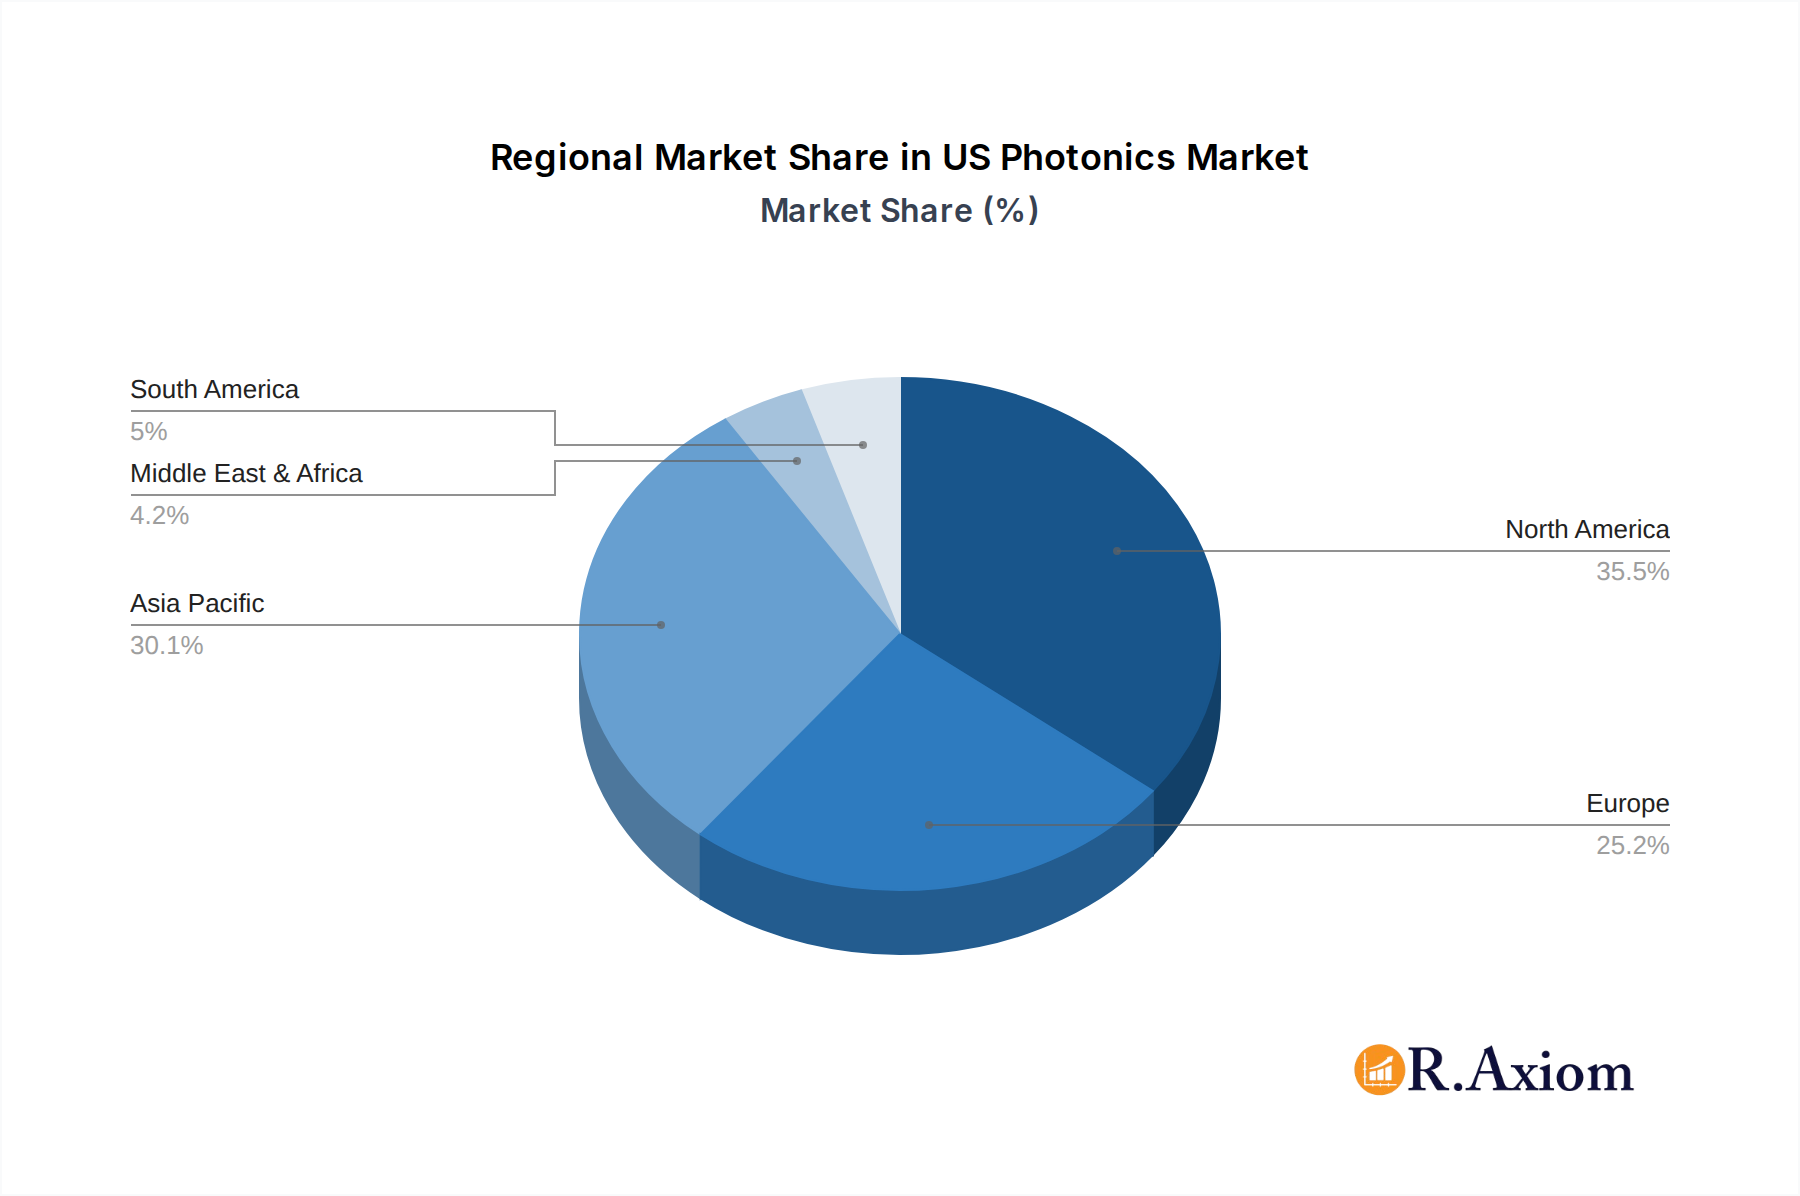
US Photonics Market Regional Market Share
Geographic Coverage of US Photonics Market
US Photonics Market REPORT HIGHLIGHTS
| Aspects | Details |
|---|---|
| Study Period | 2020-2034 |
| Base Year | 2025 |
| Estimated Year | 2026 |
| Forecast Period | 2026-2034 |
| Historical Period | 2020-2025 |
| Growth Rate | CAGR of 6.3% from 2020-2034 |
| Segmentation |
|
Table of Contents
- 1. Introduction
- 1.1. Research Scope
- 1.2. Market Segmentation
- 1.3. Research Objective
- 1.4. Definitions and Assumptions
- 2. Executive Summary
- 2.1. Market Snapshot
- 3. Market Dynamics
- 3.1. Market Drivers
- 3.2. Market Restrains
- 3.3. Market Trends
- 3.4. Market Opportunities
- 4. Market Factor Analysis
- 4.1. Porters Five Forces
- 4.1.1. Bargaining Power of Suppliers
- 4.1.2. Bargaining Power of Buyers
- 4.1.3. Threat of New Entrants
- 4.1.4. Threat of Substitutes
- 4.1.5. Competitive Rivalry
- 4.2. PESTEL analysis
- 4.3. BCG Analysis
- 4.3.1. Stars (High Growth, High Market Share)
- 4.3.2. Cash Cows (Low Growth, High Market Share)
- 4.3.3. Question Mark (High Growth, Low Market Share)
- 4.3.4. Dogs (Low Growth, Low Market Share)
- 4.4. Ansoff Matrix Analysis
- 4.5. Supply Chain Analysis
- 4.6. Regulatory Landscape
- 4.7. Current Market Potential and Opportunity Assessment (TAM–SAM–SOM Framework)
- 4.8. RAX Analyst Note
- 4.1. Porters Five Forces
- 5. Market Analysis, Insights and Forecast 2021-2033
- 5.1. Market Analysis, Insights and Forecast - by Application
- 5.1.1. Surveying And Detection
- 5.1.2. Production Technology
- 5.1.3. Data Communication
- 5.1.4. Image Capture and Display
- 5.1.5. Medical Technology
- 5.1.6. Lighting
- 5.1.7. Other Applications
- 5.2. Market Analysis, Insights and Forecast - by Region
- 5.2.1. North America
- 5.2.2. South America
- 5.2.3. Europe
- 5.2.4. Middle East & Africa
- 5.2.5. Asia Pacific
- 5.1. Market Analysis, Insights and Forecast - by Application
- 6. Global US Photonics Market Analysis, Insights and Forecast, 2021-2033
- 6.1. Market Analysis, Insights and Forecast - by Application
- 6.1.1. Surveying And Detection
- 6.1.2. Production Technology
- 6.1.3. Data Communication
- 6.1.4. Image Capture and Display
- 6.1.5. Medical Technology
- 6.1.6. Lighting
- 6.1.7. Other Applications
- 6.1. Market Analysis, Insights and Forecast - by Application
- 7. North America US Photonics Market Analysis, Insights and Forecast, 2020-2032
- 7.1. Market Analysis, Insights and Forecast - by Application
- 7.1.1. Surveying And Detection
- 7.1.2. Production Technology
- 7.1.3. Data Communication
- 7.1.4. Image Capture and Display
- 7.1.5. Medical Technology
- 7.1.6. Lighting
- 7.1.7. Other Applications
- 7.1. Market Analysis, Insights and Forecast - by Application
- 8. South America US Photonics Market Analysis, Insights and Forecast, 2020-2032
- 8.1. Market Analysis, Insights and Forecast - by Application
- 8.1.1. Surveying And Detection
- 8.1.2. Production Technology
- 8.1.3. Data Communication
- 8.1.4. Image Capture and Display
- 8.1.5. Medical Technology
- 8.1.6. Lighting
- 8.1.7. Other Applications
- 8.1. Market Analysis, Insights and Forecast - by Application
- 9. Europe US Photonics Market Analysis, Insights and Forecast, 2020-2032
- 9.1. Market Analysis, Insights and Forecast - by Application
- 9.1.1. Surveying And Detection
- 9.1.2. Production Technology
- 9.1.3. Data Communication
- 9.1.4. Image Capture and Display
- 9.1.5. Medical Technology
- 9.1.6. Lighting
- 9.1.7. Other Applications
- 9.1. Market Analysis, Insights and Forecast - by Application
- 10. Middle East & Africa US Photonics Market Analysis, Insights and Forecast, 2020-2032
- 10.1. Market Analysis, Insights and Forecast - by Application
- 10.1.1. Surveying And Detection
- 10.1.2. Production Technology
- 10.1.3. Data Communication
- 10.1.4. Image Capture and Display
- 10.1.5. Medical Technology
- 10.1.6. Lighting
- 10.1.7. Other Applications
- 10.1. Market Analysis, Insights and Forecast - by Application
- 11. Asia Pacific US Photonics Market Analysis, Insights and Forecast, 2020-2032
- 11.1. Market Analysis, Insights and Forecast - by Application
- 11.1.1. Surveying And Detection
- 11.1.2. Production Technology
- 11.1.3. Data Communication
- 11.1.4. Image Capture and Display
- 11.1.5. Medical Technology
- 11.1.6. Lighting
- 11.1.7. Other Applications
- 11.1. Market Analysis, Insights and Forecast - by Application
- 12. Competitive Analysis
- 12.1. Company Profiles
- 12.1.1 Hamamatsu Photonics KK
- 12.1.1.1. Company Overview
- 12.1.1.2. Products
- 12.1.1.3. Company Financials
- 12.1.1.4. SWOT Analysis
- 12.1.2 Polatis Incorporated (huber+suhner)
- 12.1.2.1. Company Overview
- 12.1.2.2. Products
- 12.1.2.3. Company Financials
- 12.1.2.4. SWOT Analysis
- 12.1.3 Molex Inc
- 12.1.3.1. Company Overview
- 12.1.3.2. Products
- 12.1.3.3. Company Financials
- 12.1.3.4. SWOT Analysis
- 12.1.4 Infinera Corporation
- 12.1.4.1. Company Overview
- 12.1.4.2. Products
- 12.1.4.3. Company Financials
- 12.1.4.4. SWOT Analysis
- 12.1.5 Neophotonics Corporation (lumentum Holdings)
- 12.1.5.1. Company Overview
- 12.1.5.2. Products
- 12.1.5.3. Company Financials
- 12.1.5.4. SWOT Analysis
- 12.1.6 ams OSRAM AG
- 12.1.6.1. Company Overview
- 12.1.6.2. Products
- 12.1.6.3. Company Financials
- 12.1.6.4. SWOT Analysis
- 12.1.7 Vescent Photonics LLC
- 12.1.7.1. Company Overview
- 12.1.7.2. Products
- 12.1.7.3. Company Financials
- 12.1.7.4. SWOT Analysis
- 12.1.8 NEC Corporation
- 12.1.8.1. Company Overview
- 12.1.8.2. Products
- 12.1.8.3. Company Financials
- 12.1.8.4. SWOT Analysis
- 12.1.9 Alcatel-lucent SA (Nokia Corporation)*List Not Exhaustive
- 12.1.9.1. Company Overview
- 12.1.9.2. Products
- 12.1.9.3. Company Financials
- 12.1.9.4. SWOT Analysis
- 12.1.10 Photonic Systems Inc
- 12.1.10.1. Company Overview
- 12.1.10.2. Products
- 12.1.10.3. Company Financials
- 12.1.10.4. SWOT Analysis
- 12.1.11 Coherent Inc (Coherent Corp )
- 12.1.11.1. Company Overview
- 12.1.11.2. Products
- 12.1.11.3. Company Financials
- 12.1.11.4. SWOT Analysis
- 12.1.12 Trumpf Group
- 12.1.12.1. Company Overview
- 12.1.12.2. Products
- 12.1.12.3. Company Financials
- 12.1.12.4. SWOT Analysis
- 12.1.13 Thorlabs Inc
- 12.1.13.1. Company Overview
- 12.1.13.2. Products
- 12.1.13.3. Company Financials
- 12.1.13.4. SWOT Analysis
- 12.1.14 Intel Corporation
- 12.1.14.1. Company Overview
- 12.1.14.2. Products
- 12.1.14.3. Company Financials
- 12.1.14.4. SWOT Analysis
- 12.1.15 IPG Photonics
- 12.1.15.1. Company Overview
- 12.1.15.2. Products
- 12.1.15.3. Company Financials
- 12.1.15.4. SWOT Analysis
- 12.1.1 Hamamatsu Photonics KK
- 12.2. Market Entropy
- 12.2.1 Company's Key Areas Served
- 12.2.2 Recent Developments
- 12.3. Company Market Share Analysis 2025
- 12.3.1 Top 5 Companies Market Share Analysis
- 12.3.2 Top 3 Companies Market Share Analysis
- 12.4. List of Potential Customers
- 13. Research Methodology
List of Figures
- Figure 1: Global US Photonics Market Revenue Breakdown (billion, %) by Region 2025 & 2033
- Figure 2: North America US Photonics Market Revenue (billion), by Application 2025 & 2033
- Figure 3: North America US Photonics Market Revenue Share (%), by Application 2025 & 2033
- Figure 4: North America US Photonics Market Revenue (billion), by Country 2025 & 2033
- Figure 5: North America US Photonics Market Revenue Share (%), by Country 2025 & 2033
- Figure 6: South America US Photonics Market Revenue (billion), by Application 2025 & 2033
- Figure 7: South America US Photonics Market Revenue Share (%), by Application 2025 & 2033
- Figure 8: South America US Photonics Market Revenue (billion), by Country 2025 & 2033
- Figure 9: South America US Photonics Market Revenue Share (%), by Country 2025 & 2033
- Figure 10: Europe US Photonics Market Revenue (billion), by Application 2025 & 2033
- Figure 11: Europe US Photonics Market Revenue Share (%), by Application 2025 & 2033
- Figure 12: Europe US Photonics Market Revenue (billion), by Country 2025 & 2033
- Figure 13: Europe US Photonics Market Revenue Share (%), by Country 2025 & 2033
- Figure 14: Middle East & Africa US Photonics Market Revenue (billion), by Application 2025 & 2033
- Figure 15: Middle East & Africa US Photonics Market Revenue Share (%), by Application 2025 & 2033
- Figure 16: Middle East & Africa US Photonics Market Revenue (billion), by Country 2025 & 2033
- Figure 17: Middle East & Africa US Photonics Market Revenue Share (%), by Country 2025 & 2033
- Figure 18: Asia Pacific US Photonics Market Revenue (billion), by Application 2025 & 2033
- Figure 19: Asia Pacific US Photonics Market Revenue Share (%), by Application 2025 & 2033
- Figure 20: Asia Pacific US Photonics Market Revenue (billion), by Country 2025 & 2033
- Figure 21: Asia Pacific US Photonics Market Revenue Share (%), by Country 2025 & 2033
List of Tables
- Table 1: Global US Photonics Market Revenue billion Forecast, by Application 2020 & 2033
- Table 2: Global US Photonics Market Revenue billion Forecast, by Region 2020 & 2033
- Table 3: Global US Photonics Market Revenue billion Forecast, by Application 2020 & 2033
- Table 4: Global US Photonics Market Revenue billion Forecast, by Country 2020 & 2033
- Table 5: United States US Photonics Market Revenue (billion) Forecast, by Application 2020 & 2033
- Table 6: Canada US Photonics Market Revenue (billion) Forecast, by Application 2020 & 2033
- Table 7: Mexico US Photonics Market Revenue (billion) Forecast, by Application 2020 & 2033
- Table 8: Global US Photonics Market Revenue billion Forecast, by Application 2020 & 2033
- Table 9: Global US Photonics Market Revenue billion Forecast, by Country 2020 & 2033
- Table 10: Brazil US Photonics Market Revenue (billion) Forecast, by Application 2020 & 2033
- Table 11: Argentina US Photonics Market Revenue (billion) Forecast, by Application 2020 & 2033
- Table 12: Rest of South America US Photonics Market Revenue (billion) Forecast, by Application 2020 & 2033
- Table 13: Global US Photonics Market Revenue billion Forecast, by Application 2020 & 2033
- Table 14: Global US Photonics Market Revenue billion Forecast, by Country 2020 & 2033
- Table 15: United Kingdom US Photonics Market Revenue (billion) Forecast, by Application 2020 & 2033
- Table 16: Germany US Photonics Market Revenue (billion) Forecast, by Application 2020 & 2033
- Table 17: France US Photonics Market Revenue (billion) Forecast, by Application 2020 & 2033
- Table 18: Italy US Photonics Market Revenue (billion) Forecast, by Application 2020 & 2033
- Table 19: Spain US Photonics Market Revenue (billion) Forecast, by Application 2020 & 2033
- Table 20: Russia US Photonics Market Revenue (billion) Forecast, by Application 2020 & 2033
- Table 21: Benelux US Photonics Market Revenue (billion) Forecast, by Application 2020 & 2033
- Table 22: Nordics US Photonics Market Revenue (billion) Forecast, by Application 2020 & 2033
- Table 23: Rest of Europe US Photonics Market Revenue (billion) Forecast, by Application 2020 & 2033
- Table 24: Global US Photonics Market Revenue billion Forecast, by Application 2020 & 2033
- Table 25: Global US Photonics Market Revenue billion Forecast, by Country 2020 & 2033
- Table 26: Turkey US Photonics Market Revenue (billion) Forecast, by Application 2020 & 2033
- Table 27: Israel US Photonics Market Revenue (billion) Forecast, by Application 2020 & 2033
- Table 28: GCC US Photonics Market Revenue (billion) Forecast, by Application 2020 & 2033
- Table 29: North Africa US Photonics Market Revenue (billion) Forecast, by Application 2020 & 2033
- Table 30: South Africa US Photonics Market Revenue (billion) Forecast, by Application 2020 & 2033
- Table 31: Rest of Middle East & Africa US Photonics Market Revenue (billion) Forecast, by Application 2020 & 2033
- Table 32: Global US Photonics Market Revenue billion Forecast, by Application 2020 & 2033
- Table 33: Global US Photonics Market Revenue billion Forecast, by Country 2020 & 2033
- Table 34: China US Photonics Market Revenue (billion) Forecast, by Application 2020 & 2033
- Table 35: India US Photonics Market Revenue (billion) Forecast, by Application 2020 & 2033
- Table 36: Japan US Photonics Market Revenue (billion) Forecast, by Application 2020 & 2033
- Table 37: South Korea US Photonics Market Revenue (billion) Forecast, by Application 2020 & 2033
- Table 38: ASEAN US Photonics Market Revenue (billion) Forecast, by Application 2020 & 2033
- Table 39: Oceania US Photonics Market Revenue (billion) Forecast, by Application 2020 & 2033
- Table 40: Rest of Asia Pacific US Photonics Market Revenue (billion) Forecast, by Application 2020 & 2033
Frequently Asked Questions
1. What is the projected Compound Annual Growth Rate (CAGR) of the US Photonics Market?
The projected CAGR is approximately 6.3%.
2. Which companies are prominent players in the US Photonics Market?
Key companies in the market include Hamamatsu Photonics KK, Polatis Incorporated (huber+suhner), Molex Inc, Infinera Corporation, Neophotonics Corporation (lumentum Holdings), ams OSRAM AG, Vescent Photonics LLC, NEC Corporation, Alcatel-lucent SA (Nokia Corporation)*List Not Exhaustive, Photonic Systems Inc, Coherent Inc (Coherent Corp ), Trumpf Group, Thorlabs Inc, Intel Corporation, IPG Photonics.
3. What are the main segments of the US Photonics Market?
The market segments include Application.
4. Can you provide details about the market size?
The market size is estimated to be USD 1094 billion as of 2022.
5. What are some drivers contributing to market growth?
Emergence of Silicon-based Photonics Applications; Increasing Focus on High-performance and Eco-Friendly Solutions.
6. What are the notable trends driving market growth?
Emergence of Silicon-based Photonics Applications to Drive the Market.
7. Are there any restraints impacting market growth?
High Initial Cost of Photonics - Enabled Devices.
8. Can you provide examples of recent developments in the market?
June 2023: IPG Photonics, a leading fiber laser solutions provider, showcased its latest technologies and solutions for e-mobility manufacturing, materials processing, and specialized applications. IPG also introduced a breakthrough in thermal processing with its "Cold Oven" laser diode heating. This technology replaces traditional infrared bulbs and convection drying furnaces, delivering faster heating and drying processes with higher energy efficiency.
9. What pricing options are available for accessing the report?
Pricing options include single-user, multi-user, and enterprise licenses priced at USD 3800, USD 4500, and USD 5800 respectively.
10. Is the market size provided in terms of value or volume?
The market size is provided in terms of value, measured in billion.
11. Are there any specific market keywords associated with the report?
Yes, the market keyword associated with the report is "US Photonics Market," which aids in identifying and referencing the specific market segment covered.
12. How do I determine which pricing option suits my needs best?
The pricing options vary based on user requirements and access needs. Individual users may opt for single-user licenses, while businesses requiring broader access may choose multi-user or enterprise licenses for cost-effective access to the report.
13. Are there any additional resources or data provided in the US Photonics Market report?
While the report offers comprehensive insights, it's advisable to review the specific contents or supplementary materials provided to ascertain if additional resources or data are available.
14. How can I stay updated on further developments or reports in the US Photonics Market?
To stay informed about further developments, trends, and reports in the US Photonics Market, consider subscribing to industry newsletters, following relevant companies and organizations, or regularly checking reputable industry news sources and publications.
Methodology
Step 1 - Identification of Relevant Samples Size from Population Database


Step 2 - Approaches for Defining Global Market Size (Value, Volume* & Price*)

Note*: In applicable scenarios
Step 3 - Data Sources
Primary Research
- Web Analytics
- Survey Reports
- Research Institute
- Latest Research Reports
- Opinion Leaders
Secondary Research
- Annual Reports
- White Paper
- Latest Press Release
- Industry Association
- Paid Database
- Investor Presentations

Step 4 - Data Triangulation
Involves using different sources of information in order to increase the validity of a study
These sources are likely to be stakeholders in a program - participants, other researchers, program staff, other community members, and so on.
Then we put all data in single framework & apply various statistical tools to find out the dynamic on the market.
During the analysis stage, feedback from the stakeholder groups would be compared to determine areas of agreement as well as areas of divergence