Key Insights
The US printing inks market, valued at $10.31 billion in 2025, is projected for robust expansion with a compound annual growth rate (CAGR) of 12.3% from 2025 to 2033. Key growth drivers include the escalating demand for premium packaging solutions within the food & beverage, pharmaceutical, and consumer goods sectors. The increasing adoption of sustainable packaging is propelling the use of eco-friendly water-based and UV-curable inks. Notably, segments like flexible packaging and digital printing are experiencing growth exceeding the market average, fueled by e-commerce expansion and the demand for personalized marketing. Challenges include raw material price volatility and stringent environmental regulations. The competitive landscape features established entities such as Altana, Sun Chemical, and Flint Group, alongside specialized regional players. The market's segmentation across ink types (solvent-based, water-based, UV) and printing processes (lithographic, flexographic, gravure, digital) for applications including packaging, commercial printing, and textiles offers opportunities for niche providers. Key growth regions include the Northeast and West Coast, driven by concentrated packaging and publishing industries.
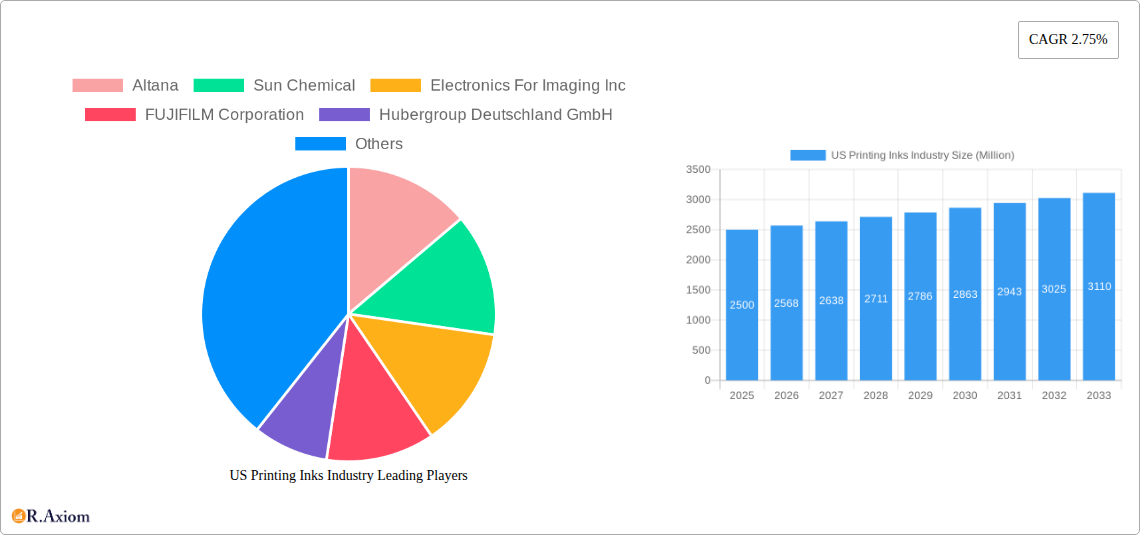
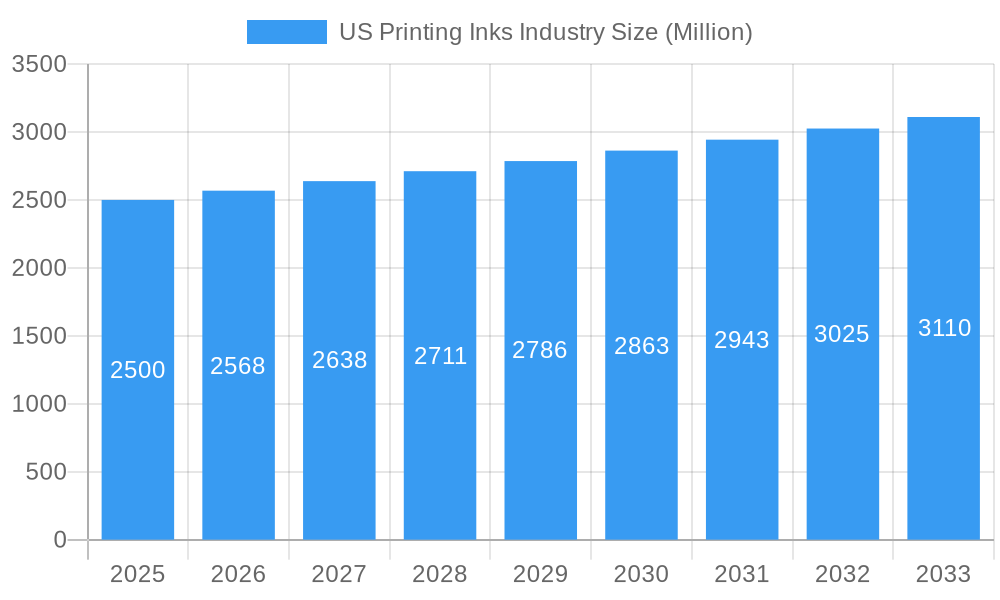
US Printing Inks Industry Market Size (In Billion)
The Northeast and West Coast regions are poised to lead the US market, owing to a high concentration of printing businesses and significant demand in packaging (rigid and flexible) and commercial printing applications. Market growth is expected to be positive yet moderate, influenced by industry-specific dynamics. The integration of advanced ink technologies, emphasizing durability and eco-friendliness, will be pivotal. Persistent competitive pressures will drive innovation in product development and cost-efficiency. The forecast period anticipates a gradual transition towards more sustainable and efficient ink technologies, aligning with consumer preferences and regulatory mandates.
US Printing Inks Industry Company Market Share
This report offers an in-depth analysis of the US printing inks industry, providing critical insights for stakeholders and industry professionals. The study period spans 2019-2033, with 2025 designated as the base and estimated year. The analysis meticulously examines market dynamics, competitive intelligence, and future growth trajectories, incorporating key performance indicators and detailed segmentations.
US Printing Inks Industry Market Concentration & Innovation
This section analyzes the market concentration, innovation drivers, regulatory landscape, product substitutes, end-user trends, and mergers & acquisitions (M&A) activities within the US printing inks industry. The market is moderately concentrated, with several major players holding significant market share. However, the presence of smaller, specialized firms contributes to innovation and competitive diversity.
Market Concentration: The top five players, including Sun Chemical, Flint Group, Siegwerk Druckfarben AG & Co KGaA, Toyo Ink SC Holdings Co Ltd, and Altana, collectively hold an estimated xx% market share (2024 data). This indicates a moderately concentrated market with opportunities for both large and small players.
Innovation Drivers: Key innovation drivers include the increasing demand for sustainable inks (water-based and UV-LED), advancements in digital printing technologies, and the need for specialized inks catering to niche applications.
Regulatory Framework: Environmental regulations concerning volatile organic compounds (VOCs) significantly impact ink formulation and manufacturing processes, driving the adoption of eco-friendly alternatives.
Product Substitutes: The emergence of digital printing technologies presents a significant challenge to traditional printing methods, although this also creates new avenues for specialized ink development.
End-User Trends: The shift towards sustainable packaging and a growing demand for high-quality printing across various applications drive innovation and market growth.
M&A Activities: The US printing inks industry has witnessed several M&A activities in recent years, with deal values ranging from xx Million to xx Million. These activities reflect consolidation trends and efforts to expand market reach and product portfolios. For example, the collaboration between Epple and Zeller+Gmelin in UV-LED ink technology highlights strategic partnerships driving innovation.
US Printing Inks Industry Industry Trends & Insights
The US printing inks market is experiencing dynamic growth, driven by a confluence of factors including technological advancements, evolving consumer preferences, and shifts in end-use applications. The market exhibits a CAGR of xx% during the forecast period (2025-2033), indicating robust growth potential.
Market growth is primarily fueled by the increasing demand for packaging inks, particularly in the food and beverage sector. The rise of e-commerce and its associated packaging needs further propels this segment's growth. Technological disruptions, such as the adoption of UV-LED and other eco-friendly ink technologies, are reshaping the industry landscape, favoring manufacturers that can adapt to these changes. Consumer preferences are also shifting towards sustainable and high-quality printing, demanding environmentally responsible inks and precision printing solutions. The competitive dynamics are intense, with established players and new entrants vying for market share through innovation, strategic partnerships, and cost optimization strategies. Market penetration of water-based inks is steadily increasing, driven by environmental concerns and stringent regulations.
Dominant Markets & Segments in US Printing Inks Industry
The packaging segment dominates the US printing inks market, accounting for approximately xx% of the total market value in 2024. Within packaging, rigid packaging (paperboard containers, corrugated boxes, etc.) holds a larger share compared to other packaging types (commercial print, textiles, etc.). The flexographic printing process is also a dominant force, accounting for a significant portion of ink consumption. The geographic distribution shows a higher concentration in regions with strong manufacturing and packaging industries.
Key Drivers:
- Strong Economic Growth: Economic expansion fuels demand across various end-use sectors, especially packaging.
- Developed Infrastructure: A robust infrastructure supports efficient manufacturing and distribution networks.
- Favorable Regulatory Environment: While strict environmental regulations exist, they also promote innovation in sustainable ink technologies.
Dominance Analysis: The dominance of packaging inks is attributed to the large-scale production of consumer goods and the ever-increasing demand for attractive, durable packaging. Flexographic printing remains a key process due to its cost-effectiveness and suitability for high-volume printing on flexible substrates.
US Printing Inks Industry Product Developments
Recent product innovations focus on environmentally friendly inks, such as UV-LED and water-based formulations, driven by growing environmental concerns and stringent regulations. These inks offer reduced VOC emissions and enhanced performance characteristics, providing a competitive advantage in the market. Applications are diversifying to include specialized inks for digital printing, food packaging, and high-value textiles.
Report Scope & Segmentation Analysis
This report offers a comprehensive segmentation analysis of the US printing inks market across various parameters:
By Type: Solvent-based, Water-based, Oil-based, UV, UV-LED, Other Types. Water-based inks are experiencing faster growth due to environmental regulations.
By Process: Lithographic Printing, Flexographic Printing, Gravure Printing, Digital Printing, Other Processes. Flexographic printing holds the largest market share.
By Application: Packaging (Rigid Packaging, Other Packaging), Commercial and Publication Printing, Textiles, Other Applications. Packaging is the dominant application segment. Growth projections vary across segments, with water-based and UV-LED inks experiencing faster growth compared to traditional solvent-based inks.
Key Drivers of US Printing Inks Industry Growth
The growth of the US printing inks market is propelled by several key factors: The increasing demand for high-quality packaging, particularly in the food and beverage and e-commerce sectors, is a significant driver. Technological advancements in ink formulations (UV-LED, water-based) are enhancing print quality and reducing environmental impact. Economic growth, coupled with a robust manufacturing base, further contributes to the market expansion.
Challenges in the US Printing Inks Industry Sector
The US printing inks industry faces challenges including stringent environmental regulations impacting production costs and formulation, fluctuating raw material prices leading to unpredictable cost increases, and intense competition from both domestic and international players. Supply chain disruptions can also cause significant delays and cost fluctuations.
Emerging Opportunities in US Printing Inks Industry
Emerging opportunities include the growing demand for sustainable and eco-friendly inks, the expansion of digital printing technologies creating specialized ink requirements, and the increasing use of inks in niche applications like 3D printing and textiles. The development of new, high-performance inks for specific applications presents significant market potential.
Leading Players in the US Printing Inks Industry Market
- Altana
- Sun Chemical
- Electronics For Imaging Inc
- FUJIFILM Corporation
- Hubergroup Deutschland GmbH
- Sicpa Holding SA
- T&K TOKA Corporation
- DuPont
- Dow
- Dainichiseika Color & Chemicals Mfg Co Ltd
- Siegwerk Druckfarben AG & Co KGaA
- Tokyo Printing Ink Mfg Co Ltd
- Sakata Inx Corporation
- Zeller+Gmelin
- Wikoff Color Corporation
- Flint Group
- Toyo Ink SC Holdings Co Ltd
Key Developments in US Printing Inks Industry Industry
- May 2021: Epple Druckfarben AG and Zeller+Gmelin GmbH & Co. KG partnered to develop a UV-LED ink for sheetfed offset printing, marketed under the LightStar brand. This collaboration highlights the increasing focus on sustainable and high-performance ink technologies.
Strategic Outlook for US Printing Inks Industry Market
The US printing inks market exhibits strong growth potential driven by expanding applications in packaging, advancements in ink technology, and increased demand for sustainable solutions. Opportunities lie in developing specialized inks for emerging markets like 3D printing and sustainable packaging. Continued innovation, strategic partnerships, and a focus on environmental sustainability will be crucial for success in this dynamic market.
US Printing Inks Industry Segmentation
-
1. Type
- 1.1. Solvent-based
- 1.2. Water-based
- 1.3. Oil-based
- 1.4. UV
- 1.5. UV-LED
- 1.6. Other Types
-
2. Process
- 2.1. Lithographic Printing
- 2.2. Flexographic Printing
- 2.3. Gravure Printing
- 2.4. Digital Printing
- 2.5. Other Processes
-
3. Application
-
3.1. Packaging
-
3.1.1. Rigid Packaging
- 3.1.1.1. Paperboard Containers
- 3.1.1.2. Corrugated Boxes
- 3.1.1.3. Rigid Plastic Containers
- 3.1.1.4. Metal Cans
- 3.1.1.5. Other Rigid Packaging
- 3.1.2. Flexible Packaging
- 3.1.3. Labels
- 3.1.4. Other Packaging
-
3.1.1. Rigid Packaging
- 3.2. Commercial and Publication
- 3.3. Textiles
- 3.4. Other Applications
-
3.1. Packaging
US Printing Inks Industry Segmentation By Geography
-
1. North America
- 1.1. United States
- 1.2. Canada
- 1.3. Mexico
-
2. South America
- 2.1. Brazil
- 2.2. Argentina
- 2.3. Rest of South America
-
3. Europe
- 3.1. United Kingdom
- 3.2. Germany
- 3.3. France
- 3.4. Italy
- 3.5. Spain
- 3.6. Russia
- 3.7. Benelux
- 3.8. Nordics
- 3.9. Rest of Europe
-
4. Middle East & Africa
- 4.1. Turkey
- 4.2. Israel
- 4.3. GCC
- 4.4. North Africa
- 4.5. South Africa
- 4.6. Rest of Middle East & Africa
-
5. Asia Pacific
- 5.1. China
- 5.2. India
- 5.3. Japan
- 5.4. South Korea
- 5.5. ASEAN
- 5.6. Oceania
- 5.7. Rest of Asia Pacific
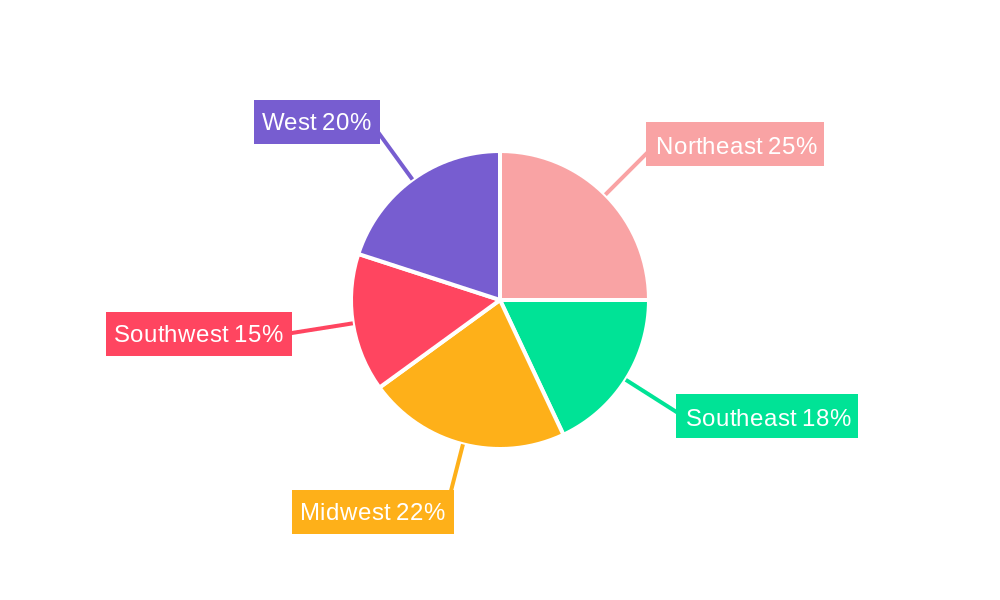
US Printing Inks Industry Regional Market Share
Geographic Coverage of US Printing Inks Industry
US Printing Inks Industry REPORT HIGHLIGHTS
| Aspects | Details |
|---|---|
| Study Period | 2020-2034 |
| Base Year | 2025 |
| Estimated Year | 2026 |
| Forecast Period | 2026-2034 |
| Historical Period | 2020-2025 |
| Growth Rate | CAGR of 12.3% from 2020-2034 |
| Segmentation |
|
Table of Contents
- 1. Introduction
- 1.1. Research Scope
- 1.2. Market Segmentation
- 1.3. Research Objective
- 1.4. Definitions and Assumptions
- 2. Executive Summary
- 2.1. Market Snapshot
- 3. Market Dynamics
- 3.1. Market Drivers
- 3.2. Market Restrains
- 3.3. Market Trends
- 3.4. Market Opportunities
- 4. Market Factor Analysis
- 4.1. Porters Five Forces
- 4.1.1. Bargaining Power of Suppliers
- 4.1.2. Bargaining Power of Buyers
- 4.1.3. Threat of New Entrants
- 4.1.4. Threat of Substitutes
- 4.1.5. Competitive Rivalry
- 4.2. PESTEL analysis
- 4.3. BCG Analysis
- 4.3.1. Stars (High Growth, High Market Share)
- 4.3.2. Cash Cows (Low Growth, High Market Share)
- 4.3.3. Question Mark (High Growth, Low Market Share)
- 4.3.4. Dogs (Low Growth, Low Market Share)
- 4.4. Ansoff Matrix Analysis
- 4.5. Supply Chain Analysis
- 4.6. Regulatory Landscape
- 4.7. Current Market Potential and Opportunity Assessment (TAM–SAM–SOM Framework)
- 4.8. RAX Analyst Note
- 4.1. Porters Five Forces
- 5. Market Analysis, Insights and Forecast 2021-2033
- 5.1. Market Analysis, Insights and Forecast - by Type
- 5.1.1. Solvent-based
- 5.1.2. Water-based
- 5.1.3. Oil-based
- 5.1.4. UV
- 5.1.5. UV-LED
- 5.1.6. Other Types
- 5.2. Market Analysis, Insights and Forecast - by Process
- 5.2.1. Lithographic Printing
- 5.2.2. Flexographic Printing
- 5.2.3. Gravure Printing
- 5.2.4. Digital Printing
- 5.2.5. Other Processes
- 5.3. Market Analysis, Insights and Forecast - by Application
- 5.3.1. Packaging
- 5.3.1.1. Rigid Packaging
- 5.3.1.1.1. Paperboard Containers
- 5.3.1.1.2. Corrugated Boxes
- 5.3.1.1.3. Rigid Plastic Containers
- 5.3.1.1.4. Metal Cans
- 5.3.1.1.5. Other Rigid Packaging
- 5.3.1.2. Flexible Packaging
- 5.3.1.3. Labels
- 5.3.1.4. Other Packaging
- 5.3.1.1. Rigid Packaging
- 5.3.2. Commercial and Publication
- 5.3.3. Textiles
- 5.3.4. Other Applications
- 5.3.1. Packaging
- 5.4. Market Analysis, Insights and Forecast - by Region
- 5.4.1. North America
- 5.4.2. South America
- 5.4.3. Europe
- 5.4.4. Middle East & Africa
- 5.4.5. Asia Pacific
- 5.1. Market Analysis, Insights and Forecast - by Type
- 6. Global US Printing Inks Industry Analysis, Insights and Forecast, 2021-2033
- 6.1. Market Analysis, Insights and Forecast - by Type
- 6.1.1. Solvent-based
- 6.1.2. Water-based
- 6.1.3. Oil-based
- 6.1.4. UV
- 6.1.5. UV-LED
- 6.1.6. Other Types
- 6.2. Market Analysis, Insights and Forecast - by Process
- 6.2.1. Lithographic Printing
- 6.2.2. Flexographic Printing
- 6.2.3. Gravure Printing
- 6.2.4. Digital Printing
- 6.2.5. Other Processes
- 6.3. Market Analysis, Insights and Forecast - by Application
- 6.3.1. Packaging
- 6.3.1.1. Rigid Packaging
- 6.3.1.1.1. Paperboard Containers
- 6.3.1.1.2. Corrugated Boxes
- 6.3.1.1.3. Rigid Plastic Containers
- 6.3.1.1.4. Metal Cans
- 6.3.1.1.5. Other Rigid Packaging
- 6.3.1.2. Flexible Packaging
- 6.3.1.3. Labels
- 6.3.1.4. Other Packaging
- 6.3.1.1. Rigid Packaging
- 6.3.2. Commercial and Publication
- 6.3.3. Textiles
- 6.3.4. Other Applications
- 6.3.1. Packaging
- 6.1. Market Analysis, Insights and Forecast - by Type
- 7. North America US Printing Inks Industry Analysis, Insights and Forecast, 2020-2032
- 7.1. Market Analysis, Insights and Forecast - by Type
- 7.1.1. Solvent-based
- 7.1.2. Water-based
- 7.1.3. Oil-based
- 7.1.4. UV
- 7.1.5. UV-LED
- 7.1.6. Other Types
- 7.2. Market Analysis, Insights and Forecast - by Process
- 7.2.1. Lithographic Printing
- 7.2.2. Flexographic Printing
- 7.2.3. Gravure Printing
- 7.2.4. Digital Printing
- 7.2.5. Other Processes
- 7.3. Market Analysis, Insights and Forecast - by Application
- 7.3.1. Packaging
- 7.3.1.1. Rigid Packaging
- 7.3.1.1.1. Paperboard Containers
- 7.3.1.1.2. Corrugated Boxes
- 7.3.1.1.3. Rigid Plastic Containers
- 7.3.1.1.4. Metal Cans
- 7.3.1.1.5. Other Rigid Packaging
- 7.3.1.2. Flexible Packaging
- 7.3.1.3. Labels
- 7.3.1.4. Other Packaging
- 7.3.1.1. Rigid Packaging
- 7.3.2. Commercial and Publication
- 7.3.3. Textiles
- 7.3.4. Other Applications
- 7.3.1. Packaging
- 7.1. Market Analysis, Insights and Forecast - by Type
- 8. South America US Printing Inks Industry Analysis, Insights and Forecast, 2020-2032
- 8.1. Market Analysis, Insights and Forecast - by Type
- 8.1.1. Solvent-based
- 8.1.2. Water-based
- 8.1.3. Oil-based
- 8.1.4. UV
- 8.1.5. UV-LED
- 8.1.6. Other Types
- 8.2. Market Analysis, Insights and Forecast - by Process
- 8.2.1. Lithographic Printing
- 8.2.2. Flexographic Printing
- 8.2.3. Gravure Printing
- 8.2.4. Digital Printing
- 8.2.5. Other Processes
- 8.3. Market Analysis, Insights and Forecast - by Application
- 8.3.1. Packaging
- 8.3.1.1. Rigid Packaging
- 8.3.1.1.1. Paperboard Containers
- 8.3.1.1.2. Corrugated Boxes
- 8.3.1.1.3. Rigid Plastic Containers
- 8.3.1.1.4. Metal Cans
- 8.3.1.1.5. Other Rigid Packaging
- 8.3.1.2. Flexible Packaging
- 8.3.1.3. Labels
- 8.3.1.4. Other Packaging
- 8.3.1.1. Rigid Packaging
- 8.3.2. Commercial and Publication
- 8.3.3. Textiles
- 8.3.4. Other Applications
- 8.3.1. Packaging
- 8.1. Market Analysis, Insights and Forecast - by Type
- 9. Europe US Printing Inks Industry Analysis, Insights and Forecast, 2020-2032
- 9.1. Market Analysis, Insights and Forecast - by Type
- 9.1.1. Solvent-based
- 9.1.2. Water-based
- 9.1.3. Oil-based
- 9.1.4. UV
- 9.1.5. UV-LED
- 9.1.6. Other Types
- 9.2. Market Analysis, Insights and Forecast - by Process
- 9.2.1. Lithographic Printing
- 9.2.2. Flexographic Printing
- 9.2.3. Gravure Printing
- 9.2.4. Digital Printing
- 9.2.5. Other Processes
- 9.3. Market Analysis, Insights and Forecast - by Application
- 9.3.1. Packaging
- 9.3.1.1. Rigid Packaging
- 9.3.1.1.1. Paperboard Containers
- 9.3.1.1.2. Corrugated Boxes
- 9.3.1.1.3. Rigid Plastic Containers
- 9.3.1.1.4. Metal Cans
- 9.3.1.1.5. Other Rigid Packaging
- 9.3.1.2. Flexible Packaging
- 9.3.1.3. Labels
- 9.3.1.4. Other Packaging
- 9.3.1.1. Rigid Packaging
- 9.3.2. Commercial and Publication
- 9.3.3. Textiles
- 9.3.4. Other Applications
- 9.3.1. Packaging
- 9.1. Market Analysis, Insights and Forecast - by Type
- 10. Middle East & Africa US Printing Inks Industry Analysis, Insights and Forecast, 2020-2032
- 10.1. Market Analysis, Insights and Forecast - by Type
- 10.1.1. Solvent-based
- 10.1.2. Water-based
- 10.1.3. Oil-based
- 10.1.4. UV
- 10.1.5. UV-LED
- 10.1.6. Other Types
- 10.2. Market Analysis, Insights and Forecast - by Process
- 10.2.1. Lithographic Printing
- 10.2.2. Flexographic Printing
- 10.2.3. Gravure Printing
- 10.2.4. Digital Printing
- 10.2.5. Other Processes
- 10.3. Market Analysis, Insights and Forecast - by Application
- 10.3.1. Packaging
- 10.3.1.1. Rigid Packaging
- 10.3.1.1.1. Paperboard Containers
- 10.3.1.1.2. Corrugated Boxes
- 10.3.1.1.3. Rigid Plastic Containers
- 10.3.1.1.4. Metal Cans
- 10.3.1.1.5. Other Rigid Packaging
- 10.3.1.2. Flexible Packaging
- 10.3.1.3. Labels
- 10.3.1.4. Other Packaging
- 10.3.1.1. Rigid Packaging
- 10.3.2. Commercial and Publication
- 10.3.3. Textiles
- 10.3.4. Other Applications
- 10.3.1. Packaging
- 10.1. Market Analysis, Insights and Forecast - by Type
- 11. Asia Pacific US Printing Inks Industry Analysis, Insights and Forecast, 2020-2032
- 11.1. Market Analysis, Insights and Forecast - by Type
- 11.1.1. Solvent-based
- 11.1.2. Water-based
- 11.1.3. Oil-based
- 11.1.4. UV
- 11.1.5. UV-LED
- 11.1.6. Other Types
- 11.2. Market Analysis, Insights and Forecast - by Process
- 11.2.1. Lithographic Printing
- 11.2.2. Flexographic Printing
- 11.2.3. Gravure Printing
- 11.2.4. Digital Printing
- 11.2.5. Other Processes
- 11.3. Market Analysis, Insights and Forecast - by Application
- 11.3.1. Packaging
- 11.3.1.1. Rigid Packaging
- 11.3.1.1.1. Paperboard Containers
- 11.3.1.1.2. Corrugated Boxes
- 11.3.1.1.3. Rigid Plastic Containers
- 11.3.1.1.4. Metal Cans
- 11.3.1.1.5. Other Rigid Packaging
- 11.3.1.2. Flexible Packaging
- 11.3.1.3. Labels
- 11.3.1.4. Other Packaging
- 11.3.1.1. Rigid Packaging
- 11.3.2. Commercial and Publication
- 11.3.3. Textiles
- 11.3.4. Other Applications
- 11.3.1. Packaging
- 11.1. Market Analysis, Insights and Forecast - by Type
- 12. Competitive Analysis
- 12.1. Company Profiles
- 12.1.1 Altana
- 12.1.1.1. Company Overview
- 12.1.1.2. Products
- 12.1.1.3. Company Financials
- 12.1.1.4. SWOT Analysis
- 12.1.2 Sun Chemical
- 12.1.2.1. Company Overview
- 12.1.2.2. Products
- 12.1.2.3. Company Financials
- 12.1.2.4. SWOT Analysis
- 12.1.3 Electronics For Imaging Inc
- 12.1.3.1. Company Overview
- 12.1.3.2. Products
- 12.1.3.3. Company Financials
- 12.1.3.4. SWOT Analysis
- 12.1.4 FUJIFILM Corporation
- 12.1.4.1. Company Overview
- 12.1.4.2. Products
- 12.1.4.3. Company Financials
- 12.1.4.4. SWOT Analysis
- 12.1.5 Hubergroup Deutschland GmbH
- 12.1.5.1. Company Overview
- 12.1.5.2. Products
- 12.1.5.3. Company Financials
- 12.1.5.4. SWOT Analysis
- 12.1.6 Sicpa Holding SA
- 12.1.6.1. Company Overview
- 12.1.6.2. Products
- 12.1.6.3. Company Financials
- 12.1.6.4. SWOT Analysis
- 12.1.7 T&K TOKA Corporation
- 12.1.7.1. Company Overview
- 12.1.7.2. Products
- 12.1.7.3. Company Financials
- 12.1.7.4. SWOT Analysis
- 12.1.8 DuPont
- 12.1.8.1. Company Overview
- 12.1.8.2. Products
- 12.1.8.3. Company Financials
- 12.1.8.4. SWOT Analysis
- 12.1.9 Dow
- 12.1.9.1. Company Overview
- 12.1.9.2. Products
- 12.1.9.3. Company Financials
- 12.1.9.4. SWOT Analysis
- 12.1.10 Dainichiseika Color & Chemicals Mfg Co Ltd
- 12.1.10.1. Company Overview
- 12.1.10.2. Products
- 12.1.10.3. Company Financials
- 12.1.10.4. SWOT Analysis
- 12.1.11 Siegwerk Druckfarben AG & Co KGaA
- 12.1.11.1. Company Overview
- 12.1.11.2. Products
- 12.1.11.3. Company Financials
- 12.1.11.4. SWOT Analysis
- 12.1.12 Tokyo Printing Ink Mfg Co Ltd
- 12.1.12.1. Company Overview
- 12.1.12.2. Products
- 12.1.12.3. Company Financials
- 12.1.12.4. SWOT Analysis
- 12.1.13 Sakata Inx Corporation
- 12.1.13.1. Company Overview
- 12.1.13.2. Products
- 12.1.13.3. Company Financials
- 12.1.13.4. SWOT Analysis
- 12.1.14 Zeller+Gmelin
- 12.1.14.1. Company Overview
- 12.1.14.2. Products
- 12.1.14.3. Company Financials
- 12.1.14.4. SWOT Analysis
- 12.1.15 Wikoff Color Corporation
- 12.1.15.1. Company Overview
- 12.1.15.2. Products
- 12.1.15.3. Company Financials
- 12.1.15.4. SWOT Analysis
- 12.1.16 Flint Group
- 12.1.16.1. Company Overview
- 12.1.16.2. Products
- 12.1.16.3. Company Financials
- 12.1.16.4. SWOT Analysis
- 12.1.17 Toyo Ink SC Holdings Co Ltd
- 12.1.17.1. Company Overview
- 12.1.17.2. Products
- 12.1.17.3. Company Financials
- 12.1.17.4. SWOT Analysis
- 12.1.1 Altana
- 12.2. Market Entropy
- 12.2.1 Company's Key Areas Served
- 12.2.2 Recent Developments
- 12.3. Company Market Share Analysis 2025
- 12.3.1 Top 5 Companies Market Share Analysis
- 12.3.2 Top 3 Companies Market Share Analysis
- 12.4. List of Potential Customers
- 13. Research Methodology
List of Figures
- Figure 1: Global US Printing Inks Industry Revenue Breakdown (billion, %) by Region 2025 & 2033
- Figure 2: Global US Printing Inks Industry Volume Breakdown (K Tons, %) by Region 2025 & 2033
- Figure 3: North America US Printing Inks Industry Revenue (billion), by Type 2025 & 2033
- Figure 4: North America US Printing Inks Industry Volume (K Tons), by Type 2025 & 2033
- Figure 5: North America US Printing Inks Industry Revenue Share (%), by Type 2025 & 2033
- Figure 6: North America US Printing Inks Industry Volume Share (%), by Type 2025 & 2033
- Figure 7: North America US Printing Inks Industry Revenue (billion), by Process 2025 & 2033
- Figure 8: North America US Printing Inks Industry Volume (K Tons), by Process 2025 & 2033
- Figure 9: North America US Printing Inks Industry Revenue Share (%), by Process 2025 & 2033
- Figure 10: North America US Printing Inks Industry Volume Share (%), by Process 2025 & 2033
- Figure 11: North America US Printing Inks Industry Revenue (billion), by Application 2025 & 2033
- Figure 12: North America US Printing Inks Industry Volume (K Tons), by Application 2025 & 2033
- Figure 13: North America US Printing Inks Industry Revenue Share (%), by Application 2025 & 2033
- Figure 14: North America US Printing Inks Industry Volume Share (%), by Application 2025 & 2033
- Figure 15: North America US Printing Inks Industry Revenue (billion), by Country 2025 & 2033
- Figure 16: North America US Printing Inks Industry Volume (K Tons), by Country 2025 & 2033
- Figure 17: North America US Printing Inks Industry Revenue Share (%), by Country 2025 & 2033
- Figure 18: North America US Printing Inks Industry Volume Share (%), by Country 2025 & 2033
- Figure 19: South America US Printing Inks Industry Revenue (billion), by Type 2025 & 2033
- Figure 20: South America US Printing Inks Industry Volume (K Tons), by Type 2025 & 2033
- Figure 21: South America US Printing Inks Industry Revenue Share (%), by Type 2025 & 2033
- Figure 22: South America US Printing Inks Industry Volume Share (%), by Type 2025 & 2033
- Figure 23: South America US Printing Inks Industry Revenue (billion), by Process 2025 & 2033
- Figure 24: South America US Printing Inks Industry Volume (K Tons), by Process 2025 & 2033
- Figure 25: South America US Printing Inks Industry Revenue Share (%), by Process 2025 & 2033
- Figure 26: South America US Printing Inks Industry Volume Share (%), by Process 2025 & 2033
- Figure 27: South America US Printing Inks Industry Revenue (billion), by Application 2025 & 2033
- Figure 28: South America US Printing Inks Industry Volume (K Tons), by Application 2025 & 2033
- Figure 29: South America US Printing Inks Industry Revenue Share (%), by Application 2025 & 2033
- Figure 30: South America US Printing Inks Industry Volume Share (%), by Application 2025 & 2033
- Figure 31: South America US Printing Inks Industry Revenue (billion), by Country 2025 & 2033
- Figure 32: South America US Printing Inks Industry Volume (K Tons), by Country 2025 & 2033
- Figure 33: South America US Printing Inks Industry Revenue Share (%), by Country 2025 & 2033
- Figure 34: South America US Printing Inks Industry Volume Share (%), by Country 2025 & 2033
- Figure 35: Europe US Printing Inks Industry Revenue (billion), by Type 2025 & 2033
- Figure 36: Europe US Printing Inks Industry Volume (K Tons), by Type 2025 & 2033
- Figure 37: Europe US Printing Inks Industry Revenue Share (%), by Type 2025 & 2033
- Figure 38: Europe US Printing Inks Industry Volume Share (%), by Type 2025 & 2033
- Figure 39: Europe US Printing Inks Industry Revenue (billion), by Process 2025 & 2033
- Figure 40: Europe US Printing Inks Industry Volume (K Tons), by Process 2025 & 2033
- Figure 41: Europe US Printing Inks Industry Revenue Share (%), by Process 2025 & 2033
- Figure 42: Europe US Printing Inks Industry Volume Share (%), by Process 2025 & 2033
- Figure 43: Europe US Printing Inks Industry Revenue (billion), by Application 2025 & 2033
- Figure 44: Europe US Printing Inks Industry Volume (K Tons), by Application 2025 & 2033
- Figure 45: Europe US Printing Inks Industry Revenue Share (%), by Application 2025 & 2033
- Figure 46: Europe US Printing Inks Industry Volume Share (%), by Application 2025 & 2033
- Figure 47: Europe US Printing Inks Industry Revenue (billion), by Country 2025 & 2033
- Figure 48: Europe US Printing Inks Industry Volume (K Tons), by Country 2025 & 2033
- Figure 49: Europe US Printing Inks Industry Revenue Share (%), by Country 2025 & 2033
- Figure 50: Europe US Printing Inks Industry Volume Share (%), by Country 2025 & 2033
- Figure 51: Middle East & Africa US Printing Inks Industry Revenue (billion), by Type 2025 & 2033
- Figure 52: Middle East & Africa US Printing Inks Industry Volume (K Tons), by Type 2025 & 2033
- Figure 53: Middle East & Africa US Printing Inks Industry Revenue Share (%), by Type 2025 & 2033
- Figure 54: Middle East & Africa US Printing Inks Industry Volume Share (%), by Type 2025 & 2033
- Figure 55: Middle East & Africa US Printing Inks Industry Revenue (billion), by Process 2025 & 2033
- Figure 56: Middle East & Africa US Printing Inks Industry Volume (K Tons), by Process 2025 & 2033
- Figure 57: Middle East & Africa US Printing Inks Industry Revenue Share (%), by Process 2025 & 2033
- Figure 58: Middle East & Africa US Printing Inks Industry Volume Share (%), by Process 2025 & 2033
- Figure 59: Middle East & Africa US Printing Inks Industry Revenue (billion), by Application 2025 & 2033
- Figure 60: Middle East & Africa US Printing Inks Industry Volume (K Tons), by Application 2025 & 2033
- Figure 61: Middle East & Africa US Printing Inks Industry Revenue Share (%), by Application 2025 & 2033
- Figure 62: Middle East & Africa US Printing Inks Industry Volume Share (%), by Application 2025 & 2033
- Figure 63: Middle East & Africa US Printing Inks Industry Revenue (billion), by Country 2025 & 2033
- Figure 64: Middle East & Africa US Printing Inks Industry Volume (K Tons), by Country 2025 & 2033
- Figure 65: Middle East & Africa US Printing Inks Industry Revenue Share (%), by Country 2025 & 2033
- Figure 66: Middle East & Africa US Printing Inks Industry Volume Share (%), by Country 2025 & 2033
- Figure 67: Asia Pacific US Printing Inks Industry Revenue (billion), by Type 2025 & 2033
- Figure 68: Asia Pacific US Printing Inks Industry Volume (K Tons), by Type 2025 & 2033
- Figure 69: Asia Pacific US Printing Inks Industry Revenue Share (%), by Type 2025 & 2033
- Figure 70: Asia Pacific US Printing Inks Industry Volume Share (%), by Type 2025 & 2033
- Figure 71: Asia Pacific US Printing Inks Industry Revenue (billion), by Process 2025 & 2033
- Figure 72: Asia Pacific US Printing Inks Industry Volume (K Tons), by Process 2025 & 2033
- Figure 73: Asia Pacific US Printing Inks Industry Revenue Share (%), by Process 2025 & 2033
- Figure 74: Asia Pacific US Printing Inks Industry Volume Share (%), by Process 2025 & 2033
- Figure 75: Asia Pacific US Printing Inks Industry Revenue (billion), by Application 2025 & 2033
- Figure 76: Asia Pacific US Printing Inks Industry Volume (K Tons), by Application 2025 & 2033
- Figure 77: Asia Pacific US Printing Inks Industry Revenue Share (%), by Application 2025 & 2033
- Figure 78: Asia Pacific US Printing Inks Industry Volume Share (%), by Application 2025 & 2033
- Figure 79: Asia Pacific US Printing Inks Industry Revenue (billion), by Country 2025 & 2033
- Figure 80: Asia Pacific US Printing Inks Industry Volume (K Tons), by Country 2025 & 2033
- Figure 81: Asia Pacific US Printing Inks Industry Revenue Share (%), by Country 2025 & 2033
- Figure 82: Asia Pacific US Printing Inks Industry Volume Share (%), by Country 2025 & 2033
List of Tables
- Table 1: Global US Printing Inks Industry Revenue billion Forecast, by Type 2020 & 2033
- Table 2: Global US Printing Inks Industry Volume K Tons Forecast, by Type 2020 & 2033
- Table 3: Global US Printing Inks Industry Revenue billion Forecast, by Process 2020 & 2033
- Table 4: Global US Printing Inks Industry Volume K Tons Forecast, by Process 2020 & 2033
- Table 5: Global US Printing Inks Industry Revenue billion Forecast, by Application 2020 & 2033
- Table 6: Global US Printing Inks Industry Volume K Tons Forecast, by Application 2020 & 2033
- Table 7: Global US Printing Inks Industry Revenue billion Forecast, by Region 2020 & 2033
- Table 8: Global US Printing Inks Industry Volume K Tons Forecast, by Region 2020 & 2033
- Table 9: Global US Printing Inks Industry Revenue billion Forecast, by Type 2020 & 2033
- Table 10: Global US Printing Inks Industry Volume K Tons Forecast, by Type 2020 & 2033
- Table 11: Global US Printing Inks Industry Revenue billion Forecast, by Process 2020 & 2033
- Table 12: Global US Printing Inks Industry Volume K Tons Forecast, by Process 2020 & 2033
- Table 13: Global US Printing Inks Industry Revenue billion Forecast, by Application 2020 & 2033
- Table 14: Global US Printing Inks Industry Volume K Tons Forecast, by Application 2020 & 2033
- Table 15: Global US Printing Inks Industry Revenue billion Forecast, by Country 2020 & 2033
- Table 16: Global US Printing Inks Industry Volume K Tons Forecast, by Country 2020 & 2033
- Table 17: United States US Printing Inks Industry Revenue (billion) Forecast, by Application 2020 & 2033
- Table 18: United States US Printing Inks Industry Volume (K Tons) Forecast, by Application 2020 & 2033
- Table 19: Canada US Printing Inks Industry Revenue (billion) Forecast, by Application 2020 & 2033
- Table 20: Canada US Printing Inks Industry Volume (K Tons) Forecast, by Application 2020 & 2033
- Table 21: Mexico US Printing Inks Industry Revenue (billion) Forecast, by Application 2020 & 2033
- Table 22: Mexico US Printing Inks Industry Volume (K Tons) Forecast, by Application 2020 & 2033
- Table 23: Global US Printing Inks Industry Revenue billion Forecast, by Type 2020 & 2033
- Table 24: Global US Printing Inks Industry Volume K Tons Forecast, by Type 2020 & 2033
- Table 25: Global US Printing Inks Industry Revenue billion Forecast, by Process 2020 & 2033
- Table 26: Global US Printing Inks Industry Volume K Tons Forecast, by Process 2020 & 2033
- Table 27: Global US Printing Inks Industry Revenue billion Forecast, by Application 2020 & 2033
- Table 28: Global US Printing Inks Industry Volume K Tons Forecast, by Application 2020 & 2033
- Table 29: Global US Printing Inks Industry Revenue billion Forecast, by Country 2020 & 2033
- Table 30: Global US Printing Inks Industry Volume K Tons Forecast, by Country 2020 & 2033
- Table 31: Brazil US Printing Inks Industry Revenue (billion) Forecast, by Application 2020 & 2033
- Table 32: Brazil US Printing Inks Industry Volume (K Tons) Forecast, by Application 2020 & 2033
- Table 33: Argentina US Printing Inks Industry Revenue (billion) Forecast, by Application 2020 & 2033
- Table 34: Argentina US Printing Inks Industry Volume (K Tons) Forecast, by Application 2020 & 2033
- Table 35: Rest of South America US Printing Inks Industry Revenue (billion) Forecast, by Application 2020 & 2033
- Table 36: Rest of South America US Printing Inks Industry Volume (K Tons) Forecast, by Application 2020 & 2033
- Table 37: Global US Printing Inks Industry Revenue billion Forecast, by Type 2020 & 2033
- Table 38: Global US Printing Inks Industry Volume K Tons Forecast, by Type 2020 & 2033
- Table 39: Global US Printing Inks Industry Revenue billion Forecast, by Process 2020 & 2033
- Table 40: Global US Printing Inks Industry Volume K Tons Forecast, by Process 2020 & 2033
- Table 41: Global US Printing Inks Industry Revenue billion Forecast, by Application 2020 & 2033
- Table 42: Global US Printing Inks Industry Volume K Tons Forecast, by Application 2020 & 2033
- Table 43: Global US Printing Inks Industry Revenue billion Forecast, by Country 2020 & 2033
- Table 44: Global US Printing Inks Industry Volume K Tons Forecast, by Country 2020 & 2033
- Table 45: United Kingdom US Printing Inks Industry Revenue (billion) Forecast, by Application 2020 & 2033
- Table 46: United Kingdom US Printing Inks Industry Volume (K Tons) Forecast, by Application 2020 & 2033
- Table 47: Germany US Printing Inks Industry Revenue (billion) Forecast, by Application 2020 & 2033
- Table 48: Germany US Printing Inks Industry Volume (K Tons) Forecast, by Application 2020 & 2033
- Table 49: France US Printing Inks Industry Revenue (billion) Forecast, by Application 2020 & 2033
- Table 50: France US Printing Inks Industry Volume (K Tons) Forecast, by Application 2020 & 2033
- Table 51: Italy US Printing Inks Industry Revenue (billion) Forecast, by Application 2020 & 2033
- Table 52: Italy US Printing Inks Industry Volume (K Tons) Forecast, by Application 2020 & 2033
- Table 53: Spain US Printing Inks Industry Revenue (billion) Forecast, by Application 2020 & 2033
- Table 54: Spain US Printing Inks Industry Volume (K Tons) Forecast, by Application 2020 & 2033
- Table 55: Russia US Printing Inks Industry Revenue (billion) Forecast, by Application 2020 & 2033
- Table 56: Russia US Printing Inks Industry Volume (K Tons) Forecast, by Application 2020 & 2033
- Table 57: Benelux US Printing Inks Industry Revenue (billion) Forecast, by Application 2020 & 2033
- Table 58: Benelux US Printing Inks Industry Volume (K Tons) Forecast, by Application 2020 & 2033
- Table 59: Nordics US Printing Inks Industry Revenue (billion) Forecast, by Application 2020 & 2033
- Table 60: Nordics US Printing Inks Industry Volume (K Tons) Forecast, by Application 2020 & 2033
- Table 61: Rest of Europe US Printing Inks Industry Revenue (billion) Forecast, by Application 2020 & 2033
- Table 62: Rest of Europe US Printing Inks Industry Volume (K Tons) Forecast, by Application 2020 & 2033
- Table 63: Global US Printing Inks Industry Revenue billion Forecast, by Type 2020 & 2033
- Table 64: Global US Printing Inks Industry Volume K Tons Forecast, by Type 2020 & 2033
- Table 65: Global US Printing Inks Industry Revenue billion Forecast, by Process 2020 & 2033
- Table 66: Global US Printing Inks Industry Volume K Tons Forecast, by Process 2020 & 2033
- Table 67: Global US Printing Inks Industry Revenue billion Forecast, by Application 2020 & 2033
- Table 68: Global US Printing Inks Industry Volume K Tons Forecast, by Application 2020 & 2033
- Table 69: Global US Printing Inks Industry Revenue billion Forecast, by Country 2020 & 2033
- Table 70: Global US Printing Inks Industry Volume K Tons Forecast, by Country 2020 & 2033
- Table 71: Turkey US Printing Inks Industry Revenue (billion) Forecast, by Application 2020 & 2033
- Table 72: Turkey US Printing Inks Industry Volume (K Tons) Forecast, by Application 2020 & 2033
- Table 73: Israel US Printing Inks Industry Revenue (billion) Forecast, by Application 2020 & 2033
- Table 74: Israel US Printing Inks Industry Volume (K Tons) Forecast, by Application 2020 & 2033
- Table 75: GCC US Printing Inks Industry Revenue (billion) Forecast, by Application 2020 & 2033
- Table 76: GCC US Printing Inks Industry Volume (K Tons) Forecast, by Application 2020 & 2033
- Table 77: North Africa US Printing Inks Industry Revenue (billion) Forecast, by Application 2020 & 2033
- Table 78: North Africa US Printing Inks Industry Volume (K Tons) Forecast, by Application 2020 & 2033
- Table 79: South Africa US Printing Inks Industry Revenue (billion) Forecast, by Application 2020 & 2033
- Table 80: South Africa US Printing Inks Industry Volume (K Tons) Forecast, by Application 2020 & 2033
- Table 81: Rest of Middle East & Africa US Printing Inks Industry Revenue (billion) Forecast, by Application 2020 & 2033
- Table 82: Rest of Middle East & Africa US Printing Inks Industry Volume (K Tons) Forecast, by Application 2020 & 2033
- Table 83: Global US Printing Inks Industry Revenue billion Forecast, by Type 2020 & 2033
- Table 84: Global US Printing Inks Industry Volume K Tons Forecast, by Type 2020 & 2033
- Table 85: Global US Printing Inks Industry Revenue billion Forecast, by Process 2020 & 2033
- Table 86: Global US Printing Inks Industry Volume K Tons Forecast, by Process 2020 & 2033
- Table 87: Global US Printing Inks Industry Revenue billion Forecast, by Application 2020 & 2033
- Table 88: Global US Printing Inks Industry Volume K Tons Forecast, by Application 2020 & 2033
- Table 89: Global US Printing Inks Industry Revenue billion Forecast, by Country 2020 & 2033
- Table 90: Global US Printing Inks Industry Volume K Tons Forecast, by Country 2020 & 2033
- Table 91: China US Printing Inks Industry Revenue (billion) Forecast, by Application 2020 & 2033
- Table 92: China US Printing Inks Industry Volume (K Tons) Forecast, by Application 2020 & 2033
- Table 93: India US Printing Inks Industry Revenue (billion) Forecast, by Application 2020 & 2033
- Table 94: India US Printing Inks Industry Volume (K Tons) Forecast, by Application 2020 & 2033
- Table 95: Japan US Printing Inks Industry Revenue (billion) Forecast, by Application 2020 & 2033
- Table 96: Japan US Printing Inks Industry Volume (K Tons) Forecast, by Application 2020 & 2033
- Table 97: South Korea US Printing Inks Industry Revenue (billion) Forecast, by Application 2020 & 2033
- Table 98: South Korea US Printing Inks Industry Volume (K Tons) Forecast, by Application 2020 & 2033
- Table 99: ASEAN US Printing Inks Industry Revenue (billion) Forecast, by Application 2020 & 2033
- Table 100: ASEAN US Printing Inks Industry Volume (K Tons) Forecast, by Application 2020 & 2033
- Table 101: Oceania US Printing Inks Industry Revenue (billion) Forecast, by Application 2020 & 2033
- Table 102: Oceania US Printing Inks Industry Volume (K Tons) Forecast, by Application 2020 & 2033
- Table 103: Rest of Asia Pacific US Printing Inks Industry Revenue (billion) Forecast, by Application 2020 & 2033
- Table 104: Rest of Asia Pacific US Printing Inks Industry Volume (K Tons) Forecast, by Application 2020 & 2033
Frequently Asked Questions
1. What is the projected Compound Annual Growth Rate (CAGR) of the US Printing Inks Industry?
The projected CAGR is approximately 12.3%.
2. Which companies are prominent players in the US Printing Inks Industry?
Key companies in the market include Altana, Sun Chemical, Electronics For Imaging Inc, FUJIFILM Corporation, Hubergroup Deutschland GmbH, Sicpa Holding SA, T&K TOKA Corporation, DuPont, Dow, Dainichiseika Color & Chemicals Mfg Co Ltd, Siegwerk Druckfarben AG & Co KGaA, Tokyo Printing Ink Mfg Co Ltd, Sakata Inx Corporation, Zeller+Gmelin, Wikoff Color Corporation, Flint Group, Toyo Ink SC Holdings Co Ltd.
3. What are the main segments of the US Printing Inks Industry?
The market segments include Type, Process, Application.
4. Can you provide details about the market size?
The market size is estimated to be USD 10.31 billion as of 2022.
5. What are some drivers contributing to market growth?
Growing Demand from the Digital Printing Industry; High Demand from the Packaging Sector.
6. What are the notable trends driving market growth?
Water-based Inks to Observe the Highest Growth.
7. Are there any restraints impacting market growth?
Rising Demand for Digital Advertisements and E-books; Stringent Regulations Regarding Disposal.
8. Can you provide examples of recent developments in the market?
In May 2021, Epple Druckfarben AG and Zeller+Gmelin GmbH & Co. KG were working together in the field of UV ink technology. The first result of this partnership is a jointly developed UV-LED ink for sheetfed offset. The products are developed for different areas of application, which Epple will market worldwide under the LightStar brand.
9. What pricing options are available for accessing the report?
Pricing options include single-user, multi-user, and enterprise licenses priced at USD 3800, USD 4500, and USD 5800 respectively.
10. Is the market size provided in terms of value or volume?
The market size is provided in terms of value, measured in billion and volume, measured in K Tons.
11. Are there any specific market keywords associated with the report?
Yes, the market keyword associated with the report is "US Printing Inks Industry," which aids in identifying and referencing the specific market segment covered.
12. How do I determine which pricing option suits my needs best?
The pricing options vary based on user requirements and access needs. Individual users may opt for single-user licenses, while businesses requiring broader access may choose multi-user or enterprise licenses for cost-effective access to the report.
13. Are there any additional resources or data provided in the US Printing Inks Industry report?
While the report offers comprehensive insights, it's advisable to review the specific contents or supplementary materials provided to ascertain if additional resources or data are available.
14. How can I stay updated on further developments or reports in the US Printing Inks Industry?
To stay informed about further developments, trends, and reports in the US Printing Inks Industry, consider subscribing to industry newsletters, following relevant companies and organizations, or regularly checking reputable industry news sources and publications.
Methodology
Step 1 - Identification of Relevant Samples Size from Population Database


Step 2 - Approaches for Defining Global Market Size (Value, Volume* & Price*)

Note*: In applicable scenarios
Step 3 - Data Sources
Primary Research
- Web Analytics
- Survey Reports
- Research Institute
- Latest Research Reports
- Opinion Leaders
Secondary Research
- Annual Reports
- White Paper
- Latest Press Release
- Industry Association
- Paid Database
- Investor Presentations

Step 4 - Data Triangulation
Involves using different sources of information in order to increase the validity of a study
These sources are likely to be stakeholders in a program - participants, other researchers, program staff, other community members, and so on.
Then we put all data in single framework & apply various statistical tools to find out the dynamic on the market.
During the analysis stage, feedback from the stakeholder groups would be compared to determine areas of agreement as well as areas of divergence

