

Key Insights
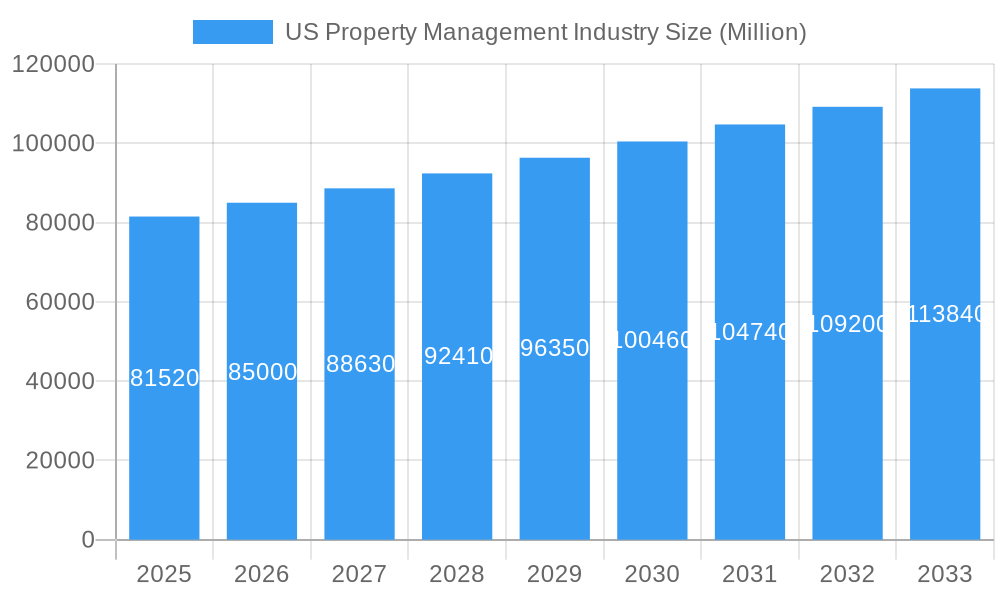
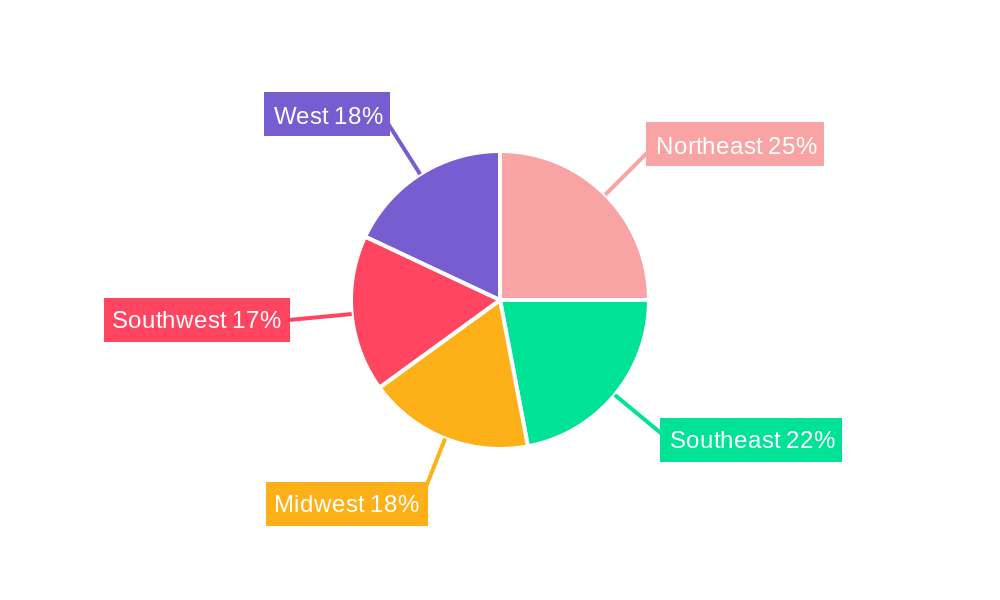
The US property management industry, currently valued at $81.52 billion (2025), is projected to experience robust growth, driven by several key factors. The increasing urbanization and population growth, particularly in major metropolitan areas across the Northeast, Southeast, and West, fuel consistent demand for residential and commercial properties. Simultaneously, the rise of remote work and evolving lifestyle preferences are reshaping the demand for diverse property types, including flexible co-working spaces and multi-family dwellings, boosting the need for sophisticated property management services. Technological advancements, such as property management software and data analytics, are streamlining operations, improving efficiency, and enhancing tenant experiences, thus contributing to market expansion. The industry's segmentation into residential and commercial end-users, coupled with diverse service offerings encompassing marketing, property evaluation, tenant services, and maintenance, presents considerable opportunities for growth and specialization. Competition among established players like WinnCompanies, CoStar Group Inc., Jones Lang LaSalle, CBRE Group, and others, promotes innovation and service quality, while simultaneously creating a challenging yet dynamic market environment.
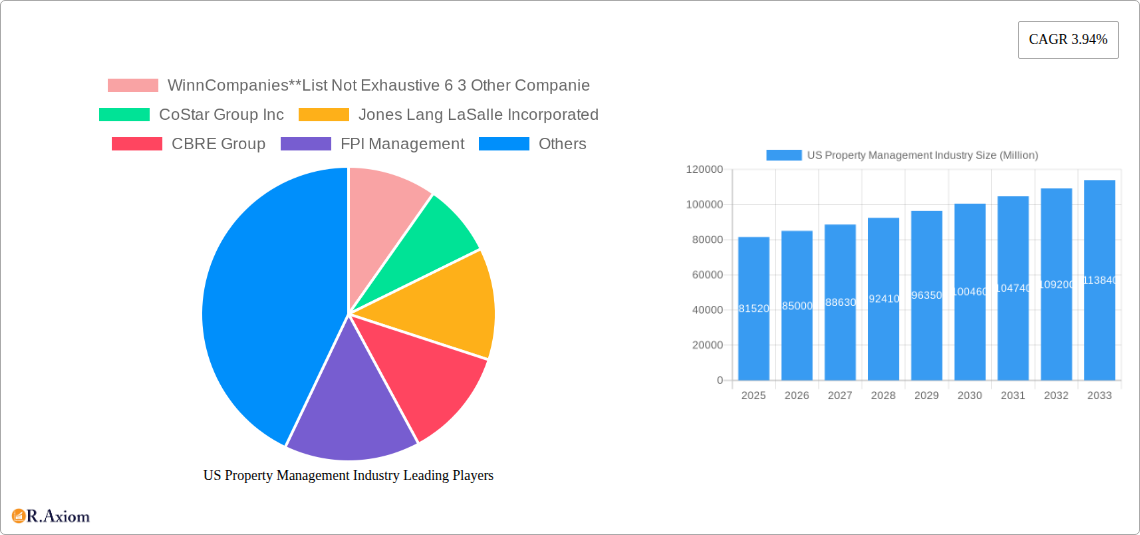
US Property Management Industry Market Size (In Billion)
However, the industry also faces certain challenges. Economic fluctuations, interest rate changes, and potential regulatory shifts in areas like rent control can impact market growth. Finding and retaining skilled property managers, particularly those with expertise in technology and tenant relations, poses a significant hurdle for many firms. Further, maintaining profitability in a competitive landscape necessitates continuous optimization of operational costs and efficient service delivery. Despite these headwinds, the long-term outlook remains positive, with the projected compound annual growth rate (CAGR) of 3.94% suggesting a substantial increase in market value over the forecast period (2025-2033). This growth trajectory is expected to be propelled by the consistent demand for quality property management services across various market segments.
US Property Management Industry Company Market Share
This comprehensive report provides a detailed analysis of the US Property Management industry, covering market size, segmentation, trends, competitive landscape, and future outlook. The study period spans from 2019 to 2033, with 2025 as the base and estimated year. The report leverages extensive primary and secondary research to offer actionable insights for industry stakeholders, including property management companies, investors, and technology providers.
US Property Management Industry Market Concentration & Innovation
The US property management industry exhibits a moderately concentrated market structure, with a few large players holding significant market share. The top 10 companies, including WinnCompanies, CoStar Group Inc, Jones Lang LaSalle Incorporated, CBRE Group, FPI Management, Equity Residential, Greystar Real Estate Partners, Pinnacle Property Management, AvalonBay Communities, and Lincoln Property Company, account for an estimated xx% of the total market revenue in 2025. However, a significant number of smaller firms also contribute to the overall market activity.
Market Concentration Metrics (2025):
- Top 3 players market share: xx%
- Top 5 players market share: xx%
- Top 10 players market share: xx%
Innovation Drivers:
- Technological advancements in property management software (e.g., AI-powered tenant screening, predictive maintenance)
- Growing demand for sustainable and energy-efficient building management solutions
- Increasing adoption of PropTech solutions to improve operational efficiency and tenant experience
Regulatory Framework & M&A Activity:
The industry is subject to various federal, state, and local regulations impacting tenant rights, property safety, and fair housing practices. The past five years have witnessed significant M&A activity, with deal values exceeding $xx Million in 2024 alone. Examples include RealPage's acquisition of On-site Managers Inc. for approximately USD 250 Million in November 2023.
US Property Management Industry Industry Trends & Insights
The US property management industry is experiencing robust growth, driven by several key factors. The increasing urbanization and population growth are fueling demand for residential and commercial properties, creating a higher demand for property management services. Additionally, the rise of PropTech solutions is improving operational efficiency and enhancing tenant experiences, further stimulating industry growth.
Market Growth Drivers:
- Urbanization and population growth
- Increasing demand for rental housing
- Growing adoption of PropTech solutions
- Expansion of the commercial real estate sector
Technological Disruptions:
The integration of technologies such as AI, IoT, and big data analytics is transforming property management operations. These technologies are optimizing processes, enhancing tenant communication, and improving asset management. The market penetration of PropTech solutions is expected to reach xx% by 2033, with a CAGR of xx% during the forecast period (2025-2033).
Consumer Preferences & Competitive Dynamics:
Consumer preferences are shifting towards properties offering enhanced amenities, smart home technologies, and flexible lease terms. This is driving competition among property management firms to provide superior services and attract and retain tenants. The competitive landscape is characterized by both large national players and smaller regional firms, resulting in a dynamic market.
Dominant Markets & Segments in US Property Management Industry
The US property management industry is dominated by the residential segment, accounting for xx% of the total market revenue in 2025. This is largely driven by the increasing demand for rental housing across major metropolitan areas.
Dominant Segments & Key Drivers:
Residential:
- High demand for rental housing in urban centers
- Growing millennial and Gen Z populations renting instead of buying
- Favorable economic conditions and low interest rates (in certain periods)
Commercial:
- Growth in the office, retail, and industrial real estate sectors
- Increasing demand for flexible workspace solutions
Services: The most significant service is maintenance and repairs. Property evaluation and tenant services are also large segments with growing market share due to an increased demand for quality of service.
US Property Management Industry Product Developments
Recent product innovations have focused on streamlining operations, improving tenant engagement, and enhancing data analytics capabilities. The integration of AI and machine learning into property management software provides opportunities for predictive maintenance and more efficient resource allocation. These technological advancements are improving efficiency and lowering operational costs, attracting customers.
Report Scope & Segmentation Analysis
This report segments the US property management market by end-user (commercial and residential) and service type (marketing, property evaluation, tenant services, maintenance, and other services). Each segment's growth projections, market size, and competitive dynamics are analyzed in detail.
Residential Segment: This segment is characterized by high growth, driven by increasing demand for rental housing. Market size in 2025 is estimated to be $xx Million.
Commercial Segment: This segment experiences moderate growth, influenced by the performance of various commercial real estate sectors. The 2025 market size is estimated at $xx Million.
Service Segments: Each service segment shows variable growth depending on market conditions and technological innovations. Market sizes will be specified in the full report.
Key Drivers of US Property Management Industry Growth
The US property management industry's growth is propelled by several factors: Firstly, population growth and urbanization increase demand for housing. Secondly, technological advancements improve efficiency and reduce costs. Finally, favorable economic conditions (during periods of growth) increase investment in real estate.
Challenges in the US Property Management Industry Sector
The industry faces challenges like fluctuating interest rates impacting investment, regulatory compliance complexities, and intense competition among firms. Supply chain disruptions can also affect maintenance and repair operations, increasing costs and reducing efficiency.
Emerging Opportunities in US Property Management Industry
Emerging opportunities include leveraging big data and AI for predictive maintenance, developing sustainable building management practices, offering customized tenant experiences through personalized services and smart home technologies, and expanding into new geographic markets.
Leading Players in the US Property Management Industry Market
- WinnCompanies
- CoStar Group Inc
- Jones Lang LaSalle Incorporated
- CBRE Group
- FPI Management
- Equity Residential
- Greystar Real Estate Partners
- Pinnacle Property Management
- AvalonBay Communities
- Lincoln Property Company
Key Developments in US Property Management Industry Industry
- February 2024: Wood Partners sold its property management business (38,000+ units) to Greystar, signifying consolidation in the market.
- November 2023: RealPage Inc. acquired On-site Managers Inc. for USD 250 Million, strengthening its position in the PropTech sector.
Strategic Outlook for US Property Management Industry Market
The US property management industry is poised for continued growth, driven by technological innovation, demographic shifts, and the ongoing demand for efficient and reliable property management services. Opportunities exist for companies to differentiate themselves through superior technology adoption, personalized service offerings, and a focus on sustainability. The market is expected to show strong growth over the forecast period.
US Property Management Industry Segmentation
-
1. End User
- 1.1. Commercial
- 1.2. Residential
-
2. Service
- 2.1. Marketing
- 2.2. Property Evaluation
- 2.3. Tenant Services
- 2.4. Maintenance
- 2.5. Other Services
US Property Management Industry Segmentation By Geography
-
1. North America
- 1.1. United States
- 1.2. Canada
- 1.3. Mexico
-
2. South America
- 2.1. Brazil
- 2.2. Argentina
- 2.3. Rest of South America
-
3. Europe
- 3.1. United Kingdom
- 3.2. Germany
- 3.3. France
- 3.4. Italy
- 3.5. Spain
- 3.6. Russia
- 3.7. Benelux
- 3.8. Nordics
- 3.9. Rest of Europe
-
4. Middle East & Africa
- 4.1. Turkey
- 4.2. Israel
- 4.3. GCC
- 4.4. North Africa
- 4.5. South Africa
- 4.6. Rest of Middle East & Africa
-
5. Asia Pacific
- 5.1. China
- 5.2. India
- 5.3. Japan
- 5.4. South Korea
- 5.5. ASEAN
- 5.6. Oceania
- 5.7. Rest of Asia Pacific
US Property Management Industry Regional Market Share
Geographic Coverage of US Property Management Industry
US Property Management Industry REPORT HIGHLIGHTS
| Aspects | Details |
|---|---|
| Study Period | 2020-2034 |
| Base Year | 2025 |
| Estimated Year | 2026 |
| Forecast Period | 2026-2034 |
| Historical Period | 2020-2025 |
| Growth Rate | CAGR of 3.94% from 2020-2034 |
| Segmentation |
|
Table of Contents
- 1. Introduction
- 1.1. Research Scope
- 1.2. Market Segmentation
- 1.3. Research Objective
- 1.4. Definitions and Assumptions
- 2. Executive Summary
- 2.1. Market Snapshot
- 3. Market Dynamics
- 3.1. Market Drivers
- 3.2. Market Restrains
- 3.3. Market Trends
- 3.4. Market Opportunities
- 4. Market Factor Analysis
- 4.1. Porters Five Forces
- 4.1.1. Bargaining Power of Suppliers
- 4.1.2. Bargaining Power of Buyers
- 4.1.3. Threat of New Entrants
- 4.1.4. Threat of Substitutes
- 4.1.5. Competitive Rivalry
- 4.2. PESTEL analysis
- 4.3. BCG Analysis
- 4.3.1. Stars (High Growth, High Market Share)
- 4.3.2. Cash Cows (Low Growth, High Market Share)
- 4.3.3. Question Mark (High Growth, Low Market Share)
- 4.3.4. Dogs (Low Growth, Low Market Share)
- 4.4. Ansoff Matrix Analysis
- 4.5. Supply Chain Analysis
- 4.6. Regulatory Landscape
- 4.7. Current Market Potential and Opportunity Assessment (TAM–SAM–SOM Framework)
- 4.8. RAX Analyst Note
- 4.1. Porters Five Forces
- 5. Market Analysis, Insights and Forecast 2021-2033
- 5.1. Market Analysis, Insights and Forecast - by End User
- 5.1.1. Commercial
- 5.1.2. Residential
- 5.2. Market Analysis, Insights and Forecast - by Service
- 5.2.1. Marketing
- 5.2.2. Property Evaluation
- 5.2.3. Tenant Services
- 5.2.4. Maintenance
- 5.2.5. Other Services
- 5.3. Market Analysis, Insights and Forecast - by Region
- 5.3.1. North America
- 5.3.2. South America
- 5.3.3. Europe
- 5.3.4. Middle East & Africa
- 5.3.5. Asia Pacific
- 5.1. Market Analysis, Insights and Forecast - by End User
- 6. Global US Property Management Industry Analysis, Insights and Forecast, 2021-2033
- 6.1. Market Analysis, Insights and Forecast - by End User
- 6.1.1. Commercial
- 6.1.2. Residential
- 6.2. Market Analysis, Insights and Forecast - by Service
- 6.2.1. Marketing
- 6.2.2. Property Evaluation
- 6.2.3. Tenant Services
- 6.2.4. Maintenance
- 6.2.5. Other Services
- 6.1. Market Analysis, Insights and Forecast - by End User
- 7. North America US Property Management Industry Analysis, Insights and Forecast, 2020-2032
- 7.1. Market Analysis, Insights and Forecast - by End User
- 7.1.1. Commercial
- 7.1.2. Residential
- 7.2. Market Analysis, Insights and Forecast - by Service
- 7.2.1. Marketing
- 7.2.2. Property Evaluation
- 7.2.3. Tenant Services
- 7.2.4. Maintenance
- 7.2.5. Other Services
- 7.1. Market Analysis, Insights and Forecast - by End User
- 8. South America US Property Management Industry Analysis, Insights and Forecast, 2020-2032
- 8.1. Market Analysis, Insights and Forecast - by End User
- 8.1.1. Commercial
- 8.1.2. Residential
- 8.2. Market Analysis, Insights and Forecast - by Service
- 8.2.1. Marketing
- 8.2.2. Property Evaluation
- 8.2.3. Tenant Services
- 8.2.4. Maintenance
- 8.2.5. Other Services
- 8.1. Market Analysis, Insights and Forecast - by End User
- 9. Europe US Property Management Industry Analysis, Insights and Forecast, 2020-2032
- 9.1. Market Analysis, Insights and Forecast - by End User
- 9.1.1. Commercial
- 9.1.2. Residential
- 9.2. Market Analysis, Insights and Forecast - by Service
- 9.2.1. Marketing
- 9.2.2. Property Evaluation
- 9.2.3. Tenant Services
- 9.2.4. Maintenance
- 9.2.5. Other Services
- 9.1. Market Analysis, Insights and Forecast - by End User
- 10. Middle East & Africa US Property Management Industry Analysis, Insights and Forecast, 2020-2032
- 10.1. Market Analysis, Insights and Forecast - by End User
- 10.1.1. Commercial
- 10.1.2. Residential
- 10.2. Market Analysis, Insights and Forecast - by Service
- 10.2.1. Marketing
- 10.2.2. Property Evaluation
- 10.2.3. Tenant Services
- 10.2.4. Maintenance
- 10.2.5. Other Services
- 10.1. Market Analysis, Insights and Forecast - by End User
- 11. Asia Pacific US Property Management Industry Analysis, Insights and Forecast, 2020-2032
- 11.1. Market Analysis, Insights and Forecast - by End User
- 11.1.1. Commercial
- 11.1.2. Residential
- 11.2. Market Analysis, Insights and Forecast - by Service
- 11.2.1. Marketing
- 11.2.2. Property Evaluation
- 11.2.3. Tenant Services
- 11.2.4. Maintenance
- 11.2.5. Other Services
- 11.1. Market Analysis, Insights and Forecast - by End User
- 12. Competitive Analysis
- 12.1. Company Profiles
- 12.1.1 WinnCompanies**List Not Exhaustive 6 3 Other Companie
- 12.1.1.1. Company Overview
- 12.1.1.2. Products
- 12.1.1.3. Company Financials
- 12.1.1.4. SWOT Analysis
- 12.1.2 CoStar Group Inc
- 12.1.2.1. Company Overview
- 12.1.2.2. Products
- 12.1.2.3. Company Financials
- 12.1.2.4. SWOT Analysis
- 12.1.3 Jones Lang LaSalle Incorporated
- 12.1.3.1. Company Overview
- 12.1.3.2. Products
- 12.1.3.3. Company Financials
- 12.1.3.4. SWOT Analysis
- 12.1.4 CBRE Group
- 12.1.4.1. Company Overview
- 12.1.4.2. Products
- 12.1.4.3. Company Financials
- 12.1.4.4. SWOT Analysis
- 12.1.5 FPI Management
- 12.1.5.1. Company Overview
- 12.1.5.2. Products
- 12.1.5.3. Company Financials
- 12.1.5.4. SWOT Analysis
- 12.1.6 Equity Residential
- 12.1.6.1. Company Overview
- 12.1.6.2. Products
- 12.1.6.3. Company Financials
- 12.1.6.4. SWOT Analysis
- 12.1.7 Greystar Real Estate Partners
- 12.1.7.1. Company Overview
- 12.1.7.2. Products
- 12.1.7.3. Company Financials
- 12.1.7.4. SWOT Analysis
- 12.1.8 Pinnacle Property Management
- 12.1.8.1. Company Overview
- 12.1.8.2. Products
- 12.1.8.3. Company Financials
- 12.1.8.4. SWOT Analysis
- 12.1.9 AvalonBay Communities
- 12.1.9.1. Company Overview
- 12.1.9.2. Products
- 12.1.9.3. Company Financials
- 12.1.9.4. SWOT Analysis
- 12.1.10 Lincoln Property Company
- 12.1.10.1. Company Overview
- 12.1.10.2. Products
- 12.1.10.3. Company Financials
- 12.1.10.4. SWOT Analysis
- 12.1.1 WinnCompanies**List Not Exhaustive 6 3 Other Companie
- 12.2. Market Entropy
- 12.2.1 Company's Key Areas Served
- 12.2.2 Recent Developments
- 12.3. Company Market Share Analysis 2025
- 12.3.1 Top 5 Companies Market Share Analysis
- 12.3.2 Top 3 Companies Market Share Analysis
- 12.4. List of Potential Customers
- 13. Research Methodology
List of Figures
- Figure 1: Global US Property Management Industry Revenue Breakdown (Million, %) by Region 2025 & 2033
- Figure 2: North America US Property Management Industry Revenue (Million), by End User 2025 & 2033
- Figure 3: North America US Property Management Industry Revenue Share (%), by End User 2025 & 2033
- Figure 4: North America US Property Management Industry Revenue (Million), by Service 2025 & 2033
- Figure 5: North America US Property Management Industry Revenue Share (%), by Service 2025 & 2033
- Figure 6: North America US Property Management Industry Revenue (Million), by Country 2025 & 2033
- Figure 7: North America US Property Management Industry Revenue Share (%), by Country 2025 & 2033
- Figure 8: South America US Property Management Industry Revenue (Million), by End User 2025 & 2033
- Figure 9: South America US Property Management Industry Revenue Share (%), by End User 2025 & 2033
- Figure 10: South America US Property Management Industry Revenue (Million), by Service 2025 & 2033
- Figure 11: South America US Property Management Industry Revenue Share (%), by Service 2025 & 2033
- Figure 12: South America US Property Management Industry Revenue (Million), by Country 2025 & 2033
- Figure 13: South America US Property Management Industry Revenue Share (%), by Country 2025 & 2033
- Figure 14: Europe US Property Management Industry Revenue (Million), by End User 2025 & 2033
- Figure 15: Europe US Property Management Industry Revenue Share (%), by End User 2025 & 2033
- Figure 16: Europe US Property Management Industry Revenue (Million), by Service 2025 & 2033
- Figure 17: Europe US Property Management Industry Revenue Share (%), by Service 2025 & 2033
- Figure 18: Europe US Property Management Industry Revenue (Million), by Country 2025 & 2033
- Figure 19: Europe US Property Management Industry Revenue Share (%), by Country 2025 & 2033
- Figure 20: Middle East & Africa US Property Management Industry Revenue (Million), by End User 2025 & 2033
- Figure 21: Middle East & Africa US Property Management Industry Revenue Share (%), by End User 2025 & 2033
- Figure 22: Middle East & Africa US Property Management Industry Revenue (Million), by Service 2025 & 2033
- Figure 23: Middle East & Africa US Property Management Industry Revenue Share (%), by Service 2025 & 2033
- Figure 24: Middle East & Africa US Property Management Industry Revenue (Million), by Country 2025 & 2033
- Figure 25: Middle East & Africa US Property Management Industry Revenue Share (%), by Country 2025 & 2033
- Figure 26: Asia Pacific US Property Management Industry Revenue (Million), by End User 2025 & 2033
- Figure 27: Asia Pacific US Property Management Industry Revenue Share (%), by End User 2025 & 2033
- Figure 28: Asia Pacific US Property Management Industry Revenue (Million), by Service 2025 & 2033
- Figure 29: Asia Pacific US Property Management Industry Revenue Share (%), by Service 2025 & 2033
- Figure 30: Asia Pacific US Property Management Industry Revenue (Million), by Country 2025 & 2033
- Figure 31: Asia Pacific US Property Management Industry Revenue Share (%), by Country 2025 & 2033
List of Tables
- Table 1: Global US Property Management Industry Revenue Million Forecast, by End User 2020 & 2033
- Table 2: Global US Property Management Industry Revenue Million Forecast, by Service 2020 & 2033
- Table 3: Global US Property Management Industry Revenue Million Forecast, by Region 2020 & 2033
- Table 4: Global US Property Management Industry Revenue Million Forecast, by End User 2020 & 2033
- Table 5: Global US Property Management Industry Revenue Million Forecast, by Service 2020 & 2033
- Table 6: Global US Property Management Industry Revenue Million Forecast, by Country 2020 & 2033
- Table 7: United States US Property Management Industry Revenue (Million) Forecast, by Application 2020 & 2033
- Table 8: Canada US Property Management Industry Revenue (Million) Forecast, by Application 2020 & 2033
- Table 9: Mexico US Property Management Industry Revenue (Million) Forecast, by Application 2020 & 2033
- Table 10: Global US Property Management Industry Revenue Million Forecast, by End User 2020 & 2033
- Table 11: Global US Property Management Industry Revenue Million Forecast, by Service 2020 & 2033
- Table 12: Global US Property Management Industry Revenue Million Forecast, by Country 2020 & 2033
- Table 13: Brazil US Property Management Industry Revenue (Million) Forecast, by Application 2020 & 2033
- Table 14: Argentina US Property Management Industry Revenue (Million) Forecast, by Application 2020 & 2033
- Table 15: Rest of South America US Property Management Industry Revenue (Million) Forecast, by Application 2020 & 2033
- Table 16: Global US Property Management Industry Revenue Million Forecast, by End User 2020 & 2033
- Table 17: Global US Property Management Industry Revenue Million Forecast, by Service 2020 & 2033
- Table 18: Global US Property Management Industry Revenue Million Forecast, by Country 2020 & 2033
- Table 19: United Kingdom US Property Management Industry Revenue (Million) Forecast, by Application 2020 & 2033
- Table 20: Germany US Property Management Industry Revenue (Million) Forecast, by Application 2020 & 2033
- Table 21: France US Property Management Industry Revenue (Million) Forecast, by Application 2020 & 2033
- Table 22: Italy US Property Management Industry Revenue (Million) Forecast, by Application 2020 & 2033
- Table 23: Spain US Property Management Industry Revenue (Million) Forecast, by Application 2020 & 2033
- Table 24: Russia US Property Management Industry Revenue (Million) Forecast, by Application 2020 & 2033
- Table 25: Benelux US Property Management Industry Revenue (Million) Forecast, by Application 2020 & 2033
- Table 26: Nordics US Property Management Industry Revenue (Million) Forecast, by Application 2020 & 2033
- Table 27: Rest of Europe US Property Management Industry Revenue (Million) Forecast, by Application 2020 & 2033
- Table 28: Global US Property Management Industry Revenue Million Forecast, by End User 2020 & 2033
- Table 29: Global US Property Management Industry Revenue Million Forecast, by Service 2020 & 2033
- Table 30: Global US Property Management Industry Revenue Million Forecast, by Country 2020 & 2033
- Table 31: Turkey US Property Management Industry Revenue (Million) Forecast, by Application 2020 & 2033
- Table 32: Israel US Property Management Industry Revenue (Million) Forecast, by Application 2020 & 2033
- Table 33: GCC US Property Management Industry Revenue (Million) Forecast, by Application 2020 & 2033
- Table 34: North Africa US Property Management Industry Revenue (Million) Forecast, by Application 2020 & 2033
- Table 35: South Africa US Property Management Industry Revenue (Million) Forecast, by Application 2020 & 2033
- Table 36: Rest of Middle East & Africa US Property Management Industry Revenue (Million) Forecast, by Application 2020 & 2033
- Table 37: Global US Property Management Industry Revenue Million Forecast, by End User 2020 & 2033
- Table 38: Global US Property Management Industry Revenue Million Forecast, by Service 2020 & 2033
- Table 39: Global US Property Management Industry Revenue Million Forecast, by Country 2020 & 2033
- Table 40: China US Property Management Industry Revenue (Million) Forecast, by Application 2020 & 2033
- Table 41: India US Property Management Industry Revenue (Million) Forecast, by Application 2020 & 2033
- Table 42: Japan US Property Management Industry Revenue (Million) Forecast, by Application 2020 & 2033
- Table 43: South Korea US Property Management Industry Revenue (Million) Forecast, by Application 2020 & 2033
- Table 44: ASEAN US Property Management Industry Revenue (Million) Forecast, by Application 2020 & 2033
- Table 45: Oceania US Property Management Industry Revenue (Million) Forecast, by Application 2020 & 2033
- Table 46: Rest of Asia Pacific US Property Management Industry Revenue (Million) Forecast, by Application 2020 & 2033
Frequently Asked Questions
1. What is the projected Compound Annual Growth Rate (CAGR) of the US Property Management Industry?
The projected CAGR is approximately 3.94%.
2. Which companies are prominent players in the US Property Management Industry?
Key companies in the market include WinnCompanies**List Not Exhaustive 6 3 Other Companie, CoStar Group Inc, Jones Lang LaSalle Incorporated, CBRE Group, FPI Management, Equity Residential, Greystar Real Estate Partners, Pinnacle Property Management, AvalonBay Communities, Lincoln Property Company.
3. What are the main segments of the US Property Management Industry?
The market segments include End User, Service.
4. Can you provide details about the market size?
The market size is estimated to be USD 81.52 Million as of 2022.
5. What are some drivers contributing to market growth?
Increasing Demand from the Commercial Segment is Driving the Market; Increasing Disposable Income of Consumers is Driving the market.
6. What are the notable trends driving market growth?
Demand from the Residential Sector is Supporting the Market.
7. Are there any restraints impacting market growth?
Economic Uncertainties are Restraining the Market.
8. Can you provide examples of recent developments in the market?
February 2024: Wood Partners, the 4th-largest real estate developer in the United States, sold its property management business for its 38,000+ units in 17 states to Greystar (Charleston, South Carolina), the country's largest apartment management company.
9. What pricing options are available for accessing the report?
Pricing options include single-user, multi-user, and enterprise licenses priced at USD 3800, USD 4500, and USD 5800 respectively.
10. Is the market size provided in terms of value or volume?
The market size is provided in terms of value, measured in Million.
11. Are there any specific market keywords associated with the report?
Yes, the market keyword associated with the report is "US Property Management Industry," which aids in identifying and referencing the specific market segment covered.
12. How do I determine which pricing option suits my needs best?
The pricing options vary based on user requirements and access needs. Individual users may opt for single-user licenses, while businesses requiring broader access may choose multi-user or enterprise licenses for cost-effective access to the report.
13. Are there any additional resources or data provided in the US Property Management Industry report?
While the report offers comprehensive insights, it's advisable to review the specific contents or supplementary materials provided to ascertain if additional resources or data are available.
14. How can I stay updated on further developments or reports in the US Property Management Industry?
To stay informed about further developments, trends, and reports in the US Property Management Industry, consider subscribing to industry newsletters, following relevant companies and organizations, or regularly checking reputable industry news sources and publications.
Methodology
Step 1 - Identification of Relevant Samples Size from Population Database


Step 2 - Approaches for Defining Global Market Size (Value, Volume* & Price*)

Note*: In applicable scenarios
Step 3 - Data Sources
Primary Research
- Web Analytics
- Survey Reports
- Research Institute
- Latest Research Reports
- Opinion Leaders
Secondary Research
- Annual Reports
- White Paper
- Latest Press Release
- Industry Association
- Paid Database
- Investor Presentations

Step 4 - Data Triangulation
Involves using different sources of information in order to increase the validity of a study
These sources are likely to be stakeholders in a program - participants, other researchers, program staff, other community members, and so on.
Then we put all data in single framework & apply various statistical tools to find out the dynamic on the market.
During the analysis stage, feedback from the stakeholder groups would be compared to determine areas of agreement as well as areas of divergence