

Key Insights
The U.S. residential smart meter market is poised for significant expansion, driven by escalating energy efficiency demands, critical grid modernization needs, and proactive government mandates supporting smart grid development. Key growth catalysts include the increasing integration of renewable energy sources, which requires sophisticated monitoring capabilities provided by smart meters. Furthermore, utilities are enhancing outage response and operational efficiency through smart meter deployment, improving customer experience. Advancements in wireless communication technologies are also reducing deployment costs and simplifying installation, further accelerating market adoption. This transition from analog to smart meters offers substantial long-term advantages in energy conservation, cost reduction, and grid reliability.
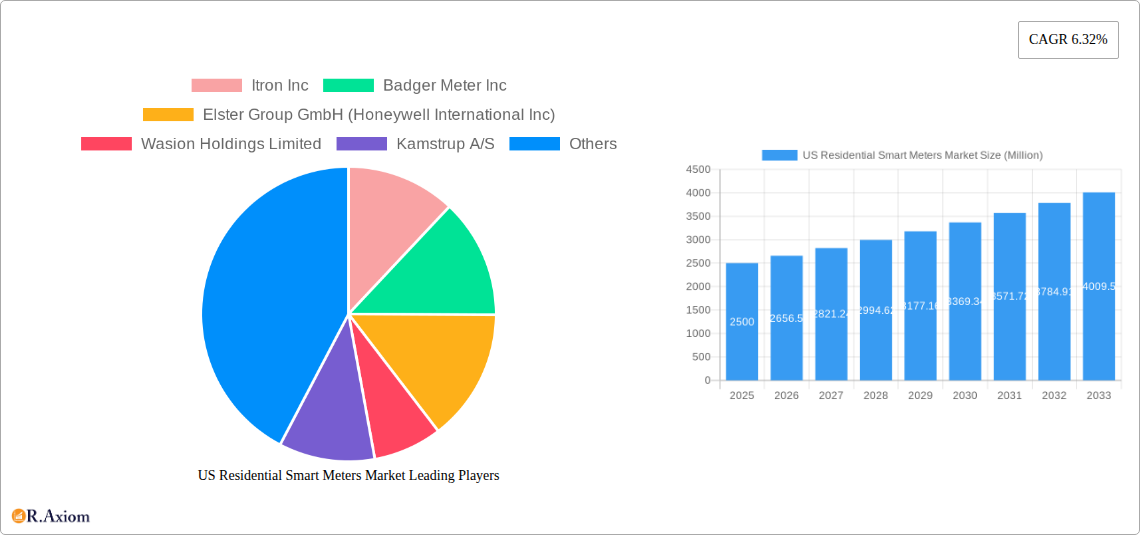
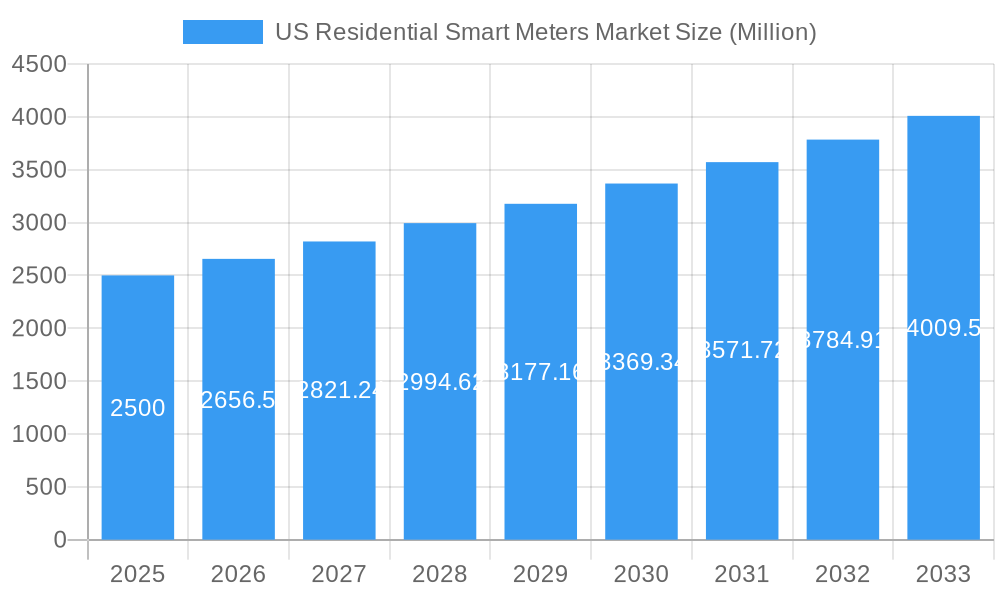
US Residential Smart Meters Market Market Size (In Million)
Despite robust growth, the market faces hurdles such as substantial upfront infrastructure investment, particularly for smaller utilities, and ongoing concerns regarding data security and privacy. However, continuous technological innovation, coupled with supportive government incentives and regulations, is effectively addressing these challenges. The market's segmentation by communication technology (wireless, wired) and application (energy monitoring, outage management, demand response) highlights its diverse landscape. Leading companies including Itron, Badger Meter, and Landis+GYR are strategically positioned for this growth. The U.S. residential smart meter market is projected to reach $98.93 million by 2025, with a compound annual growth rate (CAGR) of 6.32% during the forecast period of 2025-2033, underscoring the indispensable role of smart meters in future energy management.
US Residential Smart Meters Market Company Market Share
US Residential Smart Meters Market: A Comprehensive Report (2019-2033)
This in-depth report provides a comprehensive analysis of the US Residential Smart Meters market, covering market size, segmentation, growth drivers, challenges, and key players. The study period spans from 2019 to 2033, with 2025 serving as the base and estimated year. The report offers actionable insights for industry stakeholders, investors, and market entrants seeking to capitalize on the growing demand for smart metering solutions. Market values are expressed in Millions.
US Residential Smart Meters Market Concentration & Innovation
The US residential smart meters market exhibits a moderately concentrated landscape, with several key players vying for market share. Itron Inc, Badger Meter Inc, Elster Group GmbH (Honeywell International Inc), and other prominent companies dominate the market, driving innovation through continuous product development and strategic partnerships. The market is witnessing increasing consolidation through mergers and acquisitions (M&A), with deal values reaching xx Million in recent years. This consolidation is partly driven by the need for companies to expand their geographical reach, product portfolios, and technological capabilities. Several factors contribute to this dynamic market:
- Market Share: Itron Inc and Badger Meter Inc hold a significant portion of the market share, estimated at xx% and xx%, respectively, in 2025. Other key players individually possess a smaller but impactful market presence.
- Innovation Drivers: Technological advancements in communication technologies (e.g., narrowband IoT, cellular), improved data analytics capabilities, and the increasing demand for grid modernization drive continuous innovation in the market.
- Regulatory Frameworks: Government incentives and regulations promoting energy efficiency and grid modernization significantly influence the adoption of smart meters, driving market growth.
- Product Substitutes: Although limited, conventional metering systems remain a substitute, but their limitations in terms of data acquisition and remote management gradually reduce their market appeal.
- End-User Trends: The increasing awareness of energy consumption and the desire for better energy management among residential consumers fuel the demand for smart meters. The adoption of smart home technologies further enhances this trend.
- M&A Activities: The significant M&A activity reflects the strategic imperative to gain a competitive edge and consolidate market share in this rapidly evolving landscape. Many deals, though not publicly disclosed in full detail, are in the xx - xx Million range per transaction.
US Residential Smart Meters Market Industry Trends & Insights
The US residential smart meters market is experiencing robust growth, with a Compound Annual Growth Rate (CAGR) projected at xx% during the forecast period (2025-2033). Several factors contribute to this growth trajectory: increasing government support for smart grid initiatives, rising demand for energy efficiency solutions, improvements in smart meter technology, and the growing adoption of smart home technologies. Market penetration is steadily increasing, with xx% of households expected to be equipped with smart meters by 2033. Technological advancements, such as the adoption of advanced communication technologies (e.g., LTE-M, NB-IoT) and improved data analytics capabilities, are reshaping the market landscape. Consumer preferences are shifting towards more energy-efficient and user-friendly smart meter solutions that enable better energy monitoring and management. The competitive landscape is intensifying, with companies focusing on product differentiation, strategic partnerships, and technological innovations.
Dominant Markets & Segments in US Residential Smart Meters Market
The US residential smart meters market shows significant growth across various segments. However, several segments show particularly strong performance:
- Dominant Region/Country: The Southwest and Western regions of the United States demonstrate the strongest growth, driven by favourable regulatory policies, significant investments in grid modernization, and a higher adoption rate of smart home technologies.
- Dominant Type: Electric smart meters represent the largest segment, owing to the widespread use of electricity in households and government support for energy efficiency improvement projects.
- Dominant Communication Technology: Wireless smart meters are experiencing faster adoption due to their ease of installation, scalability, and cost-effectiveness compared to wired solutions.
- Dominant Application: Energy monitoring remains the primary application, with increasing consumer interest in tracking energy consumption to reduce bills and adopt more sustainable practices. Outage management and demand response are also showing significant growth, with utilities leveraging smart meters to enhance operational efficiency and improve grid reliability.
Key Drivers (across all segments):
- Favorable Government Policies: Federal and state incentives and regulations promoting energy efficiency and smart grid development significantly fuel market expansion.
- Robust Infrastructure: Existing power grids offer opportunities for smart meter integration, facilitating wider adoption.
- Rising Energy Costs: High energy costs incentivize consumers and businesses to adopt solutions that improve energy management and efficiency.
US Residential Smart Meters Market Product Developments
Recent product innovations focus on enhancing communication technologies (e.g., LTE-M, NB-IoT), improving data analytics capabilities, and incorporating advanced security features. These developments aim to improve accuracy, reliability, and security, creating a better user experience and supporting advanced grid management functions such as demand response and outage management. Companies are increasingly integrating smart meters with other smart home devices and platforms, expanding their functionalities and market appeal.
Report Scope & Segmentation Analysis
This report comprehensively analyzes the US residential smart meters market across various segments:
Type: Electric smart meters (growing at xx% CAGR), Gas smart meters (growing at xx% CAGR). Electric meters dominate the market due to higher electricity consumption and government initiatives promoting energy efficiency. Gas meter adoption is also seeing steady growth due to increasing awareness of energy conservation and government incentives.
Communication Technology: Wireless smart meters (faster growth due to ease of deployment and lower costs) and Wired smart meters (stable growth with limited expansion).
Application: Energy monitoring (highest market share due to consumer demand), Outage management (significant growth potential driven by utility needs), Demand response (growing adoption for grid stabilization and improved energy efficiency).
Each segment showcases unique growth projections, market sizes, and competitive dynamics. The analysis incorporates market size estimations for each segment for 2025 and future years.
Key Drivers of US Residential Smart Meters Market Growth
Several factors drive the growth of the US residential smart meters market:
- Technological Advancements: The continuous evolution of communication technologies, data analytics, and security features enhances the capabilities of smart meters, thereby increasing their appeal.
- Government Regulations and Incentives: Policies focused on energy efficiency and grid modernization create favourable conditions for widespread adoption. Federal and state-level programs incentivize smart meter deployment.
- Increasing Energy Costs: High energy costs motivate consumers and utilities to implement smart meter solutions to optimize energy use and reduce bills.
Challenges in the US Residential Smart Meters Market Sector
Despite the considerable growth opportunities, the market faces challenges:
- High Initial Investment Costs: The initial investment for smart meter installation can be substantial for both utilities and consumers, potentially slowing down widespread adoption.
- Cybersecurity Concerns: Concerns about data security and the potential for cyberattacks may hinder widespread adoption if not effectively addressed.
- Interoperability Issues: Inconsistent communication standards across different smart meter systems can complicate integration and data management. This may require costly upgrades or system replacements.
Emerging Opportunities in US Residential Smart Meters Market
Emerging opportunities include:
- Integration with Smart Home Ecosystems: Integrating smart meters with other smart home devices creates a more comprehensive and user-friendly experience, potentially boosting adoption rates.
- Advancements in Data Analytics: Leveraging advanced data analytics to provide personalized energy consumption feedback to consumers can promote more efficient energy use and improve customer engagement.
- Expansion into Rural Areas: Expanding smart meter deployment to underserved rural communities presents a significant opportunity for market expansion, particularly with improved wireless communication technologies.
Leading Players in the US Residential Smart Meters Market Market
- Itron Inc
- Badger Meter Inc
- Elster Group GmbH (Honeywell International Inc)
- Wasion Holdings Limited
- Kamstrup A/S
- Neptune Technology Group Inc
- Sensus USA Inc (Xylem Inc)
- Aclara Technologies Inc (Hubbel Inc)
- Landis+GYR Group AG
- General Electric Company
- Diehl Metering U S
- Mueller Systems LLC
Key Developments in US Residential Smart Meters Market Industry
- September 2023: Southwestern Electric Power Co. announced the installation of smart meters for approximately 234,000 Louisiana customers, highlighting the ongoing expansion of smart meter deployments.
- August 2023: Rankin Road West MUD partnered with WasteWater Management Services and Accurate Meter to implement smart water meters, demonstrating the expansion of smart metering beyond electricity.
Strategic Outlook for US Residential Smart Meters Market Market
The US residential smart meters market is poised for sustained growth, driven by continuous technological innovations, favorable government policies, and increasing consumer awareness of energy efficiency. The integration of smart meters with broader smart home ecosystems and the expansion of advanced data analytics capabilities will further propel market expansion. Opportunities exist for companies to innovate in areas such as improved cybersecurity, enhanced data privacy, and cost-effective installation solutions to overcome existing challenges and capture significant market share.
US Residential Smart Meters Market Segmentation
-
1. Type
- 1.1. Electric smart meters
- 1.2. Gas smart meters
- 1.3. Communication
-
2. Technology
- 2.1. Wireless smart meters
- 2.2. Wired smart meters
-
3. Application
- 3.1. Energy monitoring
- 3.2. Outage management
- 3.3. Demand response
US Residential Smart Meters Market Segmentation By Geography
-
1. North America
- 1.1. United States
- 1.2. Canada
- 1.3. Mexico
-
2. South America
- 2.1. Brazil
- 2.2. Argentina
- 2.3. Rest of South America
-
3. Europe
- 3.1. United Kingdom
- 3.2. Germany
- 3.3. France
- 3.4. Italy
- 3.5. Spain
- 3.6. Russia
- 3.7. Benelux
- 3.8. Nordics
- 3.9. Rest of Europe
-
4. Middle East & Africa
- 4.1. Turkey
- 4.2. Israel
- 4.3. GCC
- 4.4. North Africa
- 4.5. South Africa
- 4.6. Rest of Middle East & Africa
-
5. Asia Pacific
- 5.1. China
- 5.2. India
- 5.3. Japan
- 5.4. South Korea
- 5.5. ASEAN
- 5.6. Oceania
- 5.7. Rest of Asia Pacific
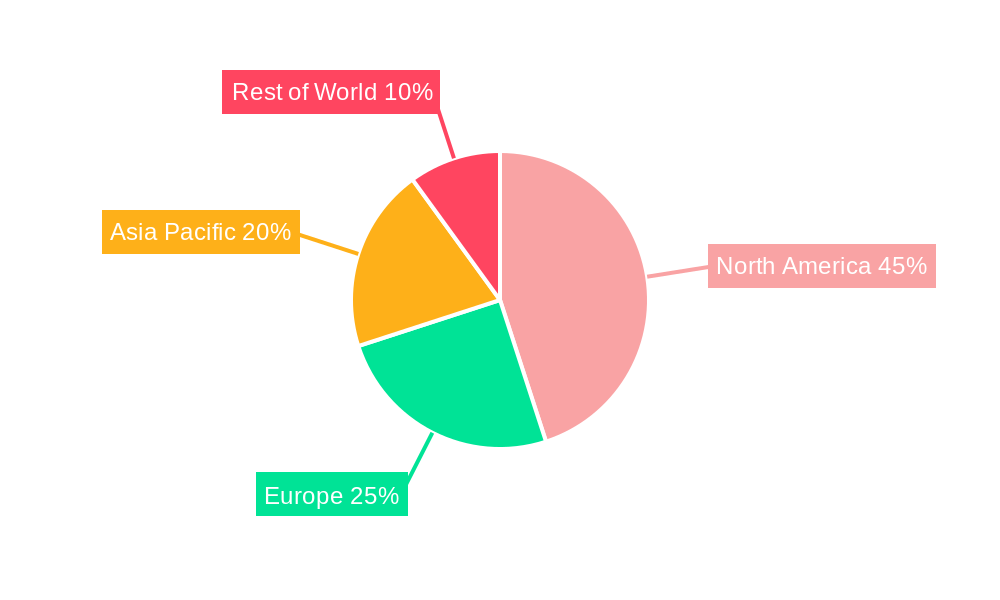
US Residential Smart Meters Market Regional Market Share
Geographic Coverage of US Residential Smart Meters Market
US Residential Smart Meters Market REPORT HIGHLIGHTS
| Aspects | Details |
|---|---|
| Study Period | 2020-2034 |
| Base Year | 2025 |
| Estimated Year | 2026 |
| Forecast Period | 2026-2034 |
| Historical Period | 2020-2025 |
| Growth Rate | CAGR of 6.32% from 2020-2034 |
| Segmentation |
|
Table of Contents
- 1. Introduction
- 1.1. Research Scope
- 1.2. Market Segmentation
- 1.3. Research Objective
- 1.4. Definitions and Assumptions
- 2. Executive Summary
- 2.1. Market Snapshot
- 3. Market Dynamics
- 3.1. Market Drivers
- 3.2. Market Restrains
- 3.3. Market Trends
- 3.4. Market Opportunities
- 4. Market Factor Analysis
- 4.1. Porters Five Forces
- 4.1.1. Bargaining Power of Suppliers
- 4.1.2. Bargaining Power of Buyers
- 4.1.3. Threat of New Entrants
- 4.1.4. Threat of Substitutes
- 4.1.5. Competitive Rivalry
- 4.2. PESTEL analysis
- 4.3. BCG Analysis
- 4.3.1. Stars (High Growth, High Market Share)
- 4.3.2. Cash Cows (Low Growth, High Market Share)
- 4.3.3. Question Mark (High Growth, Low Market Share)
- 4.3.4. Dogs (Low Growth, Low Market Share)
- 4.4. Ansoff Matrix Analysis
- 4.5. Supply Chain Analysis
- 4.6. Regulatory Landscape
- 4.7. Current Market Potential and Opportunity Assessment (TAM–SAM–SOM Framework)
- 4.8. RAX Analyst Note
- 4.1. Porters Five Forces
- 5. Market Analysis, Insights and Forecast 2021-2033
- 5.1. Market Analysis, Insights and Forecast - by Type
- 5.1.1. Electric smart meters
- 5.1.2. Gas smart meters
- 5.1.3. Communication
- 5.2. Market Analysis, Insights and Forecast - by Technology
- 5.2.1. Wireless smart meters
- 5.2.2. Wired smart meters
- 5.3. Market Analysis, Insights and Forecast - by Application
- 5.3.1. Energy monitoring
- 5.3.2. Outage management
- 5.3.3. Demand response
- 5.4. Market Analysis, Insights and Forecast - by Region
- 5.4.1. North America
- 5.4.2. South America
- 5.4.3. Europe
- 5.4.4. Middle East & Africa
- 5.4.5. Asia Pacific
- 5.1. Market Analysis, Insights and Forecast - by Type
- 6. Global US Residential Smart Meters Market Analysis, Insights and Forecast, 2021-2033
- 6.1. Market Analysis, Insights and Forecast - by Type
- 6.1.1. Electric smart meters
- 6.1.2. Gas smart meters
- 6.1.3. Communication
- 6.2. Market Analysis, Insights and Forecast - by Technology
- 6.2.1. Wireless smart meters
- 6.2.2. Wired smart meters
- 6.3. Market Analysis, Insights and Forecast - by Application
- 6.3.1. Energy monitoring
- 6.3.2. Outage management
- 6.3.3. Demand response
- 6.1. Market Analysis, Insights and Forecast - by Type
- 7. North America US Residential Smart Meters Market Analysis, Insights and Forecast, 2020-2032
- 7.1. Market Analysis, Insights and Forecast - by Type
- 7.1.1. Electric smart meters
- 7.1.2. Gas smart meters
- 7.1.3. Communication
- 7.2. Market Analysis, Insights and Forecast - by Technology
- 7.2.1. Wireless smart meters
- 7.2.2. Wired smart meters
- 7.3. Market Analysis, Insights and Forecast - by Application
- 7.3.1. Energy monitoring
- 7.3.2. Outage management
- 7.3.3. Demand response
- 7.1. Market Analysis, Insights and Forecast - by Type
- 8. South America US Residential Smart Meters Market Analysis, Insights and Forecast, 2020-2032
- 8.1. Market Analysis, Insights and Forecast - by Type
- 8.1.1. Electric smart meters
- 8.1.2. Gas smart meters
- 8.1.3. Communication
- 8.2. Market Analysis, Insights and Forecast - by Technology
- 8.2.1. Wireless smart meters
- 8.2.2. Wired smart meters
- 8.3. Market Analysis, Insights and Forecast - by Application
- 8.3.1. Energy monitoring
- 8.3.2. Outage management
- 8.3.3. Demand response
- 8.1. Market Analysis, Insights and Forecast - by Type
- 9. Europe US Residential Smart Meters Market Analysis, Insights and Forecast, 2020-2032
- 9.1. Market Analysis, Insights and Forecast - by Type
- 9.1.1. Electric smart meters
- 9.1.2. Gas smart meters
- 9.1.3. Communication
- 9.2. Market Analysis, Insights and Forecast - by Technology
- 9.2.1. Wireless smart meters
- 9.2.2. Wired smart meters
- 9.3. Market Analysis, Insights and Forecast - by Application
- 9.3.1. Energy monitoring
- 9.3.2. Outage management
- 9.3.3. Demand response
- 9.1. Market Analysis, Insights and Forecast - by Type
- 10. Middle East & Africa US Residential Smart Meters Market Analysis, Insights and Forecast, 2020-2032
- 10.1. Market Analysis, Insights and Forecast - by Type
- 10.1.1. Electric smart meters
- 10.1.2. Gas smart meters
- 10.1.3. Communication
- 10.2. Market Analysis, Insights and Forecast - by Technology
- 10.2.1. Wireless smart meters
- 10.2.2. Wired smart meters
- 10.3. Market Analysis, Insights and Forecast - by Application
- 10.3.1. Energy monitoring
- 10.3.2. Outage management
- 10.3.3. Demand response
- 10.1. Market Analysis, Insights and Forecast - by Type
- 11. Asia Pacific US Residential Smart Meters Market Analysis, Insights and Forecast, 2020-2032
- 11.1. Market Analysis, Insights and Forecast - by Type
- 11.1.1. Electric smart meters
- 11.1.2. Gas smart meters
- 11.1.3. Communication
- 11.2. Market Analysis, Insights and Forecast - by Technology
- 11.2.1. Wireless smart meters
- 11.2.2. Wired smart meters
- 11.3. Market Analysis, Insights and Forecast - by Application
- 11.3.1. Energy monitoring
- 11.3.2. Outage management
- 11.3.3. Demand response
- 11.1. Market Analysis, Insights and Forecast - by Type
- 12. Competitive Analysis
- 12.1. Company Profiles
- 12.1.1 Itron Inc
- 12.1.1.1. Company Overview
- 12.1.1.2. Products
- 12.1.1.3. Company Financials
- 12.1.1.4. SWOT Analysis
- 12.1.2 Badger Meter Inc
- 12.1.2.1. Company Overview
- 12.1.2.2. Products
- 12.1.2.3. Company Financials
- 12.1.2.4. SWOT Analysis
- 12.1.3 Elster Group GmbH (Honeywell International Inc)
- 12.1.3.1. Company Overview
- 12.1.3.2. Products
- 12.1.3.3. Company Financials
- 12.1.3.4. SWOT Analysis
- 12.1.4 Wasion Holdings Limited
- 12.1.4.1. Company Overview
- 12.1.4.2. Products
- 12.1.4.3. Company Financials
- 12.1.4.4. SWOT Analysis
- 12.1.5 Kamstrup A/S
- 12.1.5.1. Company Overview
- 12.1.5.2. Products
- 12.1.5.3. Company Financials
- 12.1.5.4. SWOT Analysis
- 12.1.6 Neptune Technology Group Inc
- 12.1.6.1. Company Overview
- 12.1.6.2. Products
- 12.1.6.3. Company Financials
- 12.1.6.4. SWOT Analysis
- 12.1.7 Sensus USA Inc (Xylem Inc )
- 12.1.7.1. Company Overview
- 12.1.7.2. Products
- 12.1.7.3. Company Financials
- 12.1.7.4. SWOT Analysis
- 12.1.8 Aclara Technologies Inc (Hubbel Inc )
- 12.1.8.1. Company Overview
- 12.1.8.2. Products
- 12.1.8.3. Company Financials
- 12.1.8.4. SWOT Analysis
- 12.1.9 Landis+GYR Group AG
- 12.1.9.1. Company Overview
- 12.1.9.2. Products
- 12.1.9.3. Company Financials
- 12.1.9.4. SWOT Analysis
- 12.1.10 General Electric Company
- 12.1.10.1. Company Overview
- 12.1.10.2. Products
- 12.1.10.3. Company Financials
- 12.1.10.4. SWOT Analysis
- 12.1.11 Diehl Metering U S
- 12.1.11.1. Company Overview
- 12.1.11.2. Products
- 12.1.11.3. Company Financials
- 12.1.11.4. SWOT Analysis
- 12.1.12 Mueller Systems LLC
- 12.1.12.1. Company Overview
- 12.1.12.2. Products
- 12.1.12.3. Company Financials
- 12.1.12.4. SWOT Analysis
- 12.1.1 Itron Inc
- 12.2. Market Entropy
- 12.2.1 Company's Key Areas Served
- 12.2.2 Recent Developments
- 12.3. Company Market Share Analysis 2025
- 12.3.1 Top 5 Companies Market Share Analysis
- 12.3.2 Top 3 Companies Market Share Analysis
- 12.4. List of Potential Customers
- 13. Research Methodology
List of Figures
- Figure 1: Global US Residential Smart Meters Market Revenue Breakdown (million, %) by Region 2025 & 2033
- Figure 2: Global US Residential Smart Meters Market Volume Breakdown (Million, %) by Region 2025 & 2033
- Figure 3: North America US Residential Smart Meters Market Revenue (million), by Type 2025 & 2033
- Figure 4: North America US Residential Smart Meters Market Volume (Million), by Type 2025 & 2033
- Figure 5: North America US Residential Smart Meters Market Revenue Share (%), by Type 2025 & 2033
- Figure 6: North America US Residential Smart Meters Market Volume Share (%), by Type 2025 & 2033
- Figure 7: North America US Residential Smart Meters Market Revenue (million), by Technology 2025 & 2033
- Figure 8: North America US Residential Smart Meters Market Volume (Million), by Technology 2025 & 2033
- Figure 9: North America US Residential Smart Meters Market Revenue Share (%), by Technology 2025 & 2033
- Figure 10: North America US Residential Smart Meters Market Volume Share (%), by Technology 2025 & 2033
- Figure 11: North America US Residential Smart Meters Market Revenue (million), by Application 2025 & 2033
- Figure 12: North America US Residential Smart Meters Market Volume (Million), by Application 2025 & 2033
- Figure 13: North America US Residential Smart Meters Market Revenue Share (%), by Application 2025 & 2033
- Figure 14: North America US Residential Smart Meters Market Volume Share (%), by Application 2025 & 2033
- Figure 15: North America US Residential Smart Meters Market Revenue (million), by Country 2025 & 2033
- Figure 16: North America US Residential Smart Meters Market Volume (Million), by Country 2025 & 2033
- Figure 17: North America US Residential Smart Meters Market Revenue Share (%), by Country 2025 & 2033
- Figure 18: North America US Residential Smart Meters Market Volume Share (%), by Country 2025 & 2033
- Figure 19: South America US Residential Smart Meters Market Revenue (million), by Type 2025 & 2033
- Figure 20: South America US Residential Smart Meters Market Volume (Million), by Type 2025 & 2033
- Figure 21: South America US Residential Smart Meters Market Revenue Share (%), by Type 2025 & 2033
- Figure 22: South America US Residential Smart Meters Market Volume Share (%), by Type 2025 & 2033
- Figure 23: South America US Residential Smart Meters Market Revenue (million), by Technology 2025 & 2033
- Figure 24: South America US Residential Smart Meters Market Volume (Million), by Technology 2025 & 2033
- Figure 25: South America US Residential Smart Meters Market Revenue Share (%), by Technology 2025 & 2033
- Figure 26: South America US Residential Smart Meters Market Volume Share (%), by Technology 2025 & 2033
- Figure 27: South America US Residential Smart Meters Market Revenue (million), by Application 2025 & 2033
- Figure 28: South America US Residential Smart Meters Market Volume (Million), by Application 2025 & 2033
- Figure 29: South America US Residential Smart Meters Market Revenue Share (%), by Application 2025 & 2033
- Figure 30: South America US Residential Smart Meters Market Volume Share (%), by Application 2025 & 2033
- Figure 31: South America US Residential Smart Meters Market Revenue (million), by Country 2025 & 2033
- Figure 32: South America US Residential Smart Meters Market Volume (Million), by Country 2025 & 2033
- Figure 33: South America US Residential Smart Meters Market Revenue Share (%), by Country 2025 & 2033
- Figure 34: South America US Residential Smart Meters Market Volume Share (%), by Country 2025 & 2033
- Figure 35: Europe US Residential Smart Meters Market Revenue (million), by Type 2025 & 2033
- Figure 36: Europe US Residential Smart Meters Market Volume (Million), by Type 2025 & 2033
- Figure 37: Europe US Residential Smart Meters Market Revenue Share (%), by Type 2025 & 2033
- Figure 38: Europe US Residential Smart Meters Market Volume Share (%), by Type 2025 & 2033
- Figure 39: Europe US Residential Smart Meters Market Revenue (million), by Technology 2025 & 2033
- Figure 40: Europe US Residential Smart Meters Market Volume (Million), by Technology 2025 & 2033
- Figure 41: Europe US Residential Smart Meters Market Revenue Share (%), by Technology 2025 & 2033
- Figure 42: Europe US Residential Smart Meters Market Volume Share (%), by Technology 2025 & 2033
- Figure 43: Europe US Residential Smart Meters Market Revenue (million), by Application 2025 & 2033
- Figure 44: Europe US Residential Smart Meters Market Volume (Million), by Application 2025 & 2033
- Figure 45: Europe US Residential Smart Meters Market Revenue Share (%), by Application 2025 & 2033
- Figure 46: Europe US Residential Smart Meters Market Volume Share (%), by Application 2025 & 2033
- Figure 47: Europe US Residential Smart Meters Market Revenue (million), by Country 2025 & 2033
- Figure 48: Europe US Residential Smart Meters Market Volume (Million), by Country 2025 & 2033
- Figure 49: Europe US Residential Smart Meters Market Revenue Share (%), by Country 2025 & 2033
- Figure 50: Europe US Residential Smart Meters Market Volume Share (%), by Country 2025 & 2033
- Figure 51: Middle East & Africa US Residential Smart Meters Market Revenue (million), by Type 2025 & 2033
- Figure 52: Middle East & Africa US Residential Smart Meters Market Volume (Million), by Type 2025 & 2033
- Figure 53: Middle East & Africa US Residential Smart Meters Market Revenue Share (%), by Type 2025 & 2033
- Figure 54: Middle East & Africa US Residential Smart Meters Market Volume Share (%), by Type 2025 & 2033
- Figure 55: Middle East & Africa US Residential Smart Meters Market Revenue (million), by Technology 2025 & 2033
- Figure 56: Middle East & Africa US Residential Smart Meters Market Volume (Million), by Technology 2025 & 2033
- Figure 57: Middle East & Africa US Residential Smart Meters Market Revenue Share (%), by Technology 2025 & 2033
- Figure 58: Middle East & Africa US Residential Smart Meters Market Volume Share (%), by Technology 2025 & 2033
- Figure 59: Middle East & Africa US Residential Smart Meters Market Revenue (million), by Application 2025 & 2033
- Figure 60: Middle East & Africa US Residential Smart Meters Market Volume (Million), by Application 2025 & 2033
- Figure 61: Middle East & Africa US Residential Smart Meters Market Revenue Share (%), by Application 2025 & 2033
- Figure 62: Middle East & Africa US Residential Smart Meters Market Volume Share (%), by Application 2025 & 2033
- Figure 63: Middle East & Africa US Residential Smart Meters Market Revenue (million), by Country 2025 & 2033
- Figure 64: Middle East & Africa US Residential Smart Meters Market Volume (Million), by Country 2025 & 2033
- Figure 65: Middle East & Africa US Residential Smart Meters Market Revenue Share (%), by Country 2025 & 2033
- Figure 66: Middle East & Africa US Residential Smart Meters Market Volume Share (%), by Country 2025 & 2033
- Figure 67: Asia Pacific US Residential Smart Meters Market Revenue (million), by Type 2025 & 2033
- Figure 68: Asia Pacific US Residential Smart Meters Market Volume (Million), by Type 2025 & 2033
- Figure 69: Asia Pacific US Residential Smart Meters Market Revenue Share (%), by Type 2025 & 2033
- Figure 70: Asia Pacific US Residential Smart Meters Market Volume Share (%), by Type 2025 & 2033
- Figure 71: Asia Pacific US Residential Smart Meters Market Revenue (million), by Technology 2025 & 2033
- Figure 72: Asia Pacific US Residential Smart Meters Market Volume (Million), by Technology 2025 & 2033
- Figure 73: Asia Pacific US Residential Smart Meters Market Revenue Share (%), by Technology 2025 & 2033
- Figure 74: Asia Pacific US Residential Smart Meters Market Volume Share (%), by Technology 2025 & 2033
- Figure 75: Asia Pacific US Residential Smart Meters Market Revenue (million), by Application 2025 & 2033
- Figure 76: Asia Pacific US Residential Smart Meters Market Volume (Million), by Application 2025 & 2033
- Figure 77: Asia Pacific US Residential Smart Meters Market Revenue Share (%), by Application 2025 & 2033
- Figure 78: Asia Pacific US Residential Smart Meters Market Volume Share (%), by Application 2025 & 2033
- Figure 79: Asia Pacific US Residential Smart Meters Market Revenue (million), by Country 2025 & 2033
- Figure 80: Asia Pacific US Residential Smart Meters Market Volume (Million), by Country 2025 & 2033
- Figure 81: Asia Pacific US Residential Smart Meters Market Revenue Share (%), by Country 2025 & 2033
- Figure 82: Asia Pacific US Residential Smart Meters Market Volume Share (%), by Country 2025 & 2033
List of Tables
- Table 1: Global US Residential Smart Meters Market Revenue million Forecast, by Type 2020 & 2033
- Table 2: Global US Residential Smart Meters Market Volume Million Forecast, by Type 2020 & 2033
- Table 3: Global US Residential Smart Meters Market Revenue million Forecast, by Technology 2020 & 2033
- Table 4: Global US Residential Smart Meters Market Volume Million Forecast, by Technology 2020 & 2033
- Table 5: Global US Residential Smart Meters Market Revenue million Forecast, by Application 2020 & 2033
- Table 6: Global US Residential Smart Meters Market Volume Million Forecast, by Application 2020 & 2033
- Table 7: Global US Residential Smart Meters Market Revenue million Forecast, by Region 2020 & 2033
- Table 8: Global US Residential Smart Meters Market Volume Million Forecast, by Region 2020 & 2033
- Table 9: Global US Residential Smart Meters Market Revenue million Forecast, by Type 2020 & 2033
- Table 10: Global US Residential Smart Meters Market Volume Million Forecast, by Type 2020 & 2033
- Table 11: Global US Residential Smart Meters Market Revenue million Forecast, by Technology 2020 & 2033
- Table 12: Global US Residential Smart Meters Market Volume Million Forecast, by Technology 2020 & 2033
- Table 13: Global US Residential Smart Meters Market Revenue million Forecast, by Application 2020 & 2033
- Table 14: Global US Residential Smart Meters Market Volume Million Forecast, by Application 2020 & 2033
- Table 15: Global US Residential Smart Meters Market Revenue million Forecast, by Country 2020 & 2033
- Table 16: Global US Residential Smart Meters Market Volume Million Forecast, by Country 2020 & 2033
- Table 17: United States US Residential Smart Meters Market Revenue (million) Forecast, by Application 2020 & 2033
- Table 18: United States US Residential Smart Meters Market Volume (Million) Forecast, by Application 2020 & 2033
- Table 19: Canada US Residential Smart Meters Market Revenue (million) Forecast, by Application 2020 & 2033
- Table 20: Canada US Residential Smart Meters Market Volume (Million) Forecast, by Application 2020 & 2033
- Table 21: Mexico US Residential Smart Meters Market Revenue (million) Forecast, by Application 2020 & 2033
- Table 22: Mexico US Residential Smart Meters Market Volume (Million) Forecast, by Application 2020 & 2033
- Table 23: Global US Residential Smart Meters Market Revenue million Forecast, by Type 2020 & 2033
- Table 24: Global US Residential Smart Meters Market Volume Million Forecast, by Type 2020 & 2033
- Table 25: Global US Residential Smart Meters Market Revenue million Forecast, by Technology 2020 & 2033
- Table 26: Global US Residential Smart Meters Market Volume Million Forecast, by Technology 2020 & 2033
- Table 27: Global US Residential Smart Meters Market Revenue million Forecast, by Application 2020 & 2033
- Table 28: Global US Residential Smart Meters Market Volume Million Forecast, by Application 2020 & 2033
- Table 29: Global US Residential Smart Meters Market Revenue million Forecast, by Country 2020 & 2033
- Table 30: Global US Residential Smart Meters Market Volume Million Forecast, by Country 2020 & 2033
- Table 31: Brazil US Residential Smart Meters Market Revenue (million) Forecast, by Application 2020 & 2033
- Table 32: Brazil US Residential Smart Meters Market Volume (Million) Forecast, by Application 2020 & 2033
- Table 33: Argentina US Residential Smart Meters Market Revenue (million) Forecast, by Application 2020 & 2033
- Table 34: Argentina US Residential Smart Meters Market Volume (Million) Forecast, by Application 2020 & 2033
- Table 35: Rest of South America US Residential Smart Meters Market Revenue (million) Forecast, by Application 2020 & 2033
- Table 36: Rest of South America US Residential Smart Meters Market Volume (Million) Forecast, by Application 2020 & 2033
- Table 37: Global US Residential Smart Meters Market Revenue million Forecast, by Type 2020 & 2033
- Table 38: Global US Residential Smart Meters Market Volume Million Forecast, by Type 2020 & 2033
- Table 39: Global US Residential Smart Meters Market Revenue million Forecast, by Technology 2020 & 2033
- Table 40: Global US Residential Smart Meters Market Volume Million Forecast, by Technology 2020 & 2033
- Table 41: Global US Residential Smart Meters Market Revenue million Forecast, by Application 2020 & 2033
- Table 42: Global US Residential Smart Meters Market Volume Million Forecast, by Application 2020 & 2033
- Table 43: Global US Residential Smart Meters Market Revenue million Forecast, by Country 2020 & 2033
- Table 44: Global US Residential Smart Meters Market Volume Million Forecast, by Country 2020 & 2033
- Table 45: United Kingdom US Residential Smart Meters Market Revenue (million) Forecast, by Application 2020 & 2033
- Table 46: United Kingdom US Residential Smart Meters Market Volume (Million) Forecast, by Application 2020 & 2033
- Table 47: Germany US Residential Smart Meters Market Revenue (million) Forecast, by Application 2020 & 2033
- Table 48: Germany US Residential Smart Meters Market Volume (Million) Forecast, by Application 2020 & 2033
- Table 49: France US Residential Smart Meters Market Revenue (million) Forecast, by Application 2020 & 2033
- Table 50: France US Residential Smart Meters Market Volume (Million) Forecast, by Application 2020 & 2033
- Table 51: Italy US Residential Smart Meters Market Revenue (million) Forecast, by Application 2020 & 2033
- Table 52: Italy US Residential Smart Meters Market Volume (Million) Forecast, by Application 2020 & 2033
- Table 53: Spain US Residential Smart Meters Market Revenue (million) Forecast, by Application 2020 & 2033
- Table 54: Spain US Residential Smart Meters Market Volume (Million) Forecast, by Application 2020 & 2033
- Table 55: Russia US Residential Smart Meters Market Revenue (million) Forecast, by Application 2020 & 2033
- Table 56: Russia US Residential Smart Meters Market Volume (Million) Forecast, by Application 2020 & 2033
- Table 57: Benelux US Residential Smart Meters Market Revenue (million) Forecast, by Application 2020 & 2033
- Table 58: Benelux US Residential Smart Meters Market Volume (Million) Forecast, by Application 2020 & 2033
- Table 59: Nordics US Residential Smart Meters Market Revenue (million) Forecast, by Application 2020 & 2033
- Table 60: Nordics US Residential Smart Meters Market Volume (Million) Forecast, by Application 2020 & 2033
- Table 61: Rest of Europe US Residential Smart Meters Market Revenue (million) Forecast, by Application 2020 & 2033
- Table 62: Rest of Europe US Residential Smart Meters Market Volume (Million) Forecast, by Application 2020 & 2033
- Table 63: Global US Residential Smart Meters Market Revenue million Forecast, by Type 2020 & 2033
- Table 64: Global US Residential Smart Meters Market Volume Million Forecast, by Type 2020 & 2033
- Table 65: Global US Residential Smart Meters Market Revenue million Forecast, by Technology 2020 & 2033
- Table 66: Global US Residential Smart Meters Market Volume Million Forecast, by Technology 2020 & 2033
- Table 67: Global US Residential Smart Meters Market Revenue million Forecast, by Application 2020 & 2033
- Table 68: Global US Residential Smart Meters Market Volume Million Forecast, by Application 2020 & 2033
- Table 69: Global US Residential Smart Meters Market Revenue million Forecast, by Country 2020 & 2033
- Table 70: Global US Residential Smart Meters Market Volume Million Forecast, by Country 2020 & 2033
- Table 71: Turkey US Residential Smart Meters Market Revenue (million) Forecast, by Application 2020 & 2033
- Table 72: Turkey US Residential Smart Meters Market Volume (Million) Forecast, by Application 2020 & 2033
- Table 73: Israel US Residential Smart Meters Market Revenue (million) Forecast, by Application 2020 & 2033
- Table 74: Israel US Residential Smart Meters Market Volume (Million) Forecast, by Application 2020 & 2033
- Table 75: GCC US Residential Smart Meters Market Revenue (million) Forecast, by Application 2020 & 2033
- Table 76: GCC US Residential Smart Meters Market Volume (Million) Forecast, by Application 2020 & 2033
- Table 77: North Africa US Residential Smart Meters Market Revenue (million) Forecast, by Application 2020 & 2033
- Table 78: North Africa US Residential Smart Meters Market Volume (Million) Forecast, by Application 2020 & 2033
- Table 79: South Africa US Residential Smart Meters Market Revenue (million) Forecast, by Application 2020 & 2033
- Table 80: South Africa US Residential Smart Meters Market Volume (Million) Forecast, by Application 2020 & 2033
- Table 81: Rest of Middle East & Africa US Residential Smart Meters Market Revenue (million) Forecast, by Application 2020 & 2033
- Table 82: Rest of Middle East & Africa US Residential Smart Meters Market Volume (Million) Forecast, by Application 2020 & 2033
- Table 83: Global US Residential Smart Meters Market Revenue million Forecast, by Type 2020 & 2033
- Table 84: Global US Residential Smart Meters Market Volume Million Forecast, by Type 2020 & 2033
- Table 85: Global US Residential Smart Meters Market Revenue million Forecast, by Technology 2020 & 2033
- Table 86: Global US Residential Smart Meters Market Volume Million Forecast, by Technology 2020 & 2033
- Table 87: Global US Residential Smart Meters Market Revenue million Forecast, by Application 2020 & 2033
- Table 88: Global US Residential Smart Meters Market Volume Million Forecast, by Application 2020 & 2033
- Table 89: Global US Residential Smart Meters Market Revenue million Forecast, by Country 2020 & 2033
- Table 90: Global US Residential Smart Meters Market Volume Million Forecast, by Country 2020 & 2033
- Table 91: China US Residential Smart Meters Market Revenue (million) Forecast, by Application 2020 & 2033
- Table 92: China US Residential Smart Meters Market Volume (Million) Forecast, by Application 2020 & 2033
- Table 93: India US Residential Smart Meters Market Revenue (million) Forecast, by Application 2020 & 2033
- Table 94: India US Residential Smart Meters Market Volume (Million) Forecast, by Application 2020 & 2033
- Table 95: Japan US Residential Smart Meters Market Revenue (million) Forecast, by Application 2020 & 2033
- Table 96: Japan US Residential Smart Meters Market Volume (Million) Forecast, by Application 2020 & 2033
- Table 97: South Korea US Residential Smart Meters Market Revenue (million) Forecast, by Application 2020 & 2033
- Table 98: South Korea US Residential Smart Meters Market Volume (Million) Forecast, by Application 2020 & 2033
- Table 99: ASEAN US Residential Smart Meters Market Revenue (million) Forecast, by Application 2020 & 2033
- Table 100: ASEAN US Residential Smart Meters Market Volume (Million) Forecast, by Application 2020 & 2033
- Table 101: Oceania US Residential Smart Meters Market Revenue (million) Forecast, by Application 2020 & 2033
- Table 102: Oceania US Residential Smart Meters Market Volume (Million) Forecast, by Application 2020 & 2033
- Table 103: Rest of Asia Pacific US Residential Smart Meters Market Revenue (million) Forecast, by Application 2020 & 2033
- Table 104: Rest of Asia Pacific US Residential Smart Meters Market Volume (Million) Forecast, by Application 2020 & 2033
Frequently Asked Questions
1. What is the projected Compound Annual Growth Rate (CAGR) of the US Residential Smart Meters Market?
The projected CAGR is approximately 6.32%.
2. Which companies are prominent players in the US Residential Smart Meters Market?
Key companies in the market include Itron Inc, Badger Meter Inc, Elster Group GmbH (Honeywell International Inc), Wasion Holdings Limited, Kamstrup A/S, Neptune Technology Group Inc, Sensus USA Inc (Xylem Inc ), Aclara Technologies Inc (Hubbel Inc ), Landis+GYR Group AG, General Electric Company, Diehl Metering U S, Mueller Systems LLC.
3. What are the main segments of the US Residential Smart Meters Market?
The market segments include Type, Technology, Application.
4. Can you provide details about the market size?
The market size is estimated to be USD 98.93 million as of 2022.
5. What are some drivers contributing to market growth?
Increased Investments in Smart Grid Projects; Growth in Smart City Deployment.
6. What are the notable trends driving market growth?
Increased Investments in Smart Grid Projects to Drive the Market.
7. Are there any restraints impacting market growth?
High Installation Cost and Longer ROI Period; Longer Replacement Cycle of Water Meters.
8. Can you provide examples of recent developments in the market?
September 2023 - Southwestern Electric Power Co., an American Electric Power company, announced that it would begin installing advanced digital meters, more commonly known as smart meters, in Louisiana. Smart meters use secure wireless technology to provide timely and accurate meter reading data, which customers can use to better understand and manage energy usage at a home or business. In addition, smart meters also allow for real-time outage notifications to SWEPCO for more seamless power restoration. Installations to approximately 234,000 Louisiana customers will begin in the Shreveport-Bossier City area in October before moving south to Hornbeck and other parts of SWEPCO’s Louisiana service territory. Deployment of smart meters will continue across the state through 2025.
9. What pricing options are available for accessing the report?
Pricing options include single-user, multi-user, and enterprise licenses priced at USD 3800, USD 4500, and USD 5800 respectively.
10. Is the market size provided in terms of value or volume?
The market size is provided in terms of value, measured in million and volume, measured in Million.
11. Are there any specific market keywords associated with the report?
Yes, the market keyword associated with the report is "US Residential Smart Meters Market," which aids in identifying and referencing the specific market segment covered.
12. How do I determine which pricing option suits my needs best?
The pricing options vary based on user requirements and access needs. Individual users may opt for single-user licenses, while businesses requiring broader access may choose multi-user or enterprise licenses for cost-effective access to the report.
13. Are there any additional resources or data provided in the US Residential Smart Meters Market report?
While the report offers comprehensive insights, it's advisable to review the specific contents or supplementary materials provided to ascertain if additional resources or data are available.
14. How can I stay updated on further developments or reports in the US Residential Smart Meters Market?
To stay informed about further developments, trends, and reports in the US Residential Smart Meters Market, consider subscribing to industry newsletters, following relevant companies and organizations, or regularly checking reputable industry news sources and publications.
Methodology
Step 1 - Identification of Relevant Samples Size from Population Database


Step 2 - Approaches for Defining Global Market Size (Value, Volume* & Price*)

Note*: In applicable scenarios
Step 3 - Data Sources
Primary Research
- Web Analytics
- Survey Reports
- Research Institute
- Latest Research Reports
- Opinion Leaders
Secondary Research
- Annual Reports
- White Paper
- Latest Press Release
- Industry Association
- Paid Database
- Investor Presentations

Step 4 - Data Triangulation
Involves using different sources of information in order to increase the validity of a study
These sources are likely to be stakeholders in a program - participants, other researchers, program staff, other community members, and so on.
Then we put all data in single framework & apply various statistical tools to find out the dynamic on the market.
During the analysis stage, feedback from the stakeholder groups would be compared to determine areas of agreement as well as areas of divergence