

Key Insights
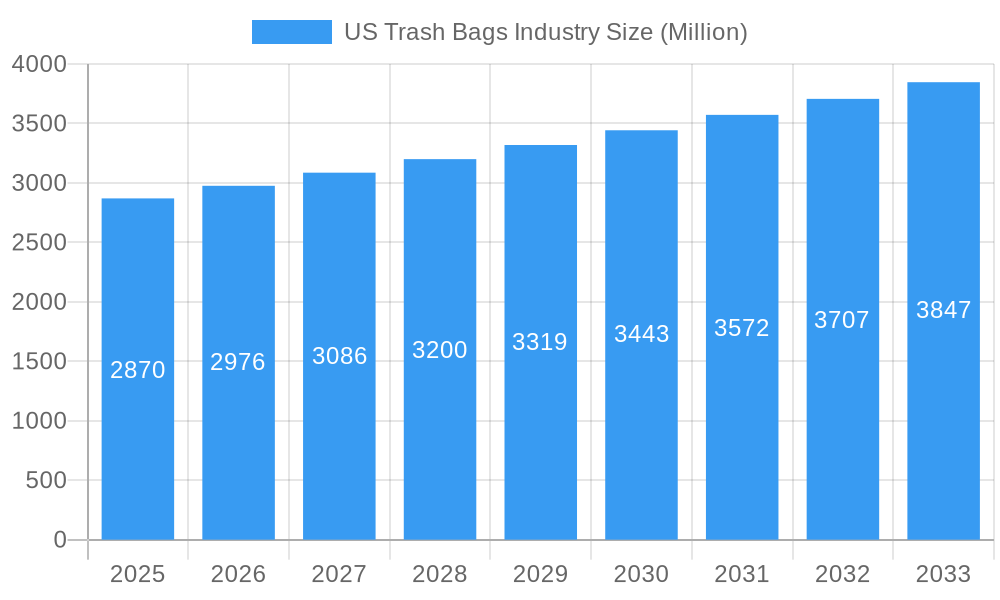
The US trash bag market, valued at $2.87 billion in 2025, is projected to experience steady growth, driven by several key factors. Increased household waste generation due to population growth and changing consumption patterns fuels demand for convenient and efficient waste disposal solutions. The rising adoption of eco-friendly and biodegradable trash bags, responding to growing environmental concerns, presents a significant opportunity for market expansion. Furthermore, the robust construction and commercial sectors contribute substantially to the demand for heavy-duty trash bags, bolstering overall market volume. However, fluctuations in raw material prices, particularly for plastics, represent a key restraint, potentially impacting profitability and pricing strategies for manufacturers. The market is segmented by end-user (residential, commercial, industrial), with the residential segment currently dominating due to high household penetration. The commercial and industrial segments are anticipated to see faster growth rates in the coming years due to expanding businesses and stricter waste management regulations. Key players like Hefty, Berry Global, and Novolex are continuously innovating with new product offerings and sustainable materials, furthering competition and market evolution. The geographic distribution within the US shows varied consumption levels across regions, reflecting population density and economic activity.
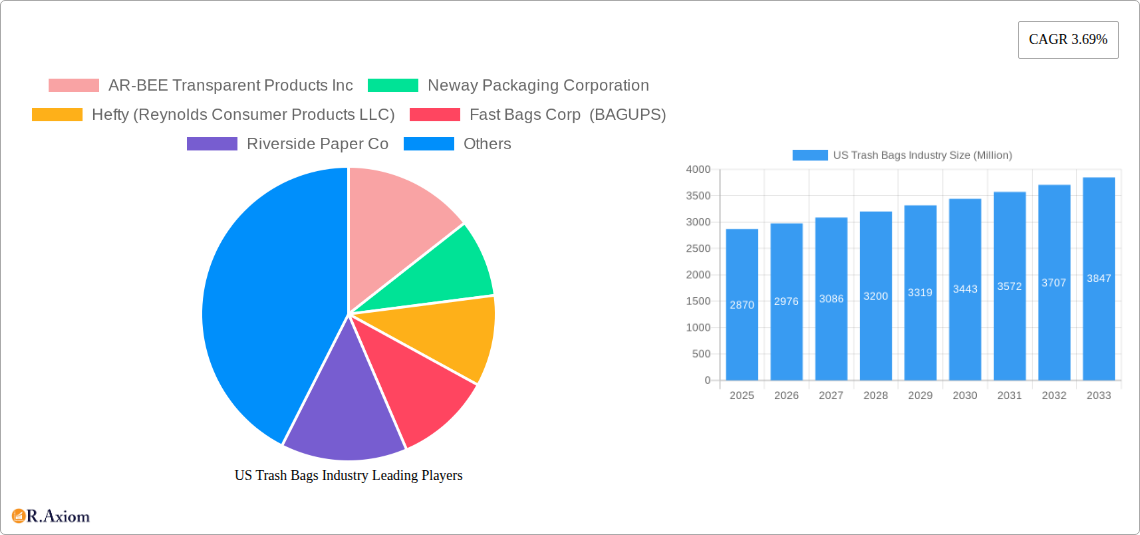
US Trash Bags Industry Market Size (In Billion)
Looking ahead to 2033, a compound annual growth rate (CAGR) of 3.69% suggests a continued, albeit moderate, expansion of the market. This growth will be influenced by a combination of factors, including continued urbanization leading to increased waste generation, the expanding e-commerce sector creating more packaging waste, and a shifting consumer preference towards convenience and sustainability. While price fluctuations and potential regulatory changes pose challenges, the overall market outlook remains positive, particularly for manufacturers who focus on innovation, sustainability, and efficient supply chain management. Regional variations in growth will likely persist, reflecting differences in economic performance and waste management infrastructure across the various US states. The Midwest and South, given their population densities and industrial activity, are likely to represent key growth areas within the US market.
US Trash Bags Industry Company Market Share
US Trash Bags Industry: A Comprehensive Market Report (2019-2033)
This in-depth report provides a comprehensive analysis of the US trash bags industry, covering market size, segmentation, competitive landscape, and future growth prospects. The study period spans from 2019 to 2033, with 2025 serving as the base and estimated year. The report offers actionable insights for industry stakeholders, investors, and businesses seeking to navigate this dynamic market.
US Trash Bags Industry Market Concentration & Innovation
The US trash bags market exhibits a moderately concentrated structure, with several major players commanding significant market share. Top players like Hefty (Reynolds Consumer Products LLC), Novolex, Berry Global Inc., and Inteplast Group hold a combined xx% market share (2024 estimate). Smaller players like AR-BEE Transparent Products Inc., Neway Packaging Corporation, Fast Bags Corp (BAGUPS), Riverside Paper Co., International Plastics Inc., and Universal Plastic Bag Co. compete primarily on price, specialization, and regional reach.
Market innovation is driven by increasing demand for eco-friendly and convenient solutions. Key drivers include:
- Sustainable Materials: Growing consumer preference for biodegradable and compostable trash bags is pushing innovation in material science.
- Smart Dispensing Systems: Products like Bagups by Recircle Brands are revolutionizing bag dispensing, enhancing convenience and reducing waste.
- Enhanced Durability and Strength: Manufacturers are constantly improving bag durability and tear resistance to cater to diverse waste management needs.
- Regulatory Landscape: Stringent environmental regulations are incentivizing the adoption of sustainable packaging and waste management solutions.
Mergers and acquisitions (M&A) activity within the industry has been relatively modest in recent years, with deal values totaling approximately $xx Million in the period 2019-2024. However, future consolidation is anticipated as larger players seek to expand their market share and product portfolios. Product substitution is currently limited, primarily by the lack of readily available, cost-effective alternatives with comparable performance characteristics.
US Trash Bags Industry Industry Trends & Insights
The US trash bags market is experiencing steady growth, driven by factors like population growth, increasing waste generation, and rising consumer awareness of hygiene and sanitation. The market is expected to witness a Compound Annual Growth Rate (CAGR) of xx% during the forecast period (2025-2033), reaching a projected market size of $xx Million by 2033. This growth is fueled by several key trends:
- Rising Consumer Spending: Increased disposable income and a higher standard of living are contributing to increased consumption of trash bags.
- E-commerce Boom: The rapid growth of e-commerce has led to a surge in packaging waste, indirectly boosting demand for trash bags.
- Shifting Consumer Preferences: The demand for convenient, durable, and environmentally conscious trash bags is driving product innovation.
- Stringent Regulations: Governments are increasingly implementing stringent waste management regulations, creating opportunities for eco-friendly bag solutions.
- Market Penetration: While trash bag penetration is high, continued growth is expected due to expanding populations and increasing waste generation per capita. The residential segment remains the largest and is projected to maintain its dominance.
Dominant Markets & Segments in US Trash Bags Industry
The residential segment constitutes the largest share of the US trash bags market, driven by high household penetration and consistent demand. The commercial and industrial segments are growing but at a comparatively slower rate.
Key Drivers of Residential Segment Dominance:
- High Household Penetration: Almost every household in the US uses trash bags.
- Consistent Demand: Trash bag usage is relatively stable, unaffected by significant economic fluctuations.
- Convenience and Hygiene: Trash bags are essential for maintaining hygiene in households.
Key Drivers of Commercial Segment Growth:
- Growth in Retail and Food Service: The expansion of the retail and food service sectors fuels demand for commercial-grade trash bags.
- Stringent Hygiene Regulations: Strict hygiene regulations in commercial settings necessitate the use of robust and reliable trash bags.
Key Drivers of Industrial Segment Growth:
- Industrial Waste Management: The industrial sector generates significant waste, creating substantial demand for heavy-duty trash bags.
- Specialized Needs: Industries often require specialized bags with particular attributes, such as chemical resistance or biodegradability.
Geographically, the market is spread across all states, with higher consumption in densely populated areas and regions with robust waste management infrastructure.
US Trash Bags Industry Product Developments
Recent product developments in the US trash bags industry focus on eco-friendly materials, enhanced functionality, and convenient dispensing systems. The introduction of biodegradable and compostable options is a significant trend, driven by environmental concerns and government regulations. Smart dispensing systems, such as Bagups, aim to improve user experience and reduce waste. These innovations reflect a broader shift towards sustainable and user-centric product design within the industry.
Report Scope & Segmentation Analysis
This report segments the US trash bags market by end-user:
Residential: This segment includes households and individual consumers. It is projected to maintain the largest market share due to high penetration and consistent demand. Growth is driven by population growth and evolving consumer preferences. Competition is intense, with numerous brands vying for market share.
Commercial: This segment encompasses businesses, restaurants, hotels, and other commercial establishments. Growth is linked to expansion in these sectors, stringent hygiene regulations, and the adoption of commercial-grade bags. Competition is moderate, with fewer players specializing in high-volume supply.
Industrial: This segment comprises industrial facilities, manufacturing plants, and waste management companies. Growth is tied to industrial production and specific waste management needs. Specialized bags cater to individual industrial requirements, leading to a more specialized and less competitive market segment compared to residential and commercial applications.
Key Drivers of US Trash Bags Industry Growth
Several factors drive the growth of the US trash bags industry. Population growth leads to increased household waste generation. The expansion of e-commerce and related packaging waste further boosts demand. Consumer preference for convenience and hygiene necessitates consistent trash bag usage. Lastly, the evolving regulatory landscape encourages the adoption of sustainable and eco-friendly options.
Challenges in the US Trash Bags Industry Sector
The US trash bags industry faces challenges such as fluctuating raw material prices, particularly for polymers. Supply chain disruptions can impact production and lead to increased costs. The increasing adoption of eco-friendly alternatives, while a trend, also presents challenges for manufacturers of traditional plastic bags. Intense competition among numerous players necessitates continuous innovation and cost optimization.
Emerging Opportunities in US Trash Bags Industry
Emerging opportunities lie in the increased demand for sustainable and biodegradable trash bags. The growing popularity of smart dispensing systems presents a significant market opportunity. Expansion into specialized niches, catering to specific industrial needs or customized solutions, also presents a lucrative avenue for growth. Lastly, partnerships with waste management companies for efficient recycling and disposal programs offer potential for new revenue streams.
Leading Players in the US Trash Bags Industry Market
- Hefty (Reynolds Consumer Products LLC)
- Novolex
- Berry Global Inc.
- Inteplast Group
- AR-BEE Transparent Products Inc
- Neway Packaging Corporation
- Fast Bags Corp (BAGUPS)
- Riverside Paper Co
- International Plastics Inc
- Universal Plastic Bag Co
Key Developments in US Trash Bags Industry Industry
- January 2024: Recircle Brands launched Bagups, a novel trash bag dispensing system using biodegradable materials, focusing on convenience and sustainability. This launch signifies a shift towards more eco-friendly and user-friendly product designs. The impact on market dynamics includes increased competition and the potential for a higher market share for sustainable products.
Strategic Outlook for US Trash Bags Industry Market
The US trash bags market holds significant growth potential, driven by continuous population growth, increased waste generation, and a growing preference for eco-friendly products. Innovation in material science, improved dispensing systems, and partnerships with waste management companies will shape the future of this industry. Companies that successfully adapt to evolving consumer preferences and environmental regulations are likely to capture significant market share in the years to come.
US Trash Bags Industry Segmentation
-
1. End User
- 1.1. Residential
- 1.2. Commercial
- 1.3. Industrial
US Trash Bags Industry Segmentation By Geography
-
1. North America
- 1.1. United States
- 1.2. Canada
- 1.3. Mexico
-
2. South America
- 2.1. Brazil
- 2.2. Argentina
- 2.3. Rest of South America
-
3. Europe
- 3.1. United Kingdom
- 3.2. Germany
- 3.3. France
- 3.4. Italy
- 3.5. Spain
- 3.6. Russia
- 3.7. Benelux
- 3.8. Nordics
- 3.9. Rest of Europe
-
4. Middle East & Africa
- 4.1. Turkey
- 4.2. Israel
- 4.3. GCC
- 4.4. North Africa
- 4.5. South Africa
- 4.6. Rest of Middle East & Africa
-
5. Asia Pacific
- 5.1. China
- 5.2. India
- 5.3. Japan
- 5.4. South Korea
- 5.5. ASEAN
- 5.6. Oceania
- 5.7. Rest of Asia Pacific
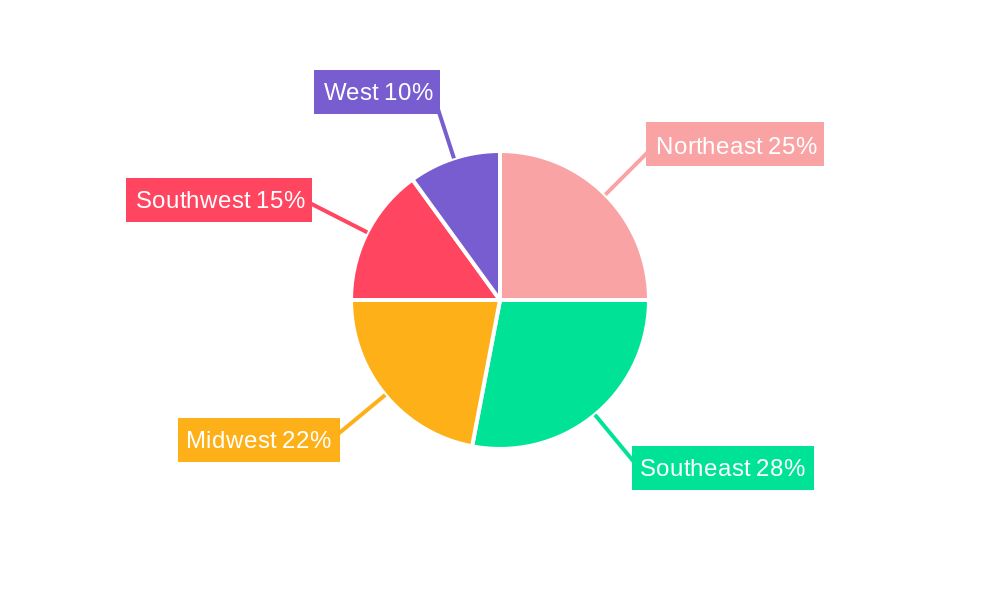
US Trash Bags Industry Regional Market Share
Geographic Coverage of US Trash Bags Industry
US Trash Bags Industry REPORT HIGHLIGHTS
| Aspects | Details |
|---|---|
| Study Period | 2020-2034 |
| Base Year | 2025 |
| Estimated Year | 2026 |
| Forecast Period | 2026-2034 |
| Historical Period | 2020-2025 |
| Growth Rate | CAGR of 3.69% from 2020-2034 |
| Segmentation |
|
Table of Contents
- 1. Introduction
- 1.1. Research Scope
- 1.2. Market Segmentation
- 1.3. Research Objective
- 1.4. Definitions and Assumptions
- 2. Executive Summary
- 2.1. Market Snapshot
- 3. Market Dynamics
- 3.1. Market Drivers
- 3.2. Market Restrains
- 3.3. Market Trends
- 3.4. Market Opportunities
- 4. Market Factor Analysis
- 4.1. Porters Five Forces
- 4.1.1. Bargaining Power of Suppliers
- 4.1.2. Bargaining Power of Buyers
- 4.1.3. Threat of New Entrants
- 4.1.4. Threat of Substitutes
- 4.1.5. Competitive Rivalry
- 4.2. PESTEL analysis
- 4.3. BCG Analysis
- 4.3.1. Stars (High Growth, High Market Share)
- 4.3.2. Cash Cows (Low Growth, High Market Share)
- 4.3.3. Question Mark (High Growth, Low Market Share)
- 4.3.4. Dogs (Low Growth, Low Market Share)
- 4.4. Ansoff Matrix Analysis
- 4.5. Supply Chain Analysis
- 4.6. Regulatory Landscape
- 4.7. Current Market Potential and Opportunity Assessment (TAM–SAM–SOM Framework)
- 4.8. RAX Analyst Note
- 4.1. Porters Five Forces
- 5. Market Analysis, Insights and Forecast 2021-2033
- 5.1. Market Analysis, Insights and Forecast - by End User
- 5.1.1. Residential
- 5.1.2. Commercial
- 5.1.3. Industrial
- 5.2. Market Analysis, Insights and Forecast - by Region
- 5.2.1. North America
- 5.2.2. South America
- 5.2.3. Europe
- 5.2.4. Middle East & Africa
- 5.2.5. Asia Pacific
- 5.1. Market Analysis, Insights and Forecast - by End User
- 6. Global US Trash Bags Industry Analysis, Insights and Forecast, 2021-2033
- 6.1. Market Analysis, Insights and Forecast - by End User
- 6.1.1. Residential
- 6.1.2. Commercial
- 6.1.3. Industrial
- 6.1. Market Analysis, Insights and Forecast - by End User
- 7. North America US Trash Bags Industry Analysis, Insights and Forecast, 2020-2032
- 7.1. Market Analysis, Insights and Forecast - by End User
- 7.1.1. Residential
- 7.1.2. Commercial
- 7.1.3. Industrial
- 7.1. Market Analysis, Insights and Forecast - by End User
- 8. South America US Trash Bags Industry Analysis, Insights and Forecast, 2020-2032
- 8.1. Market Analysis, Insights and Forecast - by End User
- 8.1.1. Residential
- 8.1.2. Commercial
- 8.1.3. Industrial
- 8.1. Market Analysis, Insights and Forecast - by End User
- 9. Europe US Trash Bags Industry Analysis, Insights and Forecast, 2020-2032
- 9.1. Market Analysis, Insights and Forecast - by End User
- 9.1.1. Residential
- 9.1.2. Commercial
- 9.1.3. Industrial
- 9.1. Market Analysis, Insights and Forecast - by End User
- 10. Middle East & Africa US Trash Bags Industry Analysis, Insights and Forecast, 2020-2032
- 10.1. Market Analysis, Insights and Forecast - by End User
- 10.1.1. Residential
- 10.1.2. Commercial
- 10.1.3. Industrial
- 10.1. Market Analysis, Insights and Forecast - by End User
- 11. Asia Pacific US Trash Bags Industry Analysis, Insights and Forecast, 2020-2032
- 11.1. Market Analysis, Insights and Forecast - by End User
- 11.1.1. Residential
- 11.1.2. Commercial
- 11.1.3. Industrial
- 11.1. Market Analysis, Insights and Forecast - by End User
- 12. Competitive Analysis
- 12.1. Company Profiles
- 12.1.1 AR-BEE Transparent Products Inc
- 12.1.1.1. Company Overview
- 12.1.1.2. Products
- 12.1.1.3. Company Financials
- 12.1.1.4. SWOT Analysis
- 12.1.2 Neway Packaging Corporation
- 12.1.2.1. Company Overview
- 12.1.2.2. Products
- 12.1.2.3. Company Financials
- 12.1.2.4. SWOT Analysis
- 12.1.3 Hefty (Reynolds Consumer Products LLC)
- 12.1.3.1. Company Overview
- 12.1.3.2. Products
- 12.1.3.3. Company Financials
- 12.1.3.4. SWOT Analysis
- 12.1.4 Fast Bags Corp (BAGUPS)
- 12.1.4.1. Company Overview
- 12.1.4.2. Products
- 12.1.4.3. Company Financials
- 12.1.4.4. SWOT Analysis
- 12.1.5 Riverside Paper Co
- 12.1.5.1. Company Overview
- 12.1.5.2. Products
- 12.1.5.3. Company Financials
- 12.1.5.4. SWOT Analysis
- 12.1.6 International Plastics Inc
- 12.1.6.1. Company Overview
- 12.1.6.2. Products
- 12.1.6.3. Company Financials
- 12.1.6.4. SWOT Analysis
- 12.1.7 Novolex
- 12.1.7.1. Company Overview
- 12.1.7.2. Products
- 12.1.7.3. Company Financials
- 12.1.7.4. SWOT Analysis
- 12.1.8 Berry Global Inc
- 12.1.8.1. Company Overview
- 12.1.8.2. Products
- 12.1.8.3. Company Financials
- 12.1.8.4. SWOT Analysis
- 12.1.9 Inteplast Group
- 12.1.9.1. Company Overview
- 12.1.9.2. Products
- 12.1.9.3. Company Financials
- 12.1.9.4. SWOT Analysis
- 12.1.10 Universal Plastic Bag Co
- 12.1.10.1. Company Overview
- 12.1.10.2. Products
- 12.1.10.3. Company Financials
- 12.1.10.4. SWOT Analysis
- 12.1.1 AR-BEE Transparent Products Inc
- 12.2. Market Entropy
- 12.2.1 Company's Key Areas Served
- 12.2.2 Recent Developments
- 12.3. Company Market Share Analysis 2025
- 12.3.1 Top 5 Companies Market Share Analysis
- 12.3.2 Top 3 Companies Market Share Analysis
- 12.4. List of Potential Customers
- 13. Research Methodology
List of Figures
- Figure 1: Global US Trash Bags Industry Revenue Breakdown (Million, %) by Region 2025 & 2033
- Figure 2: North America US Trash Bags Industry Revenue (Million), by End User 2025 & 2033
- Figure 3: North America US Trash Bags Industry Revenue Share (%), by End User 2025 & 2033
- Figure 4: North America US Trash Bags Industry Revenue (Million), by Country 2025 & 2033
- Figure 5: North America US Trash Bags Industry Revenue Share (%), by Country 2025 & 2033
- Figure 6: South America US Trash Bags Industry Revenue (Million), by End User 2025 & 2033
- Figure 7: South America US Trash Bags Industry Revenue Share (%), by End User 2025 & 2033
- Figure 8: South America US Trash Bags Industry Revenue (Million), by Country 2025 & 2033
- Figure 9: South America US Trash Bags Industry Revenue Share (%), by Country 2025 & 2033
- Figure 10: Europe US Trash Bags Industry Revenue (Million), by End User 2025 & 2033
- Figure 11: Europe US Trash Bags Industry Revenue Share (%), by End User 2025 & 2033
- Figure 12: Europe US Trash Bags Industry Revenue (Million), by Country 2025 & 2033
- Figure 13: Europe US Trash Bags Industry Revenue Share (%), by Country 2025 & 2033
- Figure 14: Middle East & Africa US Trash Bags Industry Revenue (Million), by End User 2025 & 2033
- Figure 15: Middle East & Africa US Trash Bags Industry Revenue Share (%), by End User 2025 & 2033
- Figure 16: Middle East & Africa US Trash Bags Industry Revenue (Million), by Country 2025 & 2033
- Figure 17: Middle East & Africa US Trash Bags Industry Revenue Share (%), by Country 2025 & 2033
- Figure 18: Asia Pacific US Trash Bags Industry Revenue (Million), by End User 2025 & 2033
- Figure 19: Asia Pacific US Trash Bags Industry Revenue Share (%), by End User 2025 & 2033
- Figure 20: Asia Pacific US Trash Bags Industry Revenue (Million), by Country 2025 & 2033
- Figure 21: Asia Pacific US Trash Bags Industry Revenue Share (%), by Country 2025 & 2033
List of Tables
- Table 1: Global US Trash Bags Industry Revenue Million Forecast, by End User 2020 & 2033
- Table 2: Global US Trash Bags Industry Revenue Million Forecast, by Region 2020 & 2033
- Table 3: Global US Trash Bags Industry Revenue Million Forecast, by End User 2020 & 2033
- Table 4: Global US Trash Bags Industry Revenue Million Forecast, by Country 2020 & 2033
- Table 5: United States US Trash Bags Industry Revenue (Million) Forecast, by Application 2020 & 2033
- Table 6: Canada US Trash Bags Industry Revenue (Million) Forecast, by Application 2020 & 2033
- Table 7: Mexico US Trash Bags Industry Revenue (Million) Forecast, by Application 2020 & 2033
- Table 8: Global US Trash Bags Industry Revenue Million Forecast, by End User 2020 & 2033
- Table 9: Global US Trash Bags Industry Revenue Million Forecast, by Country 2020 & 2033
- Table 10: Brazil US Trash Bags Industry Revenue (Million) Forecast, by Application 2020 & 2033
- Table 11: Argentina US Trash Bags Industry Revenue (Million) Forecast, by Application 2020 & 2033
- Table 12: Rest of South America US Trash Bags Industry Revenue (Million) Forecast, by Application 2020 & 2033
- Table 13: Global US Trash Bags Industry Revenue Million Forecast, by End User 2020 & 2033
- Table 14: Global US Trash Bags Industry Revenue Million Forecast, by Country 2020 & 2033
- Table 15: United Kingdom US Trash Bags Industry Revenue (Million) Forecast, by Application 2020 & 2033
- Table 16: Germany US Trash Bags Industry Revenue (Million) Forecast, by Application 2020 & 2033
- Table 17: France US Trash Bags Industry Revenue (Million) Forecast, by Application 2020 & 2033
- Table 18: Italy US Trash Bags Industry Revenue (Million) Forecast, by Application 2020 & 2033
- Table 19: Spain US Trash Bags Industry Revenue (Million) Forecast, by Application 2020 & 2033
- Table 20: Russia US Trash Bags Industry Revenue (Million) Forecast, by Application 2020 & 2033
- Table 21: Benelux US Trash Bags Industry Revenue (Million) Forecast, by Application 2020 & 2033
- Table 22: Nordics US Trash Bags Industry Revenue (Million) Forecast, by Application 2020 & 2033
- Table 23: Rest of Europe US Trash Bags Industry Revenue (Million) Forecast, by Application 2020 & 2033
- Table 24: Global US Trash Bags Industry Revenue Million Forecast, by End User 2020 & 2033
- Table 25: Global US Trash Bags Industry Revenue Million Forecast, by Country 2020 & 2033
- Table 26: Turkey US Trash Bags Industry Revenue (Million) Forecast, by Application 2020 & 2033
- Table 27: Israel US Trash Bags Industry Revenue (Million) Forecast, by Application 2020 & 2033
- Table 28: GCC US Trash Bags Industry Revenue (Million) Forecast, by Application 2020 & 2033
- Table 29: North Africa US Trash Bags Industry Revenue (Million) Forecast, by Application 2020 & 2033
- Table 30: South Africa US Trash Bags Industry Revenue (Million) Forecast, by Application 2020 & 2033
- Table 31: Rest of Middle East & Africa US Trash Bags Industry Revenue (Million) Forecast, by Application 2020 & 2033
- Table 32: Global US Trash Bags Industry Revenue Million Forecast, by End User 2020 & 2033
- Table 33: Global US Trash Bags Industry Revenue Million Forecast, by Country 2020 & 2033
- Table 34: China US Trash Bags Industry Revenue (Million) Forecast, by Application 2020 & 2033
- Table 35: India US Trash Bags Industry Revenue (Million) Forecast, by Application 2020 & 2033
- Table 36: Japan US Trash Bags Industry Revenue (Million) Forecast, by Application 2020 & 2033
- Table 37: South Korea US Trash Bags Industry Revenue (Million) Forecast, by Application 2020 & 2033
- Table 38: ASEAN US Trash Bags Industry Revenue (Million) Forecast, by Application 2020 & 2033
- Table 39: Oceania US Trash Bags Industry Revenue (Million) Forecast, by Application 2020 & 2033
- Table 40: Rest of Asia Pacific US Trash Bags Industry Revenue (Million) Forecast, by Application 2020 & 2033
Frequently Asked Questions
1. What is the projected Compound Annual Growth Rate (CAGR) of the US Trash Bags Industry?
The projected CAGR is approximately 3.69%.
2. Which companies are prominent players in the US Trash Bags Industry?
Key companies in the market include AR-BEE Transparent Products Inc, Neway Packaging Corporation, Hefty (Reynolds Consumer Products LLC), Fast Bags Corp (BAGUPS), Riverside Paper Co, International Plastics Inc, Novolex, Berry Global Inc, Inteplast Group, Universal Plastic Bag Co.
3. What are the main segments of the US Trash Bags Industry?
The market segments include End User.
4. Can you provide details about the market size?
The market size is estimated to be USD 2.87 Million as of 2022.
5. What are some drivers contributing to market growth?
Growing Demand for Compostable and Oxo-biodegradable Bags; Growing Awareness About Hygiene Among People.
6. What are the notable trends driving market growth?
The Residential Sector Holds the Largest Market Share.
7. Are there any restraints impacting market growth?
Unforeseen Consequences of Reusing Plastic Packaging and Health Related Concerns.
8. Can you provide examples of recent developments in the market?
January 2024: Recircle Brands, a visionary company in the eco-friendly products sector, announced the launch of Bagups, a groundbreaking trash bag dispensing system. Its unique design ensures that a new bag is always ready for use, eliminating the inconvenience of traditional trash bag replacement. The product's environmental impact is significantly reduced by using biodegradable materials, minimizing plastic waste, and reducing the overall carbon footprint.
9. What pricing options are available for accessing the report?
Pricing options include single-user, multi-user, and enterprise licenses priced at USD 3800, USD 4500, and USD 5800 respectively.
10. Is the market size provided in terms of value or volume?
The market size is provided in terms of value, measured in Million.
11. Are there any specific market keywords associated with the report?
Yes, the market keyword associated with the report is "US Trash Bags Industry," which aids in identifying and referencing the specific market segment covered.
12. How do I determine which pricing option suits my needs best?
The pricing options vary based on user requirements and access needs. Individual users may opt for single-user licenses, while businesses requiring broader access may choose multi-user or enterprise licenses for cost-effective access to the report.
13. Are there any additional resources or data provided in the US Trash Bags Industry report?
While the report offers comprehensive insights, it's advisable to review the specific contents or supplementary materials provided to ascertain if additional resources or data are available.
14. How can I stay updated on further developments or reports in the US Trash Bags Industry?
To stay informed about further developments, trends, and reports in the US Trash Bags Industry, consider subscribing to industry newsletters, following relevant companies and organizations, or regularly checking reputable industry news sources and publications.
Methodology
Step 1 - Identification of Relevant Samples Size from Population Database


Step 2 - Approaches for Defining Global Market Size (Value, Volume* & Price*)

Note*: In applicable scenarios
Step 3 - Data Sources
Primary Research
- Web Analytics
- Survey Reports
- Research Institute
- Latest Research Reports
- Opinion Leaders
Secondary Research
- Annual Reports
- White Paper
- Latest Press Release
- Industry Association
- Paid Database
- Investor Presentations

Step 4 - Data Triangulation
Involves using different sources of information in order to increase the validity of a study
These sources are likely to be stakeholders in a program - participants, other researchers, program staff, other community members, and so on.
Then we put all data in single framework & apply various statistical tools to find out the dynamic on the market.
During the analysis stage, feedback from the stakeholder groups would be compared to determine areas of agreement as well as areas of divergence