

Key Insights
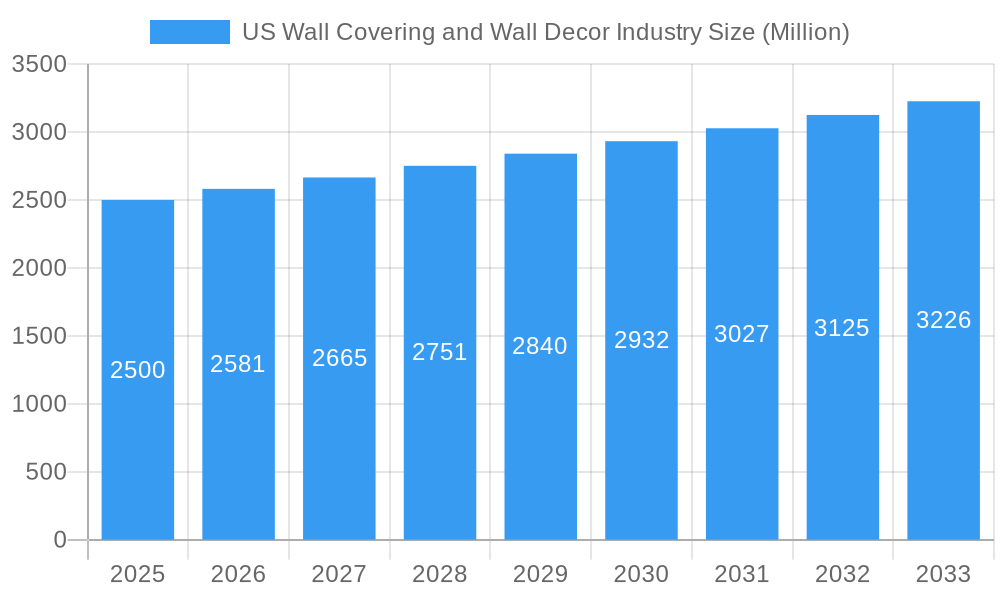
The US wall covering and wall decor market is projected to reach $66.89 billion by 2025, with an estimated compound annual growth rate (CAGR) of 8.55% from 2025 to 2033. Key growth drivers include rising demand for home renovations and interior design, particularly among younger demographics seeking personalized living spaces. E-commerce expansion also enhances accessibility and sales of diverse wall covering and decor options. The market is segmented by product type (wall panels, tiles, metal walls, wallpapers) and application (residential, commercial, institutional), with removable wall coverings showing significant adoption due to ease of use. Challenges include fluctuating raw material costs and economic impacts on discretionary spending. Competitive dynamics involve established and emerging players across various US regions.
US Wall Covering and Wall Decor Industry Market Size (In Billion)
The forecast period (2025-2033) anticipates sustained market expansion, influenced by economic conditions and evolving design preferences. Distribution channels like home centers and e-commerce will remain critical. Future growth will be driven by innovation in materials, designs, and the increasing demand for eco-friendly and sustainable wall covering solutions. Strategic adaptation to these trends is essential for market participants to maintain and grow their share.
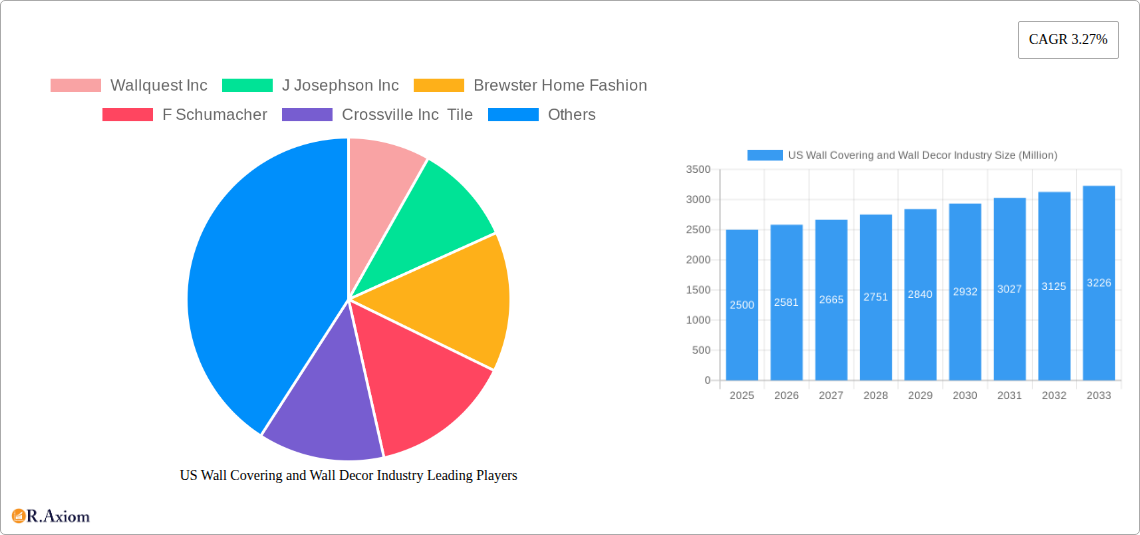
US Wall Covering and Wall Decor Industry Company Market Share
US Wall Covering and Wall Decor Industry: A Comprehensive Market Report (2019-2033)
This comprehensive report provides a detailed analysis of the US wall covering and wall decor industry, covering market size, segmentation, key players, growth drivers, challenges, and future outlook. The study period spans from 2019 to 2033, with 2025 as the base and estimated year. The report offers actionable insights for industry stakeholders, including manufacturers, distributors, retailers, and investors.
US Wall Covering and Wall Decor Industry Market Concentration & Innovation
The US wall covering and wall decor market exhibits a moderately concentrated structure, with several major players commanding significant market share. Companies like Sherwin-Williams Company, Benjamin Moore & Co, and York Wall Coverings hold substantial positions, while numerous smaller players cater to niche segments. Market share data for 2024 suggests Sherwin-Williams holds approximately xx% market share, followed by Benjamin Moore at xx% and York Wall Coverings at xx%. Innovation is driven by evolving consumer preferences for sustainable materials, smart home integration, and personalized design options. Recent M&A activity has been moderate, with deal values in the xx Million range annually. Regulatory frameworks, including those related to VOC emissions and material safety, significantly influence product development and market entry. Product substitutes, such as paint and digital wall murals, are posing challenges, while end-user trends toward customization and eco-friendly options present opportunities.
- Key Players Market Share (2024 Estimate):
- Sherwin-Williams Company: xx%
- Benjamin Moore & Co: xx%
- York Wall Coverings: xx%
- Others: xx%
- M&A Activity (2019-2024): xx Million in total deal value.
- Key Innovation Drivers: Sustainability, Smart Home Integration, Customization
US Wall Covering and Wall Decor Industry Industry Trends & Insights
The US wall covering and wall decor market is projected to experience a CAGR of xx% during the forecast period (2025-2033). Growth is primarily driven by the increasing demand for home renovation and interior design projects, fueled by rising disposable incomes and a preference for aesthetically pleasing living spaces. Technological advancements, such as the introduction of digitally printed wallpapers and innovative installation methods, are disrupting traditional manufacturing processes and enhancing product offerings. Consumer preferences are shifting towards eco-friendly, durable, and easy-to-install wall coverings, particularly in the residential sector. Competitive dynamics are shaped by product differentiation, pricing strategies, brand loyalty, and distribution channel reach. Market penetration of removable wallpaper has seen significant growth, exceeding xx% in 2024. The residential segment continues to dominate, accounting for xx% of the market, showcasing strong growth potential driven by increasing homeownership and renovation activity.
Dominant Markets & Segments in US Wall Covering and Wall Decor Industry
The residential segment dominates the US wall covering and wall decor market, accounting for approximately xx% of the total market value in 2024. Within product types, wallpaper holds the largest market share, followed by wall panels and tiles. E-commerce is rapidly gaining traction as a distribution channel, driven by consumer convenience and wider product selection.
- Key Drivers of Residential Segment Dominance: Rising disposable incomes, increased homeownership rates, and growing preference for home improvement projects.
- Key Drivers of Wallpaper Segment Dominance: Wide variety of designs, affordability, and ease of installation.
- Key Drivers of E-commerce Growth: Convenience, wider selection, and competitive pricing.
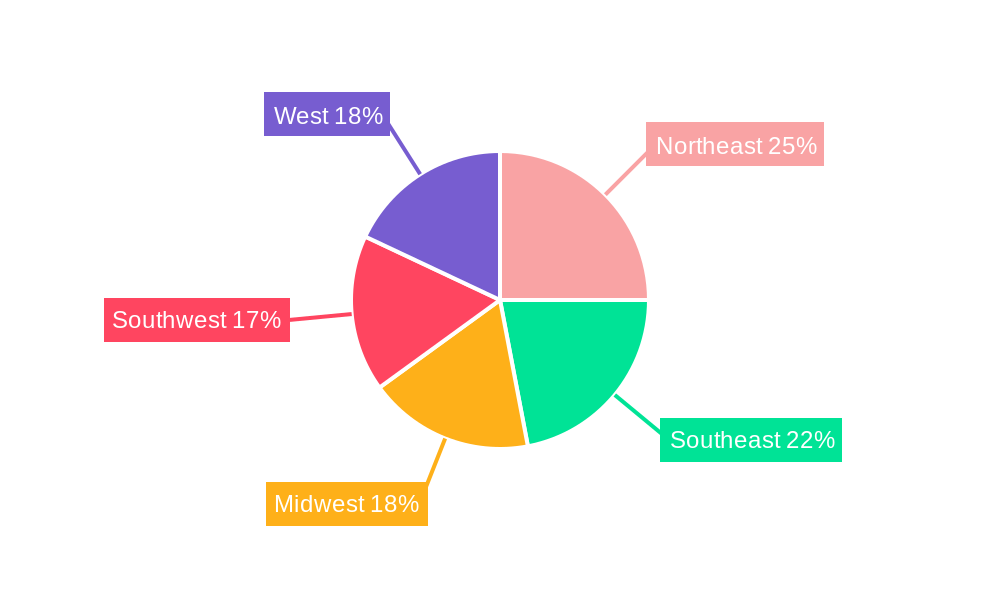
- Regional Dominance: The Northeast and West Coast regions show comparatively higher per capita spending on home improvement products, leading to higher demand for wall coverings and decor.
US Wall Covering and Wall Decor Industry Product Developments
Recent product innovations focus on sustainable and eco-friendly materials, improved durability, easy installation techniques, and advanced printing technologies for personalized designs. The introduction of smart wall coverings with integrated features like sound dampening or temperature regulation is gaining traction. These innovations are enhancing the aesthetic appeal and functionality of wall coverings, catering to the evolving needs of consumers. The market is seeing increased use of natural materials and recycled content in wallpaper and wall panel production.
Report Scope & Segmentation Analysis
This report segments the US wall covering and wall decor market by product type (wall panels, tiles, metal wall coverings, wallpaper, wall decor), type (non-removable, removable), application (residential, non-residential), and distribution channel (specialty stores, home centers/furniture stores, mass merchandisers, e-commerce). Each segment's market size, growth projections, and competitive dynamics are analyzed in detail. For instance, the removable wallpaper segment is showing strong growth due to its ease of installation and changing aesthetic trends, projected to reach xx Million by 2033. The non-residential segment is expected to see a steady growth rate, driven by commercial construction and renovation projects.
Key Drivers of US Wall Covering and Wall Decor Industry Growth
The industry's growth is primarily driven by rising disposable incomes, increased homeownership rates, and a growing preference for home improvement and interior design projects. Technological advancements, such as the development of sustainable materials and easy-to-install products, are also contributing to market expansion. Favorable government policies supporting the construction and real estate sectors further fuel industry growth.
Challenges in the US Wall Covering and Wall Decor Industry Sector
The industry faces challenges such as fluctuations in raw material prices, supply chain disruptions, intense competition, and stringent environmental regulations. These factors can affect production costs, product availability, and profitability. The increasing popularity of DIY and readily available online resources can also present a challenge to traditional businesses.
Emerging Opportunities in US Wall Covering and Wall Decor Industry
Emerging opportunities lie in the growing demand for sustainable and eco-friendly products, smart home integration, personalized designs, and innovative installation methods. Expanding into new markets, like the commercial sector, and exploring new applications of wall coverings also present significant growth potential.
Leading Players in the US Wall Covering and Wall Decor Industry Market
- Wallquest Inc
- J Josephson Inc
- Brewster Home Fashion
- F Schumacher
- Crossville Inc Tile
- Sherwin-Williams Company
- York Wall Coverings
- Benjamin Moore & Co
- Len-Tex Corporation
- Koroseal Wall Protection
Key Developments in US Wall Covering and Wall Decor Industry Industry
- November 2022: Floor & Décor opened a new warehouse store in Coral Springs, Florida, its 10th in South Florida.
- November 2022: Floor & Décor opened a new location in Timnath, Colorado.
Strategic Outlook for US Wall Covering and Wall Decor Industry Market
The US wall covering and wall decor market is poised for continued growth, driven by ongoing trends in home improvement, technological advancements, and the increasing demand for customized and aesthetically pleasing living spaces. Strategic investments in sustainable materials, innovative product development, and effective marketing strategies will be crucial for companies to succeed in this competitive market. The focus on eco-friendly options and technologically advanced products is expected to further drive growth in the years to come.
US Wall Covering and Wall Decor Industry Segmentation
-
1. Product Type
- 1.1. Wall Panel
- 1.2. Tiles
- 1.3. Metal Wall
-
1.4. Wallpaper
- 1.4.1. Vinyl
- 1.4.2. Non-woven Wallpaper
- 1.4.3. Paper-based Wallpaper
- 1.4.4. Fabric Wallpapers
- 1.4.5. Other Wallpapers
-
1.5. Wall Decor
- 1.5.1. Wall Art
- 1.5.2. Wall Decal
- 1.5.3. Wall Frames (Mirrors, etc.)
- 1.5.4. Other Wall Decors
-
2. Type
- 2.1. Non-Removable
-
3. Application
- 3.1. Residential
- 3.2. Non-resi
-
4. Distribution Channel
- 4.1. Specialty Store
- 4.2. Home Center/Furniture
- 4.3. Mass Merchandiser
- 4.4. E-commerce
US Wall Covering and Wall Decor Industry Segmentation By Geography
-
1. North America
- 1.1. United States
- 1.2. Canada
- 1.3. Mexico
-
2. South America
- 2.1. Brazil
- 2.2. Argentina
- 2.3. Rest of South America
-
3. Europe
- 3.1. United Kingdom
- 3.2. Germany
- 3.3. France
- 3.4. Italy
- 3.5. Spain
- 3.6. Russia
- 3.7. Benelux
- 3.8. Nordics
- 3.9. Rest of Europe
-
4. Middle East & Africa
- 4.1. Turkey
- 4.2. Israel
- 4.3. GCC
- 4.4. North Africa
- 4.5. South Africa
- 4.6. Rest of Middle East & Africa
-
5. Asia Pacific
- 5.1. China
- 5.2. India
- 5.3. Japan
- 5.4. South Korea
- 5.5. ASEAN
- 5.6. Oceania
- 5.7. Rest of Asia Pacific
US Wall Covering and Wall Decor Industry Regional Market Share
Geographic Coverage of US Wall Covering and Wall Decor Industry
US Wall Covering and Wall Decor Industry REPORT HIGHLIGHTS
| Aspects | Details |
|---|---|
| Study Period | 2020-2034 |
| Base Year | 2025 |
| Estimated Year | 2026 |
| Forecast Period | 2026-2034 |
| Historical Period | 2020-2025 |
| Growth Rate | CAGR of 8.55% from 2020-2034 |
| Segmentation |
|
Table of Contents
- 1. Introduction
- 1.1. Research Scope
- 1.2. Market Segmentation
- 1.3. Research Objective
- 1.4. Definitions and Assumptions
- 2. Executive Summary
- 2.1. Market Snapshot
- 3. Market Dynamics
- 3.1. Market Drivers
- 3.2. Market Restrains
- 3.3. Market Trends
- 3.4. Market Opportunities
- 4. Market Factor Analysis
- 4.1. Porters Five Forces
- 4.1.1. Bargaining Power of Suppliers
- 4.1.2. Bargaining Power of Buyers
- 4.1.3. Threat of New Entrants
- 4.1.4. Threat of Substitutes
- 4.1.5. Competitive Rivalry
- 4.2. PESTEL analysis
- 4.3. BCG Analysis
- 4.3.1. Stars (High Growth, High Market Share)
- 4.3.2. Cash Cows (Low Growth, High Market Share)
- 4.3.3. Question Mark (High Growth, Low Market Share)
- 4.3.4. Dogs (Low Growth, Low Market Share)
- 4.4. Ansoff Matrix Analysis
- 4.5. Supply Chain Analysis
- 4.6. Regulatory Landscape
- 4.7. Current Market Potential and Opportunity Assessment (TAM–SAM–SOM Framework)
- 4.8. RAX Analyst Note
- 4.1. Porters Five Forces
- 5. Market Analysis, Insights and Forecast 2021-2033
- 5.1. Market Analysis, Insights and Forecast - by Product Type
- 5.1.1. Wall Panel
- 5.1.2. Tiles
- 5.1.3. Metal Wall
- 5.1.4. Wallpaper
- 5.1.4.1. Vinyl
- 5.1.4.2. Non-woven Wallpaper
- 5.1.4.3. Paper-based Wallpaper
- 5.1.4.4. Fabric Wallpapers
- 5.1.4.5. Other Wallpapers
- 5.1.5. Wall Decor
- 5.1.5.1. Wall Art
- 5.1.5.2. Wall Decal
- 5.1.5.3. Wall Frames (Mirrors, etc.)
- 5.1.5.4. Other Wall Decors
- 5.2. Market Analysis, Insights and Forecast - by Type
- 5.2.1. Non-Removable
- 5.3. Market Analysis, Insights and Forecast - by Application
- 5.3.1. Residential
- 5.3.2. Non-resi
- 5.4. Market Analysis, Insights and Forecast - by Distribution Channel
- 5.4.1. Specialty Store
- 5.4.2. Home Center/Furniture
- 5.4.3. Mass Merchandiser
- 5.4.4. E-commerce
- 5.5. Market Analysis, Insights and Forecast - by Region
- 5.5.1. North America
- 5.5.2. South America
- 5.5.3. Europe
- 5.5.4. Middle East & Africa
- 5.5.5. Asia Pacific
- 5.1. Market Analysis, Insights and Forecast - by Product Type
- 6. Global US Wall Covering and Wall Decor Industry Analysis, Insights and Forecast, 2021-2033
- 6.1. Market Analysis, Insights and Forecast - by Product Type
- 6.1.1. Wall Panel
- 6.1.2. Tiles
- 6.1.3. Metal Wall
- 6.1.4. Wallpaper
- 6.1.4.1. Vinyl
- 6.1.4.2. Non-woven Wallpaper
- 6.1.4.3. Paper-based Wallpaper
- 6.1.4.4. Fabric Wallpapers
- 6.1.4.5. Other Wallpapers
- 6.1.5. Wall Decor
- 6.1.5.1. Wall Art
- 6.1.5.2. Wall Decal
- 6.1.5.3. Wall Frames (Mirrors, etc.)
- 6.1.5.4. Other Wall Decors
- 6.2. Market Analysis, Insights and Forecast - by Type
- 6.2.1. Non-Removable
- 6.3. Market Analysis, Insights and Forecast - by Application
- 6.3.1. Residential
- 6.3.2. Non-resi
- 6.4. Market Analysis, Insights and Forecast - by Distribution Channel
- 6.4.1. Specialty Store
- 6.4.2. Home Center/Furniture
- 6.4.3. Mass Merchandiser
- 6.4.4. E-commerce
- 6.1. Market Analysis, Insights and Forecast - by Product Type
- 7. North America US Wall Covering and Wall Decor Industry Analysis, Insights and Forecast, 2020-2032
- 7.1. Market Analysis, Insights and Forecast - by Product Type
- 7.1.1. Wall Panel
- 7.1.2. Tiles
- 7.1.3. Metal Wall
- 7.1.4. Wallpaper
- 7.1.4.1. Vinyl
- 7.1.4.2. Non-woven Wallpaper
- 7.1.4.3. Paper-based Wallpaper
- 7.1.4.4. Fabric Wallpapers
- 7.1.4.5. Other Wallpapers
- 7.1.5. Wall Decor
- 7.1.5.1. Wall Art
- 7.1.5.2. Wall Decal
- 7.1.5.3. Wall Frames (Mirrors, etc.)
- 7.1.5.4. Other Wall Decors
- 7.2. Market Analysis, Insights and Forecast - by Type
- 7.2.1. Non-Removable
- 7.3. Market Analysis, Insights and Forecast - by Application
- 7.3.1. Residential
- 7.3.2. Non-resi
- 7.4. Market Analysis, Insights and Forecast - by Distribution Channel
- 7.4.1. Specialty Store
- 7.4.2. Home Center/Furniture
- 7.4.3. Mass Merchandiser
- 7.4.4. E-commerce
- 7.1. Market Analysis, Insights and Forecast - by Product Type
- 8. South America US Wall Covering and Wall Decor Industry Analysis, Insights and Forecast, 2020-2032
- 8.1. Market Analysis, Insights and Forecast - by Product Type
- 8.1.1. Wall Panel
- 8.1.2. Tiles
- 8.1.3. Metal Wall
- 8.1.4. Wallpaper
- 8.1.4.1. Vinyl
- 8.1.4.2. Non-woven Wallpaper
- 8.1.4.3. Paper-based Wallpaper
- 8.1.4.4. Fabric Wallpapers
- 8.1.4.5. Other Wallpapers
- 8.1.5. Wall Decor
- 8.1.5.1. Wall Art
- 8.1.5.2. Wall Decal
- 8.1.5.3. Wall Frames (Mirrors, etc.)
- 8.1.5.4. Other Wall Decors
- 8.2. Market Analysis, Insights and Forecast - by Type
- 8.2.1. Non-Removable
- 8.3. Market Analysis, Insights and Forecast - by Application
- 8.3.1. Residential
- 8.3.2. Non-resi
- 8.4. Market Analysis, Insights and Forecast - by Distribution Channel
- 8.4.1. Specialty Store
- 8.4.2. Home Center/Furniture
- 8.4.3. Mass Merchandiser
- 8.4.4. E-commerce
- 8.1. Market Analysis, Insights and Forecast - by Product Type
- 9. Europe US Wall Covering and Wall Decor Industry Analysis, Insights and Forecast, 2020-2032
- 9.1. Market Analysis, Insights and Forecast - by Product Type
- 9.1.1. Wall Panel
- 9.1.2. Tiles
- 9.1.3. Metal Wall
- 9.1.4. Wallpaper
- 9.1.4.1. Vinyl
- 9.1.4.2. Non-woven Wallpaper
- 9.1.4.3. Paper-based Wallpaper
- 9.1.4.4. Fabric Wallpapers
- 9.1.4.5. Other Wallpapers
- 9.1.5. Wall Decor
- 9.1.5.1. Wall Art
- 9.1.5.2. Wall Decal
- 9.1.5.3. Wall Frames (Mirrors, etc.)
- 9.1.5.4. Other Wall Decors
- 9.2. Market Analysis, Insights and Forecast - by Type
- 9.2.1. Non-Removable
- 9.3. Market Analysis, Insights and Forecast - by Application
- 9.3.1. Residential
- 9.3.2. Non-resi
- 9.4. Market Analysis, Insights and Forecast - by Distribution Channel
- 9.4.1. Specialty Store
- 9.4.2. Home Center/Furniture
- 9.4.3. Mass Merchandiser
- 9.4.4. E-commerce
- 9.1. Market Analysis, Insights and Forecast - by Product Type
- 10. Middle East & Africa US Wall Covering and Wall Decor Industry Analysis, Insights and Forecast, 2020-2032
- 10.1. Market Analysis, Insights and Forecast - by Product Type
- 10.1.1. Wall Panel
- 10.1.2. Tiles
- 10.1.3. Metal Wall
- 10.1.4. Wallpaper
- 10.1.4.1. Vinyl
- 10.1.4.2. Non-woven Wallpaper
- 10.1.4.3. Paper-based Wallpaper
- 10.1.4.4. Fabric Wallpapers
- 10.1.4.5. Other Wallpapers
- 10.1.5. Wall Decor
- 10.1.5.1. Wall Art
- 10.1.5.2. Wall Decal
- 10.1.5.3. Wall Frames (Mirrors, etc.)
- 10.1.5.4. Other Wall Decors
- 10.2. Market Analysis, Insights and Forecast - by Type
- 10.2.1. Non-Removable
- 10.3. Market Analysis, Insights and Forecast - by Application
- 10.3.1. Residential
- 10.3.2. Non-resi
- 10.4. Market Analysis, Insights and Forecast - by Distribution Channel
- 10.4.1. Specialty Store
- 10.4.2. Home Center/Furniture
- 10.4.3. Mass Merchandiser
- 10.4.4. E-commerce
- 10.1. Market Analysis, Insights and Forecast - by Product Type
- 11. Asia Pacific US Wall Covering and Wall Decor Industry Analysis, Insights and Forecast, 2020-2032
- 11.1. Market Analysis, Insights and Forecast - by Product Type
- 11.1.1. Wall Panel
- 11.1.2. Tiles
- 11.1.3. Metal Wall
- 11.1.4. Wallpaper
- 11.1.4.1. Vinyl
- 11.1.4.2. Non-woven Wallpaper
- 11.1.4.3. Paper-based Wallpaper
- 11.1.4.4. Fabric Wallpapers
- 11.1.4.5. Other Wallpapers
- 11.1.5. Wall Decor
- 11.1.5.1. Wall Art
- 11.1.5.2. Wall Decal
- 11.1.5.3. Wall Frames (Mirrors, etc.)
- 11.1.5.4. Other Wall Decors
- 11.2. Market Analysis, Insights and Forecast - by Type
- 11.2.1. Non-Removable
- 11.3. Market Analysis, Insights and Forecast - by Application
- 11.3.1. Residential
- 11.3.2. Non-resi
- 11.4. Market Analysis, Insights and Forecast - by Distribution Channel
- 11.4.1. Specialty Store
- 11.4.2. Home Center/Furniture
- 11.4.3. Mass Merchandiser
- 11.4.4. E-commerce
- 11.1. Market Analysis, Insights and Forecast - by Product Type
- 12. Competitive Analysis
- 12.1. Company Profiles
- 12.1.1 Wallquest Inc
- 12.1.1.1. Company Overview
- 12.1.1.2. Products
- 12.1.1.3. Company Financials
- 12.1.1.4. SWOT Analysis
- 12.1.2 J Josephson Inc
- 12.1.2.1. Company Overview
- 12.1.2.2. Products
- 12.1.2.3. Company Financials
- 12.1.2.4. SWOT Analysis
- 12.1.3 Brewster Home Fashion
- 12.1.3.1. Company Overview
- 12.1.3.2. Products
- 12.1.3.3. Company Financials
- 12.1.3.4. SWOT Analysis
- 12.1.4 F Schumacher
- 12.1.4.1. Company Overview
- 12.1.4.2. Products
- 12.1.4.3. Company Financials
- 12.1.4.4. SWOT Analysis
- 12.1.5 Crossville Inc Tile
- 12.1.5.1. Company Overview
- 12.1.5.2. Products
- 12.1.5.3. Company Financials
- 12.1.5.4. SWOT Analysis
- 12.1.6 Sherwin-Williams Company
- 12.1.6.1. Company Overview
- 12.1.6.2. Products
- 12.1.6.3. Company Financials
- 12.1.6.4. SWOT Analysis
- 12.1.7 York Wall Coverings
- 12.1.7.1. Company Overview
- 12.1.7.2. Products
- 12.1.7.3. Company Financials
- 12.1.7.4. SWOT Analysis
- 12.1.8 Benjamin Moore & Co
- 12.1.8.1. Company Overview
- 12.1.8.2. Products
- 12.1.8.3. Company Financials
- 12.1.8.4. SWOT Analysis
- 12.1.9 Len-Tex Corporation*List Not Exhaustive
- 12.1.9.1. Company Overview
- 12.1.9.2. Products
- 12.1.9.3. Company Financials
- 12.1.9.4. SWOT Analysis
- 12.1.10 Koroseal Wall Protection'
- 12.1.10.1. Company Overview
- 12.1.10.2. Products
- 12.1.10.3. Company Financials
- 12.1.10.4. SWOT Analysis
- 12.1.1 Wallquest Inc
- 12.2. Market Entropy
- 12.2.1 Company's Key Areas Served
- 12.2.2 Recent Developments
- 12.3. Company Market Share Analysis 2025
- 12.3.1 Top 5 Companies Market Share Analysis
- 12.3.2 Top 3 Companies Market Share Analysis
- 12.4. List of Potential Customers
- 13. Research Methodology
List of Figures
- Figure 1: Global US Wall Covering and Wall Decor Industry Revenue Breakdown (billion, %) by Region 2025 & 2033
- Figure 2: North America US Wall Covering and Wall Decor Industry Revenue (billion), by Product Type 2025 & 2033
- Figure 3: North America US Wall Covering and Wall Decor Industry Revenue Share (%), by Product Type 2025 & 2033
- Figure 4: North America US Wall Covering and Wall Decor Industry Revenue (billion), by Type 2025 & 2033
- Figure 5: North America US Wall Covering and Wall Decor Industry Revenue Share (%), by Type 2025 & 2033
- Figure 6: North America US Wall Covering and Wall Decor Industry Revenue (billion), by Application 2025 & 2033
- Figure 7: North America US Wall Covering and Wall Decor Industry Revenue Share (%), by Application 2025 & 2033
- Figure 8: North America US Wall Covering and Wall Decor Industry Revenue (billion), by Distribution Channel 2025 & 2033
- Figure 9: North America US Wall Covering and Wall Decor Industry Revenue Share (%), by Distribution Channel 2025 & 2033
- Figure 10: North America US Wall Covering and Wall Decor Industry Revenue (billion), by Country 2025 & 2033
- Figure 11: North America US Wall Covering and Wall Decor Industry Revenue Share (%), by Country 2025 & 2033
- Figure 12: South America US Wall Covering and Wall Decor Industry Revenue (billion), by Product Type 2025 & 2033
- Figure 13: South America US Wall Covering and Wall Decor Industry Revenue Share (%), by Product Type 2025 & 2033
- Figure 14: South America US Wall Covering and Wall Decor Industry Revenue (billion), by Type 2025 & 2033
- Figure 15: South America US Wall Covering and Wall Decor Industry Revenue Share (%), by Type 2025 & 2033
- Figure 16: South America US Wall Covering and Wall Decor Industry Revenue (billion), by Application 2025 & 2033
- Figure 17: South America US Wall Covering and Wall Decor Industry Revenue Share (%), by Application 2025 & 2033
- Figure 18: South America US Wall Covering and Wall Decor Industry Revenue (billion), by Distribution Channel 2025 & 2033
- Figure 19: South America US Wall Covering and Wall Decor Industry Revenue Share (%), by Distribution Channel 2025 & 2033
- Figure 20: South America US Wall Covering and Wall Decor Industry Revenue (billion), by Country 2025 & 2033
- Figure 21: South America US Wall Covering and Wall Decor Industry Revenue Share (%), by Country 2025 & 2033
- Figure 22: Europe US Wall Covering and Wall Decor Industry Revenue (billion), by Product Type 2025 & 2033
- Figure 23: Europe US Wall Covering and Wall Decor Industry Revenue Share (%), by Product Type 2025 & 2033
- Figure 24: Europe US Wall Covering and Wall Decor Industry Revenue (billion), by Type 2025 & 2033
- Figure 25: Europe US Wall Covering and Wall Decor Industry Revenue Share (%), by Type 2025 & 2033
- Figure 26: Europe US Wall Covering and Wall Decor Industry Revenue (billion), by Application 2025 & 2033
- Figure 27: Europe US Wall Covering and Wall Decor Industry Revenue Share (%), by Application 2025 & 2033
- Figure 28: Europe US Wall Covering and Wall Decor Industry Revenue (billion), by Distribution Channel 2025 & 2033
- Figure 29: Europe US Wall Covering and Wall Decor Industry Revenue Share (%), by Distribution Channel 2025 & 2033
- Figure 30: Europe US Wall Covering and Wall Decor Industry Revenue (billion), by Country 2025 & 2033
- Figure 31: Europe US Wall Covering and Wall Decor Industry Revenue Share (%), by Country 2025 & 2033
- Figure 32: Middle East & Africa US Wall Covering and Wall Decor Industry Revenue (billion), by Product Type 2025 & 2033
- Figure 33: Middle East & Africa US Wall Covering and Wall Decor Industry Revenue Share (%), by Product Type 2025 & 2033
- Figure 34: Middle East & Africa US Wall Covering and Wall Decor Industry Revenue (billion), by Type 2025 & 2033
- Figure 35: Middle East & Africa US Wall Covering and Wall Decor Industry Revenue Share (%), by Type 2025 & 2033
- Figure 36: Middle East & Africa US Wall Covering and Wall Decor Industry Revenue (billion), by Application 2025 & 2033
- Figure 37: Middle East & Africa US Wall Covering and Wall Decor Industry Revenue Share (%), by Application 2025 & 2033
- Figure 38: Middle East & Africa US Wall Covering and Wall Decor Industry Revenue (billion), by Distribution Channel 2025 & 2033
- Figure 39: Middle East & Africa US Wall Covering and Wall Decor Industry Revenue Share (%), by Distribution Channel 2025 & 2033
- Figure 40: Middle East & Africa US Wall Covering and Wall Decor Industry Revenue (billion), by Country 2025 & 2033
- Figure 41: Middle East & Africa US Wall Covering and Wall Decor Industry Revenue Share (%), by Country 2025 & 2033
- Figure 42: Asia Pacific US Wall Covering and Wall Decor Industry Revenue (billion), by Product Type 2025 & 2033
- Figure 43: Asia Pacific US Wall Covering and Wall Decor Industry Revenue Share (%), by Product Type 2025 & 2033
- Figure 44: Asia Pacific US Wall Covering and Wall Decor Industry Revenue (billion), by Type 2025 & 2033
- Figure 45: Asia Pacific US Wall Covering and Wall Decor Industry Revenue Share (%), by Type 2025 & 2033
- Figure 46: Asia Pacific US Wall Covering and Wall Decor Industry Revenue (billion), by Application 2025 & 2033
- Figure 47: Asia Pacific US Wall Covering and Wall Decor Industry Revenue Share (%), by Application 2025 & 2033
- Figure 48: Asia Pacific US Wall Covering and Wall Decor Industry Revenue (billion), by Distribution Channel 2025 & 2033
- Figure 49: Asia Pacific US Wall Covering and Wall Decor Industry Revenue Share (%), by Distribution Channel 2025 & 2033
- Figure 50: Asia Pacific US Wall Covering and Wall Decor Industry Revenue (billion), by Country 2025 & 2033
- Figure 51: Asia Pacific US Wall Covering and Wall Decor Industry Revenue Share (%), by Country 2025 & 2033
List of Tables
- Table 1: Global US Wall Covering and Wall Decor Industry Revenue billion Forecast, by Product Type 2020 & 2033
- Table 2: Global US Wall Covering and Wall Decor Industry Revenue billion Forecast, by Type 2020 & 2033
- Table 3: Global US Wall Covering and Wall Decor Industry Revenue billion Forecast, by Application 2020 & 2033
- Table 4: Global US Wall Covering and Wall Decor Industry Revenue billion Forecast, by Distribution Channel 2020 & 2033
- Table 5: Global US Wall Covering and Wall Decor Industry Revenue billion Forecast, by Region 2020 & 2033
- Table 6: Global US Wall Covering and Wall Decor Industry Revenue billion Forecast, by Product Type 2020 & 2033
- Table 7: Global US Wall Covering and Wall Decor Industry Revenue billion Forecast, by Type 2020 & 2033
- Table 8: Global US Wall Covering and Wall Decor Industry Revenue billion Forecast, by Application 2020 & 2033
- Table 9: Global US Wall Covering and Wall Decor Industry Revenue billion Forecast, by Distribution Channel 2020 & 2033
- Table 10: Global US Wall Covering and Wall Decor Industry Revenue billion Forecast, by Country 2020 & 2033
- Table 11: United States US Wall Covering and Wall Decor Industry Revenue (billion) Forecast, by Application 2020 & 2033
- Table 12: Canada US Wall Covering and Wall Decor Industry Revenue (billion) Forecast, by Application 2020 & 2033
- Table 13: Mexico US Wall Covering and Wall Decor Industry Revenue (billion) Forecast, by Application 2020 & 2033
- Table 14: Global US Wall Covering and Wall Decor Industry Revenue billion Forecast, by Product Type 2020 & 2033
- Table 15: Global US Wall Covering and Wall Decor Industry Revenue billion Forecast, by Type 2020 & 2033
- Table 16: Global US Wall Covering and Wall Decor Industry Revenue billion Forecast, by Application 2020 & 2033
- Table 17: Global US Wall Covering and Wall Decor Industry Revenue billion Forecast, by Distribution Channel 2020 & 2033
- Table 18: Global US Wall Covering and Wall Decor Industry Revenue billion Forecast, by Country 2020 & 2033
- Table 19: Brazil US Wall Covering and Wall Decor Industry Revenue (billion) Forecast, by Application 2020 & 2033
- Table 20: Argentina US Wall Covering and Wall Decor Industry Revenue (billion) Forecast, by Application 2020 & 2033
- Table 21: Rest of South America US Wall Covering and Wall Decor Industry Revenue (billion) Forecast, by Application 2020 & 2033
- Table 22: Global US Wall Covering and Wall Decor Industry Revenue billion Forecast, by Product Type 2020 & 2033
- Table 23: Global US Wall Covering and Wall Decor Industry Revenue billion Forecast, by Type 2020 & 2033
- Table 24: Global US Wall Covering and Wall Decor Industry Revenue billion Forecast, by Application 2020 & 2033
- Table 25: Global US Wall Covering and Wall Decor Industry Revenue billion Forecast, by Distribution Channel 2020 & 2033
- Table 26: Global US Wall Covering and Wall Decor Industry Revenue billion Forecast, by Country 2020 & 2033
- Table 27: United Kingdom US Wall Covering and Wall Decor Industry Revenue (billion) Forecast, by Application 2020 & 2033
- Table 28: Germany US Wall Covering and Wall Decor Industry Revenue (billion) Forecast, by Application 2020 & 2033
- Table 29: France US Wall Covering and Wall Decor Industry Revenue (billion) Forecast, by Application 2020 & 2033
- Table 30: Italy US Wall Covering and Wall Decor Industry Revenue (billion) Forecast, by Application 2020 & 2033
- Table 31: Spain US Wall Covering and Wall Decor Industry Revenue (billion) Forecast, by Application 2020 & 2033
- Table 32: Russia US Wall Covering and Wall Decor Industry Revenue (billion) Forecast, by Application 2020 & 2033
- Table 33: Benelux US Wall Covering and Wall Decor Industry Revenue (billion) Forecast, by Application 2020 & 2033
- Table 34: Nordics US Wall Covering and Wall Decor Industry Revenue (billion) Forecast, by Application 2020 & 2033
- Table 35: Rest of Europe US Wall Covering and Wall Decor Industry Revenue (billion) Forecast, by Application 2020 & 2033
- Table 36: Global US Wall Covering and Wall Decor Industry Revenue billion Forecast, by Product Type 2020 & 2033
- Table 37: Global US Wall Covering and Wall Decor Industry Revenue billion Forecast, by Type 2020 & 2033
- Table 38: Global US Wall Covering and Wall Decor Industry Revenue billion Forecast, by Application 2020 & 2033
- Table 39: Global US Wall Covering and Wall Decor Industry Revenue billion Forecast, by Distribution Channel 2020 & 2033
- Table 40: Global US Wall Covering and Wall Decor Industry Revenue billion Forecast, by Country 2020 & 2033
- Table 41: Turkey US Wall Covering and Wall Decor Industry Revenue (billion) Forecast, by Application 2020 & 2033
- Table 42: Israel US Wall Covering and Wall Decor Industry Revenue (billion) Forecast, by Application 2020 & 2033
- Table 43: GCC US Wall Covering and Wall Decor Industry Revenue (billion) Forecast, by Application 2020 & 2033
- Table 44: North Africa US Wall Covering and Wall Decor Industry Revenue (billion) Forecast, by Application 2020 & 2033
- Table 45: South Africa US Wall Covering and Wall Decor Industry Revenue (billion) Forecast, by Application 2020 & 2033
- Table 46: Rest of Middle East & Africa US Wall Covering and Wall Decor Industry Revenue (billion) Forecast, by Application 2020 & 2033
- Table 47: Global US Wall Covering and Wall Decor Industry Revenue billion Forecast, by Product Type 2020 & 2033
- Table 48: Global US Wall Covering and Wall Decor Industry Revenue billion Forecast, by Type 2020 & 2033
- Table 49: Global US Wall Covering and Wall Decor Industry Revenue billion Forecast, by Application 2020 & 2033
- Table 50: Global US Wall Covering and Wall Decor Industry Revenue billion Forecast, by Distribution Channel 2020 & 2033
- Table 51: Global US Wall Covering and Wall Decor Industry Revenue billion Forecast, by Country 2020 & 2033
- Table 52: China US Wall Covering and Wall Decor Industry Revenue (billion) Forecast, by Application 2020 & 2033
- Table 53: India US Wall Covering and Wall Decor Industry Revenue (billion) Forecast, by Application 2020 & 2033
- Table 54: Japan US Wall Covering and Wall Decor Industry Revenue (billion) Forecast, by Application 2020 & 2033
- Table 55: South Korea US Wall Covering and Wall Decor Industry Revenue (billion) Forecast, by Application 2020 & 2033
- Table 56: ASEAN US Wall Covering and Wall Decor Industry Revenue (billion) Forecast, by Application 2020 & 2033
- Table 57: Oceania US Wall Covering and Wall Decor Industry Revenue (billion) Forecast, by Application 2020 & 2033
- Table 58: Rest of Asia Pacific US Wall Covering and Wall Decor Industry Revenue (billion) Forecast, by Application 2020 & 2033
Frequently Asked Questions
1. What is the projected Compound Annual Growth Rate (CAGR) of the US Wall Covering and Wall Decor Industry?
The projected CAGR is approximately 8.55%.
2. Which companies are prominent players in the US Wall Covering and Wall Decor Industry?
Key companies in the market include Wallquest Inc, J Josephson Inc, Brewster Home Fashion, F Schumacher, Crossville Inc Tile, Sherwin-Williams Company, York Wall Coverings, Benjamin Moore & Co, Len-Tex Corporation*List Not Exhaustive, Koroseal Wall Protection'.
3. What are the main segments of the US Wall Covering and Wall Decor Industry?
The market segments include Product Type, Type, Application, Distribution Channel.
4. Can you provide details about the market size?
The market size is estimated to be USD 66.89 billion as of 2022.
5. What are some drivers contributing to market growth?
Rebounding Residential Construction Activity; Growing Demand for Digitally Printed Solutions and Online Procurement of Wall Arts.
6. What are the notable trends driving market growth?
Increasing Construction Activity to Drive the Market Growth.
7. Are there any restraints impacting market growth?
Strong Competition from the Paints Segment; Recent Changes in Macro-environment Expected to Impact Customer Spending.
8. Can you provide examples of recent developments in the market?
November 2022: Floor & Décor plans to expand its nationwide footprint by opening its newest location in Coral Springs, Florida. This opening marks the 10th warehouse store in the South Florida market.
9. What pricing options are available for accessing the report?
Pricing options include single-user, multi-user, and enterprise licenses priced at USD 3800, USD 4500, and USD 5800 respectively.
10. Is the market size provided in terms of value or volume?
The market size is provided in terms of value, measured in billion.
11. Are there any specific market keywords associated with the report?
Yes, the market keyword associated with the report is "US Wall Covering and Wall Decor Industry," which aids in identifying and referencing the specific market segment covered.
12. How do I determine which pricing option suits my needs best?
The pricing options vary based on user requirements and access needs. Individual users may opt for single-user licenses, while businesses requiring broader access may choose multi-user or enterprise licenses for cost-effective access to the report.
13. Are there any additional resources or data provided in the US Wall Covering and Wall Decor Industry report?
While the report offers comprehensive insights, it's advisable to review the specific contents or supplementary materials provided to ascertain if additional resources or data are available.
14. How can I stay updated on further developments or reports in the US Wall Covering and Wall Decor Industry?
To stay informed about further developments, trends, and reports in the US Wall Covering and Wall Decor Industry, consider subscribing to industry newsletters, following relevant companies and organizations, or regularly checking reputable industry news sources and publications.
Methodology
Step 1 - Identification of Relevant Samples Size from Population Database


Step 2 - Approaches for Defining Global Market Size (Value, Volume* & Price*)

Note*: In applicable scenarios
Step 3 - Data Sources
Primary Research
- Web Analytics
- Survey Reports
- Research Institute
- Latest Research Reports
- Opinion Leaders
Secondary Research
- Annual Reports
- White Paper
- Latest Press Release
- Industry Association
- Paid Database
- Investor Presentations

Step 4 - Data Triangulation
Involves using different sources of information in order to increase the validity of a study
These sources are likely to be stakeholders in a program - participants, other researchers, program staff, other community members, and so on.
Then we put all data in single framework & apply various statistical tools to find out the dynamic on the market.
During the analysis stage, feedback from the stakeholder groups would be compared to determine areas of agreement as well as areas of divergence