

Key Insights
The US wallcovering market, projected at 36.54 million in 2024, is anticipated to grow at a compound annual growth rate (CAGR) of 4.6% from 2024 to 2033. Key growth drivers include the escalating demand for home renovations, boosted by increased disposable incomes and a desire for personalized interiors. The resurgence of wallpaper as a versatile design element, featuring innovative textures, patterns, and sustainable options, further stimulates market demand. The commercial sector, including hospitality and retail, is also a significant contributor, as businesses invest in enhancing brand image and creating appealing environments. Market challenges include raw material price volatility and competition from alternative wall finishes. Residential applications dominate segmentation, with strong demand channeled through specialty retailers, home improvement stores, and e-commerce. Wall panels and traditional wallpaper are the leading product segments.
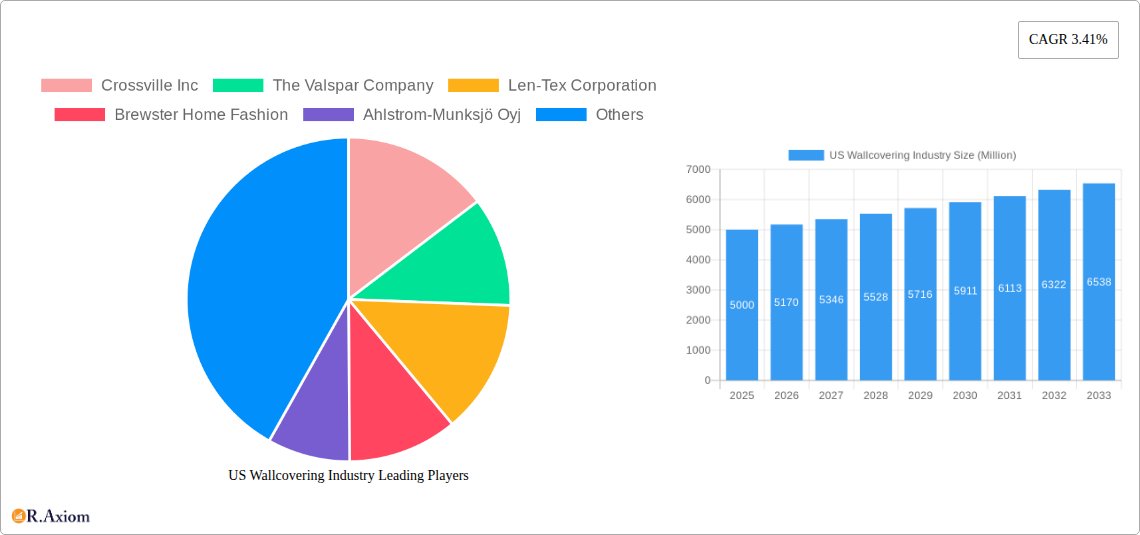
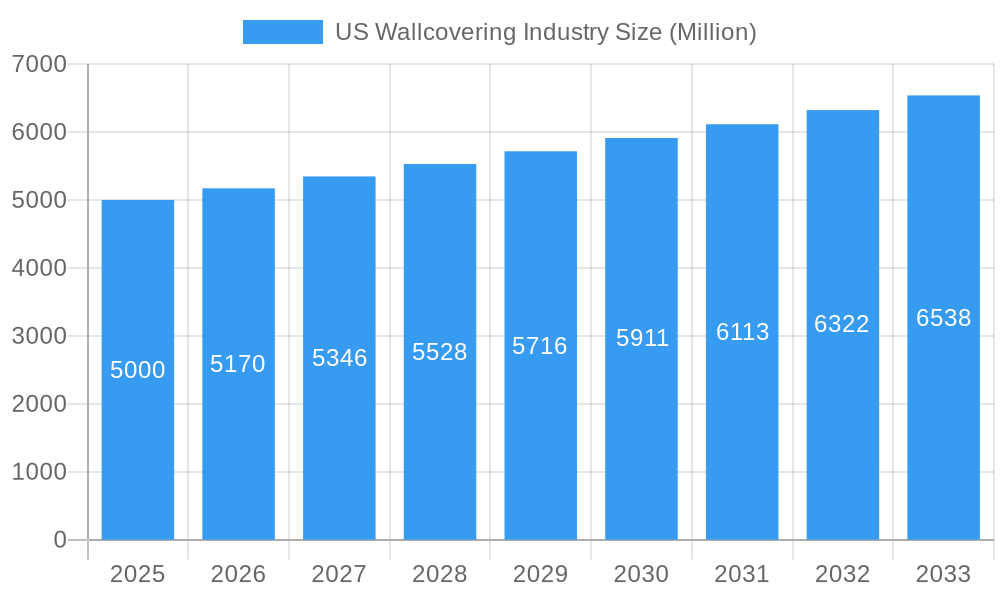
US Wallcovering Industry Market Size (In Million)
Geographically, the Northeast and West regions are expected to lead growth due to higher concentrations of affluent households and greater investment in home improvements. Leading industry players like Sherwin-Williams, Benjamin Moore, and Mohawk Industries are actively shaping the market through strategic initiatives such as product expansion, acquisitions, and brand development. The forecast period (2024-2033) indicates sustained market expansion, albeit potentially influenced by broader economic conditions and evolving consumer preferences. Understanding these market dynamics is vital for stakeholders seeking to leverage opportunities within this evolving sector.
US Wallcovering Industry Company Market Share
US Wallcovering Market Analysis: 2024-2033
This comprehensive report offers an in-depth analysis of the US wallcovering industry, providing critical insights into market dynamics, competitive landscapes, and future growth trajectories. Spanning from 2024 to 2033, with 2024 as the base year, this report is an indispensable resource for industry participants, investors, and businesses aiming to capitalize on market opportunities. The analysis incorporates key market data, with all figures presented in millions.
US Wallcovering Industry Market Concentration & Innovation
This section analyzes the competitive intensity of the US wallcovering market, examining market concentration, innovation drivers, regulatory landscape, and recent mergers and acquisitions (M&A) activities. The market is moderately concentrated, with several key players holding significant market share. While precise market share figures for individual companies are not publicly available in entirety for this report, we estimate that the top 5 players collectively hold approximately xx% of the market in 2025.
- Market Concentration: The market exhibits moderate concentration with a Herfindahl-Hirschman Index (HHI) estimated at xx in 2025.
- Innovation Drivers: Key innovation drivers include the development of sustainable and eco-friendly wallcovering materials, the incorporation of smart technology into wall coverings (e.g., interactive wallpapers), and the introduction of innovative designs and textures to cater to evolving consumer preferences.
- Regulatory Framework: Environmental regulations concerning VOC emissions and the use of sustainable materials significantly influence product development and manufacturing practices.
- Product Substitutes: The industry faces competition from alternative wall finishes, such as paint and textured plaster, which influence pricing and market penetration.
- End-User Trends: The growing preference for personalized and aesthetically appealing home décor is driving demand for high-quality and designer wallcoverings.
- M&A Activity: The past five years have witnessed a moderate level of M&A activity, with estimated deal values totaling approximately $xx Million. These activities aim to expand market reach, product portfolios, and technological capabilities.
US Wallcovering Industry Industry Trends & Insights
The US wallcovering market is experiencing steady growth, driven by several factors. The increasing focus on home improvement and interior design, coupled with the rising disposable incomes in certain demographics, fuels demand. Technological advancements, such as improved printing techniques and the introduction of innovative materials, are also contributing to market expansion. Furthermore, the increasing adoption of e-commerce channels expands market access and facilitates sales. The market experienced a CAGR of xx% during the historical period (2019-2024) and is projected to grow at a CAGR of xx% during the forecast period (2025-2033), reaching a market size of $xx Million by 2033. Market penetration for certain product types, such as wallpaper with unique designs or smart features, is still relatively low, indicating significant growth potential. The competitive landscape is characterized by intense rivalry among established players and emerging brands, leading to innovation in product offerings and marketing strategies. The residential segment accounts for the largest share of the market, primarily driven by rising homeownership rates and home improvement activities.
Dominant Markets & Segments in US Wallcovering Industry
The residential segment dominates the US wallcovering market by application, accounting for approximately xx% of total revenue in 2025. The dominance is attributed to factors like increasing homeownership rates, home renovation projects, and the desire for aesthetically pleasing interiors. Within the end-user segment, specialty stores and home centers hold significant market shares, owing to their extensive reach and established distribution networks. Wallpaper remains the most popular type of wallcovering.
- Key Drivers for Residential Segment Dominance:
- Rising disposable incomes
- Increased focus on home improvement and interior design
- Growing preference for personalized home décor
- Key Drivers for Specialty Store & Home Center Dominance:
- Strong established distribution networks
- Wide product assortment
- Convenient access for consumers
- Wallpaper Market Dominance:
- Established market presence
- Diverse designs and patterns available
- Affordability relative to other options
US Wallcovering Industry Product Developments
Recent product innovations have centered on sustainable and eco-friendly materials, improved durability, and enhanced design aesthetics. The integration of smart technology, such as interactive wallpapers or sound-dampening materials, is emerging as a key area of product development. These advancements cater to growing consumer demand for functional and stylish wall coverings that enhance the overall living experience. Manufacturers are focusing on creating niche product lines to appeal to specific target markets and lifestyles.
Report Scope & Segmentation Analysis
This report segments the US wallcovering market by application (residential, commercial), end-user (specialty store, home center, furniture store, mass merchandiser, e-commerce, other end users), and type (wall panel, tiles, metal wall, wallpaper). Each segment's market size, growth projections, and competitive dynamics are analyzed.
- By Application: The residential segment is projected to exhibit higher growth rates than the commercial segment over the forecast period.
- By End-User: E-commerce is anticipated to witness the fastest growth rate due to increasing online shopping and the rising adoption of digital platforms.
- By Type: Wallpaper continues to dominate, but wall panels and tiles are gaining popularity due to their durability and ease of installation.
Key Drivers of US Wallcovering Industry Growth
The US wallcovering industry's growth is propelled by several factors. These include rising disposable incomes among consumers, increasing interest in home improvement and interior design, and technological advancements leading to innovative and sustainable products. Government initiatives promoting green building practices also create demand for environmentally friendly wall coverings.
Challenges in the US Wallcovering Industry Sector
The industry faces challenges, including price volatility in raw materials, increased competition from substitute products, and stringent environmental regulations. Fluctuations in global supply chains also impact production and distribution costs.
Emerging Opportunities in US Wallcovering Industry
The industry presents several opportunities. The growing popularity of smart homes and the development of smart wall coverings present a significant potential market. The demand for sustainable and eco-friendly options also opens doors for innovation and growth. Expansion into niche markets and exploring new distribution channels can further drive industry growth.
Leading Players in the US Wallcovering Industry Market
- Crossville Inc
- The Valspar Company
- Len-Tex Corporation
- Brewster Home Fashion
- Ahlstrom-Munksjö Oyj
- Wallquest Inc
- Rust-Oleum Corporation
- Sherwin-Williams Company
- Johns Manville Corporation
- York Wall Coverings
- Benjamin Moore & Co
- Georgia-Pacific
- F Schumacher
- Koroseal Wall Protection
- Mohawk Industries Inc
Key Developments in US Wallcovering Industry Industry
- Jan 2023: Mohawk Industries launched a new line of sustainable wallcoverings made from recycled materials.
- Oct 2022: Sherwin-Williams acquired a smaller wallcovering manufacturer, expanding its product portfolio.
- Further key developments will be added in the final report
Strategic Outlook for US Wallcovering Industry Market
The US wallcovering market is poised for sustained growth, driven by robust demand from both residential and commercial sectors. Innovations in materials, design, and technology will continue to shape the market, creating opportunities for established players and new entrants. A focus on sustainability and eco-friendly options will further drive growth and shape future industry dynamics. The market is expected to witness further consolidation, with larger players acquiring smaller businesses to enhance their market presence and product offerings.
US Wallcovering Industry Segmentation
-
1. Type
- 1.1. Wall Panel
- 1.2. Tiles
- 1.3. Metal Wall
-
1.4. Wallpaper
- 1.4.1. Vinyl
- 1.4.2. Non-woven Wallpaper
- 1.4.3. Paper-based Wallpaper
- 1.4.4. Fabric Wallpapers
- 1.4.5. Other Wallpaper Types
-
2. Application
- 2.1. Residential
- 2.2. Commercial
-
3. End User
- 3.1. Specialty Store
- 3.2. Home Center
- 3.3. Furniture Store
- 3.4. Mass Merchandizer
- 3.5. E-commerce
- 3.6. Other End Users
US Wallcovering Industry Segmentation By Geography
-
1. North America
- 1.1. United States
- 1.2. Canada
- 1.3. Mexico
-
2. South America
- 2.1. Brazil
- 2.2. Argentina
- 2.3. Rest of South America
-
3. Europe
- 3.1. United Kingdom
- 3.2. Germany
- 3.3. France
- 3.4. Italy
- 3.5. Spain
- 3.6. Russia
- 3.7. Benelux
- 3.8. Nordics
- 3.9. Rest of Europe
-
4. Middle East & Africa
- 4.1. Turkey
- 4.2. Israel
- 4.3. GCC
- 4.4. North Africa
- 4.5. South Africa
- 4.6. Rest of Middle East & Africa
-
5. Asia Pacific
- 5.1. China
- 5.2. India
- 5.3. Japan
- 5.4. South Korea
- 5.5. ASEAN
- 5.6. Oceania
- 5.7. Rest of Asia Pacific
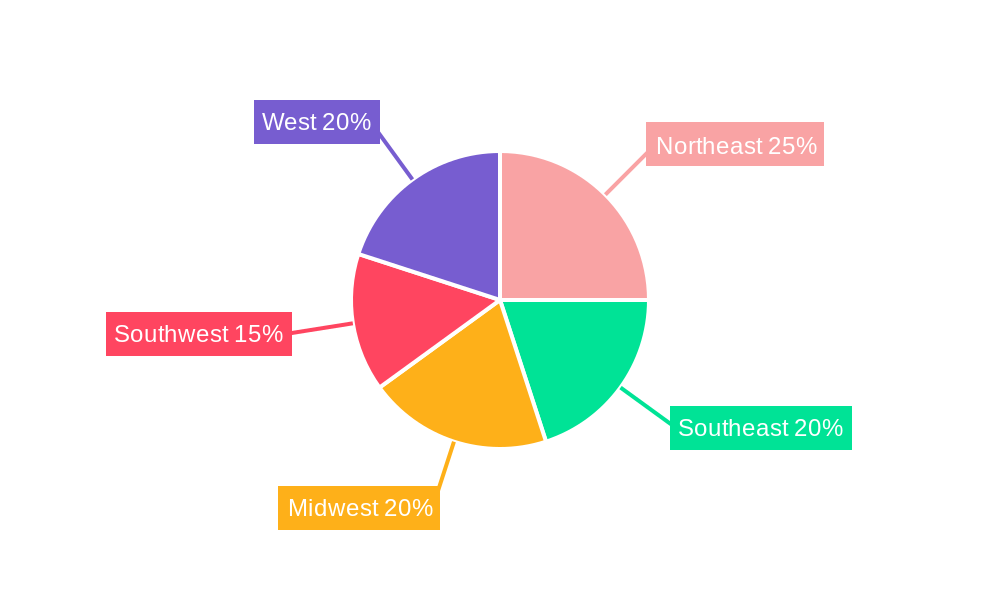
US Wallcovering Industry Regional Market Share
Geographic Coverage of US Wallcovering Industry
US Wallcovering Industry REPORT HIGHLIGHTS
| Aspects | Details |
|---|---|
| Study Period | 2020-2034 |
| Base Year | 2025 |
| Estimated Year | 2026 |
| Forecast Period | 2026-2034 |
| Historical Period | 2020-2025 |
| Growth Rate | CAGR of 4.6% from 2020-2034 |
| Segmentation |
|
Table of Contents
- 1. Introduction
- 1.1. Research Scope
- 1.2. Market Segmentation
- 1.3. Research Objective
- 1.4. Definitions and Assumptions
- 2. Executive Summary
- 2.1. Market Snapshot
- 3. Market Dynamics
- 3.1. Market Drivers
- 3.2. Market Restrains
- 3.3. Market Trends
- 3.4. Market Opportunities
- 4. Market Factor Analysis
- 4.1. Porters Five Forces
- 4.1.1. Bargaining Power of Suppliers
- 4.1.2. Bargaining Power of Buyers
- 4.1.3. Threat of New Entrants
- 4.1.4. Threat of Substitutes
- 4.1.5. Competitive Rivalry
- 4.2. PESTEL analysis
- 4.3. BCG Analysis
- 4.3.1. Stars (High Growth, High Market Share)
- 4.3.2. Cash Cows (Low Growth, High Market Share)
- 4.3.3. Question Mark (High Growth, Low Market Share)
- 4.3.4. Dogs (Low Growth, Low Market Share)
- 4.4. Ansoff Matrix Analysis
- 4.5. Supply Chain Analysis
- 4.6. Regulatory Landscape
- 4.7. Current Market Potential and Opportunity Assessment (TAM–SAM–SOM Framework)
- 4.8. RAX Analyst Note
- 4.1. Porters Five Forces
- 5. Market Analysis, Insights and Forecast 2021-2033
- 5.1. Market Analysis, Insights and Forecast - by Type
- 5.1.1. Wall Panel
- 5.1.2. Tiles
- 5.1.3. Metal Wall
- 5.1.4. Wallpaper
- 5.1.4.1. Vinyl
- 5.1.4.2. Non-woven Wallpaper
- 5.1.4.3. Paper-based Wallpaper
- 5.1.4.4. Fabric Wallpapers
- 5.1.4.5. Other Wallpaper Types
- 5.2. Market Analysis, Insights and Forecast - by Application
- 5.2.1. Residential
- 5.2.2. Commercial
- 5.3. Market Analysis, Insights and Forecast - by End User
- 5.3.1. Specialty Store
- 5.3.2. Home Center
- 5.3.3. Furniture Store
- 5.3.4. Mass Merchandizer
- 5.3.5. E-commerce
- 5.3.6. Other End Users
- 5.4. Market Analysis, Insights and Forecast - by Region
- 5.4.1. North America
- 5.4.2. South America
- 5.4.3. Europe
- 5.4.4. Middle East & Africa
- 5.4.5. Asia Pacific
- 5.1. Market Analysis, Insights and Forecast - by Type
- 6. Global US Wallcovering Industry Analysis, Insights and Forecast, 2021-2033
- 6.1. Market Analysis, Insights and Forecast - by Type
- 6.1.1. Wall Panel
- 6.1.2. Tiles
- 6.1.3. Metal Wall
- 6.1.4. Wallpaper
- 6.1.4.1. Vinyl
- 6.1.4.2. Non-woven Wallpaper
- 6.1.4.3. Paper-based Wallpaper
- 6.1.4.4. Fabric Wallpapers
- 6.1.4.5. Other Wallpaper Types
- 6.2. Market Analysis, Insights and Forecast - by Application
- 6.2.1. Residential
- 6.2.2. Commercial
- 6.3. Market Analysis, Insights and Forecast - by End User
- 6.3.1. Specialty Store
- 6.3.2. Home Center
- 6.3.3. Furniture Store
- 6.3.4. Mass Merchandizer
- 6.3.5. E-commerce
- 6.3.6. Other End Users
- 6.1. Market Analysis, Insights and Forecast - by Type
- 7. North America US Wallcovering Industry Analysis, Insights and Forecast, 2020-2032
- 7.1. Market Analysis, Insights and Forecast - by Type
- 7.1.1. Wall Panel
- 7.1.2. Tiles
- 7.1.3. Metal Wall
- 7.1.4. Wallpaper
- 7.1.4.1. Vinyl
- 7.1.4.2. Non-woven Wallpaper
- 7.1.4.3. Paper-based Wallpaper
- 7.1.4.4. Fabric Wallpapers
- 7.1.4.5. Other Wallpaper Types
- 7.2. Market Analysis, Insights and Forecast - by Application
- 7.2.1. Residential
- 7.2.2. Commercial
- 7.3. Market Analysis, Insights and Forecast - by End User
- 7.3.1. Specialty Store
- 7.3.2. Home Center
- 7.3.3. Furniture Store
- 7.3.4. Mass Merchandizer
- 7.3.5. E-commerce
- 7.3.6. Other End Users
- 7.1. Market Analysis, Insights and Forecast - by Type
- 8. South America US Wallcovering Industry Analysis, Insights and Forecast, 2020-2032
- 8.1. Market Analysis, Insights and Forecast - by Type
- 8.1.1. Wall Panel
- 8.1.2. Tiles
- 8.1.3. Metal Wall
- 8.1.4. Wallpaper
- 8.1.4.1. Vinyl
- 8.1.4.2. Non-woven Wallpaper
- 8.1.4.3. Paper-based Wallpaper
- 8.1.4.4. Fabric Wallpapers
- 8.1.4.5. Other Wallpaper Types
- 8.2. Market Analysis, Insights and Forecast - by Application
- 8.2.1. Residential
- 8.2.2. Commercial
- 8.3. Market Analysis, Insights and Forecast - by End User
- 8.3.1. Specialty Store
- 8.3.2. Home Center
- 8.3.3. Furniture Store
- 8.3.4. Mass Merchandizer
- 8.3.5. E-commerce
- 8.3.6. Other End Users
- 8.1. Market Analysis, Insights and Forecast - by Type
- 9. Europe US Wallcovering Industry Analysis, Insights and Forecast, 2020-2032
- 9.1. Market Analysis, Insights and Forecast - by Type
- 9.1.1. Wall Panel
- 9.1.2. Tiles
- 9.1.3. Metal Wall
- 9.1.4. Wallpaper
- 9.1.4.1. Vinyl
- 9.1.4.2. Non-woven Wallpaper
- 9.1.4.3. Paper-based Wallpaper
- 9.1.4.4. Fabric Wallpapers
- 9.1.4.5. Other Wallpaper Types
- 9.2. Market Analysis, Insights and Forecast - by Application
- 9.2.1. Residential
- 9.2.2. Commercial
- 9.3. Market Analysis, Insights and Forecast - by End User
- 9.3.1. Specialty Store
- 9.3.2. Home Center
- 9.3.3. Furniture Store
- 9.3.4. Mass Merchandizer
- 9.3.5. E-commerce
- 9.3.6. Other End Users
- 9.1. Market Analysis, Insights and Forecast - by Type
- 10. Middle East & Africa US Wallcovering Industry Analysis, Insights and Forecast, 2020-2032
- 10.1. Market Analysis, Insights and Forecast - by Type
- 10.1.1. Wall Panel
- 10.1.2. Tiles
- 10.1.3. Metal Wall
- 10.1.4. Wallpaper
- 10.1.4.1. Vinyl
- 10.1.4.2. Non-woven Wallpaper
- 10.1.4.3. Paper-based Wallpaper
- 10.1.4.4. Fabric Wallpapers
- 10.1.4.5. Other Wallpaper Types
- 10.2. Market Analysis, Insights and Forecast - by Application
- 10.2.1. Residential
- 10.2.2. Commercial
- 10.3. Market Analysis, Insights and Forecast - by End User
- 10.3.1. Specialty Store
- 10.3.2. Home Center
- 10.3.3. Furniture Store
- 10.3.4. Mass Merchandizer
- 10.3.5. E-commerce
- 10.3.6. Other End Users
- 10.1. Market Analysis, Insights and Forecast - by Type
- 11. Asia Pacific US Wallcovering Industry Analysis, Insights and Forecast, 2020-2032
- 11.1. Market Analysis, Insights and Forecast - by Type
- 11.1.1. Wall Panel
- 11.1.2. Tiles
- 11.1.3. Metal Wall
- 11.1.4. Wallpaper
- 11.1.4.1. Vinyl
- 11.1.4.2. Non-woven Wallpaper
- 11.1.4.3. Paper-based Wallpaper
- 11.1.4.4. Fabric Wallpapers
- 11.1.4.5. Other Wallpaper Types
- 11.2. Market Analysis, Insights and Forecast - by Application
- 11.2.1. Residential
- 11.2.2. Commercial
- 11.3. Market Analysis, Insights and Forecast - by End User
- 11.3.1. Specialty Store
- 11.3.2. Home Center
- 11.3.3. Furniture Store
- 11.3.4. Mass Merchandizer
- 11.3.5. E-commerce
- 11.3.6. Other End Users
- 11.1. Market Analysis, Insights and Forecast - by Type
- 12. Competitive Analysis
- 12.1. Company Profiles
- 12.1.1 Crossville Inc
- 12.1.1.1. Company Overview
- 12.1.1.2. Products
- 12.1.1.3. Company Financials
- 12.1.1.4. SWOT Analysis
- 12.1.2 The Valspar Company
- 12.1.2.1. Company Overview
- 12.1.2.2. Products
- 12.1.2.3. Company Financials
- 12.1.2.4. SWOT Analysis
- 12.1.3 Len-Tex Corporation
- 12.1.3.1. Company Overview
- 12.1.3.2. Products
- 12.1.3.3. Company Financials
- 12.1.3.4. SWOT Analysis
- 12.1.4 Brewster Home Fashion
- 12.1.4.1. Company Overview
- 12.1.4.2. Products
- 12.1.4.3. Company Financials
- 12.1.4.4. SWOT Analysis
- 12.1.5 Ahlstrom-Munksjö Oyj
- 12.1.5.1. Company Overview
- 12.1.5.2. Products
- 12.1.5.3. Company Financials
- 12.1.5.4. SWOT Analysis
- 12.1.6 Wallquest Inc *List Not Exhaustive
- 12.1.6.1. Company Overview
- 12.1.6.2. Products
- 12.1.6.3. Company Financials
- 12.1.6.4. SWOT Analysis
- 12.1.7 Rust-Oleum Coproration
- 12.1.7.1. Company Overview
- 12.1.7.2. Products
- 12.1.7.3. Company Financials
- 12.1.7.4. SWOT Analysis
- 12.1.8 Sherwin-Williams Company
- 12.1.8.1. Company Overview
- 12.1.8.2. Products
- 12.1.8.3. Company Financials
- 12.1.8.4. SWOT Analysis
- 12.1.9 Johns Manville Corporation
- 12.1.9.1. Company Overview
- 12.1.9.2. Products
- 12.1.9.3. Company Financials
- 12.1.9.4. SWOT Analysis
- 12.1.10 York Wall Coverings
- 12.1.10.1. Company Overview
- 12.1.10.2. Products
- 12.1.10.3. Company Financials
- 12.1.10.4. SWOT Analysis
- 12.1.11 Benjamin Moore & Co
- 12.1.11.1. Company Overview
- 12.1.11.2. Products
- 12.1.11.3. Company Financials
- 12.1.11.4. SWOT Analysis
- 12.1.12 Georgia-Pacific
- 12.1.12.1. Company Overview
- 12.1.12.2. Products
- 12.1.12.3. Company Financials
- 12.1.12.4. SWOT Analysis
- 12.1.13 F Schumacher
- 12.1.13.1. Company Overview
- 12.1.13.2. Products
- 12.1.13.3. Company Financials
- 12.1.13.4. SWOT Analysis
- 12.1.14 Koroseal Wall Protection
- 12.1.14.1. Company Overview
- 12.1.14.2. Products
- 12.1.14.3. Company Financials
- 12.1.14.4. SWOT Analysis
- 12.1.15 Mohawk Industries Inc
- 12.1.15.1. Company Overview
- 12.1.15.2. Products
- 12.1.15.3. Company Financials
- 12.1.15.4. SWOT Analysis
- 12.1.1 Crossville Inc
- 12.2. Market Entropy
- 12.2.1 Company's Key Areas Served
- 12.2.2 Recent Developments
- 12.3. Company Market Share Analysis 2025
- 12.3.1 Top 5 Companies Market Share Analysis
- 12.3.2 Top 3 Companies Market Share Analysis
- 12.4. List of Potential Customers
- 13. Research Methodology
List of Figures
- Figure 1: Global US Wallcovering Industry Revenue Breakdown (million, %) by Region 2025 & 2033
- Figure 2: North America US Wallcovering Industry Revenue (million), by Type 2025 & 2033
- Figure 3: North America US Wallcovering Industry Revenue Share (%), by Type 2025 & 2033
- Figure 4: North America US Wallcovering Industry Revenue (million), by Application 2025 & 2033
- Figure 5: North America US Wallcovering Industry Revenue Share (%), by Application 2025 & 2033
- Figure 6: North America US Wallcovering Industry Revenue (million), by End User 2025 & 2033
- Figure 7: North America US Wallcovering Industry Revenue Share (%), by End User 2025 & 2033
- Figure 8: North America US Wallcovering Industry Revenue (million), by Country 2025 & 2033
- Figure 9: North America US Wallcovering Industry Revenue Share (%), by Country 2025 & 2033
- Figure 10: South America US Wallcovering Industry Revenue (million), by Type 2025 & 2033
- Figure 11: South America US Wallcovering Industry Revenue Share (%), by Type 2025 & 2033
- Figure 12: South America US Wallcovering Industry Revenue (million), by Application 2025 & 2033
- Figure 13: South America US Wallcovering Industry Revenue Share (%), by Application 2025 & 2033
- Figure 14: South America US Wallcovering Industry Revenue (million), by End User 2025 & 2033
- Figure 15: South America US Wallcovering Industry Revenue Share (%), by End User 2025 & 2033
- Figure 16: South America US Wallcovering Industry Revenue (million), by Country 2025 & 2033
- Figure 17: South America US Wallcovering Industry Revenue Share (%), by Country 2025 & 2033
- Figure 18: Europe US Wallcovering Industry Revenue (million), by Type 2025 & 2033
- Figure 19: Europe US Wallcovering Industry Revenue Share (%), by Type 2025 & 2033
- Figure 20: Europe US Wallcovering Industry Revenue (million), by Application 2025 & 2033
- Figure 21: Europe US Wallcovering Industry Revenue Share (%), by Application 2025 & 2033
- Figure 22: Europe US Wallcovering Industry Revenue (million), by End User 2025 & 2033
- Figure 23: Europe US Wallcovering Industry Revenue Share (%), by End User 2025 & 2033
- Figure 24: Europe US Wallcovering Industry Revenue (million), by Country 2025 & 2033
- Figure 25: Europe US Wallcovering Industry Revenue Share (%), by Country 2025 & 2033
- Figure 26: Middle East & Africa US Wallcovering Industry Revenue (million), by Type 2025 & 2033
- Figure 27: Middle East & Africa US Wallcovering Industry Revenue Share (%), by Type 2025 & 2033
- Figure 28: Middle East & Africa US Wallcovering Industry Revenue (million), by Application 2025 & 2033
- Figure 29: Middle East & Africa US Wallcovering Industry Revenue Share (%), by Application 2025 & 2033
- Figure 30: Middle East & Africa US Wallcovering Industry Revenue (million), by End User 2025 & 2033
- Figure 31: Middle East & Africa US Wallcovering Industry Revenue Share (%), by End User 2025 & 2033
- Figure 32: Middle East & Africa US Wallcovering Industry Revenue (million), by Country 2025 & 2033
- Figure 33: Middle East & Africa US Wallcovering Industry Revenue Share (%), by Country 2025 & 2033
- Figure 34: Asia Pacific US Wallcovering Industry Revenue (million), by Type 2025 & 2033
- Figure 35: Asia Pacific US Wallcovering Industry Revenue Share (%), by Type 2025 & 2033
- Figure 36: Asia Pacific US Wallcovering Industry Revenue (million), by Application 2025 & 2033
- Figure 37: Asia Pacific US Wallcovering Industry Revenue Share (%), by Application 2025 & 2033
- Figure 38: Asia Pacific US Wallcovering Industry Revenue (million), by End User 2025 & 2033
- Figure 39: Asia Pacific US Wallcovering Industry Revenue Share (%), by End User 2025 & 2033
- Figure 40: Asia Pacific US Wallcovering Industry Revenue (million), by Country 2025 & 2033
- Figure 41: Asia Pacific US Wallcovering Industry Revenue Share (%), by Country 2025 & 2033
List of Tables
- Table 1: Global US Wallcovering Industry Revenue million Forecast, by Type 2020 & 2033
- Table 2: Global US Wallcovering Industry Revenue million Forecast, by Application 2020 & 2033
- Table 3: Global US Wallcovering Industry Revenue million Forecast, by End User 2020 & 2033
- Table 4: Global US Wallcovering Industry Revenue million Forecast, by Region 2020 & 2033
- Table 5: Global US Wallcovering Industry Revenue million Forecast, by Type 2020 & 2033
- Table 6: Global US Wallcovering Industry Revenue million Forecast, by Application 2020 & 2033
- Table 7: Global US Wallcovering Industry Revenue million Forecast, by End User 2020 & 2033
- Table 8: Global US Wallcovering Industry Revenue million Forecast, by Country 2020 & 2033
- Table 9: United States US Wallcovering Industry Revenue (million) Forecast, by Application 2020 & 2033
- Table 10: Canada US Wallcovering Industry Revenue (million) Forecast, by Application 2020 & 2033
- Table 11: Mexico US Wallcovering Industry Revenue (million) Forecast, by Application 2020 & 2033
- Table 12: Global US Wallcovering Industry Revenue million Forecast, by Type 2020 & 2033
- Table 13: Global US Wallcovering Industry Revenue million Forecast, by Application 2020 & 2033
- Table 14: Global US Wallcovering Industry Revenue million Forecast, by End User 2020 & 2033
- Table 15: Global US Wallcovering Industry Revenue million Forecast, by Country 2020 & 2033
- Table 16: Brazil US Wallcovering Industry Revenue (million) Forecast, by Application 2020 & 2033
- Table 17: Argentina US Wallcovering Industry Revenue (million) Forecast, by Application 2020 & 2033
- Table 18: Rest of South America US Wallcovering Industry Revenue (million) Forecast, by Application 2020 & 2033
- Table 19: Global US Wallcovering Industry Revenue million Forecast, by Type 2020 & 2033
- Table 20: Global US Wallcovering Industry Revenue million Forecast, by Application 2020 & 2033
- Table 21: Global US Wallcovering Industry Revenue million Forecast, by End User 2020 & 2033
- Table 22: Global US Wallcovering Industry Revenue million Forecast, by Country 2020 & 2033
- Table 23: United Kingdom US Wallcovering Industry Revenue (million) Forecast, by Application 2020 & 2033
- Table 24: Germany US Wallcovering Industry Revenue (million) Forecast, by Application 2020 & 2033
- Table 25: France US Wallcovering Industry Revenue (million) Forecast, by Application 2020 & 2033
- Table 26: Italy US Wallcovering Industry Revenue (million) Forecast, by Application 2020 & 2033
- Table 27: Spain US Wallcovering Industry Revenue (million) Forecast, by Application 2020 & 2033
- Table 28: Russia US Wallcovering Industry Revenue (million) Forecast, by Application 2020 & 2033
- Table 29: Benelux US Wallcovering Industry Revenue (million) Forecast, by Application 2020 & 2033
- Table 30: Nordics US Wallcovering Industry Revenue (million) Forecast, by Application 2020 & 2033
- Table 31: Rest of Europe US Wallcovering Industry Revenue (million) Forecast, by Application 2020 & 2033
- Table 32: Global US Wallcovering Industry Revenue million Forecast, by Type 2020 & 2033
- Table 33: Global US Wallcovering Industry Revenue million Forecast, by Application 2020 & 2033
- Table 34: Global US Wallcovering Industry Revenue million Forecast, by End User 2020 & 2033
- Table 35: Global US Wallcovering Industry Revenue million Forecast, by Country 2020 & 2033
- Table 36: Turkey US Wallcovering Industry Revenue (million) Forecast, by Application 2020 & 2033
- Table 37: Israel US Wallcovering Industry Revenue (million) Forecast, by Application 2020 & 2033
- Table 38: GCC US Wallcovering Industry Revenue (million) Forecast, by Application 2020 & 2033
- Table 39: North Africa US Wallcovering Industry Revenue (million) Forecast, by Application 2020 & 2033
- Table 40: South Africa US Wallcovering Industry Revenue (million) Forecast, by Application 2020 & 2033
- Table 41: Rest of Middle East & Africa US Wallcovering Industry Revenue (million) Forecast, by Application 2020 & 2033
- Table 42: Global US Wallcovering Industry Revenue million Forecast, by Type 2020 & 2033
- Table 43: Global US Wallcovering Industry Revenue million Forecast, by Application 2020 & 2033
- Table 44: Global US Wallcovering Industry Revenue million Forecast, by End User 2020 & 2033
- Table 45: Global US Wallcovering Industry Revenue million Forecast, by Country 2020 & 2033
- Table 46: China US Wallcovering Industry Revenue (million) Forecast, by Application 2020 & 2033
- Table 47: India US Wallcovering Industry Revenue (million) Forecast, by Application 2020 & 2033
- Table 48: Japan US Wallcovering Industry Revenue (million) Forecast, by Application 2020 & 2033
- Table 49: South Korea US Wallcovering Industry Revenue (million) Forecast, by Application 2020 & 2033
- Table 50: ASEAN US Wallcovering Industry Revenue (million) Forecast, by Application 2020 & 2033
- Table 51: Oceania US Wallcovering Industry Revenue (million) Forecast, by Application 2020 & 2033
- Table 52: Rest of Asia Pacific US Wallcovering Industry Revenue (million) Forecast, by Application 2020 & 2033
Frequently Asked Questions
1. What is the projected Compound Annual Growth Rate (CAGR) of the US Wallcovering Industry?
The projected CAGR is approximately 4.6%.
2. Which companies are prominent players in the US Wallcovering Industry?
Key companies in the market include Crossville Inc, The Valspar Company, Len-Tex Corporation, Brewster Home Fashion, Ahlstrom-Munksjö Oyj, Wallquest Inc *List Not Exhaustive, Rust-Oleum Coproration, Sherwin-Williams Company, Johns Manville Corporation, York Wall Coverings, Benjamin Moore & Co, Georgia-Pacific, F Schumacher, Koroseal Wall Protection, Mohawk Industries Inc.
3. What are the main segments of the US Wallcovering Industry?
The market segments include Type, Application, End User.
4. Can you provide details about the market size?
The market size is estimated to be USD 36.54 million as of 2022.
5. What are some drivers contributing to market growth?
; Rebounding Residential Construction Activity; Recovery in Wall Panel Sales Aided by Higher Awareness; Increasing Demand for Digitally Printed Solutions; Growth in Non-woven and Paper-based Wallpapers.
6. What are the notable trends driving market growth?
Rebounding Residential Construction Activity in the USA is Boosting the Market.
7. Are there any restraints impacting market growth?
; Strong Competition from the Paints Segment; Recent Changes in Macro-environment Expected to Impact Customer Spending.
8. Can you provide examples of recent developments in the market?
N/A
9. What pricing options are available for accessing the report?
Pricing options include single-user, multi-user, and enterprise licenses priced at USD 3800, USD 4500, and USD 5800 respectively.
10. Is the market size provided in terms of value or volume?
The market size is provided in terms of value, measured in million.
11. Are there any specific market keywords associated with the report?
Yes, the market keyword associated with the report is "US Wallcovering Industry," which aids in identifying and referencing the specific market segment covered.
12. How do I determine which pricing option suits my needs best?
The pricing options vary based on user requirements and access needs. Individual users may opt for single-user licenses, while businesses requiring broader access may choose multi-user or enterprise licenses for cost-effective access to the report.
13. Are there any additional resources or data provided in the US Wallcovering Industry report?
While the report offers comprehensive insights, it's advisable to review the specific contents or supplementary materials provided to ascertain if additional resources or data are available.
14. How can I stay updated on further developments or reports in the US Wallcovering Industry?
To stay informed about further developments, trends, and reports in the US Wallcovering Industry, consider subscribing to industry newsletters, following relevant companies and organizations, or regularly checking reputable industry news sources and publications.
Methodology
Step 1 - Identification of Relevant Samples Size from Population Database


Step 2 - Approaches for Defining Global Market Size (Value, Volume* & Price*)

Note*: In applicable scenarios
Step 3 - Data Sources
Primary Research
- Web Analytics
- Survey Reports
- Research Institute
- Latest Research Reports
- Opinion Leaders
Secondary Research
- Annual Reports
- White Paper
- Latest Press Release
- Industry Association
- Paid Database
- Investor Presentations

Step 4 - Data Triangulation
Involves using different sources of information in order to increase the validity of a study
These sources are likely to be stakeholders in a program - participants, other researchers, program staff, other community members, and so on.
Then we put all data in single framework & apply various statistical tools to find out the dynamic on the market.
During the analysis stage, feedback from the stakeholder groups would be compared to determine areas of agreement as well as areas of divergence