
Key Insights
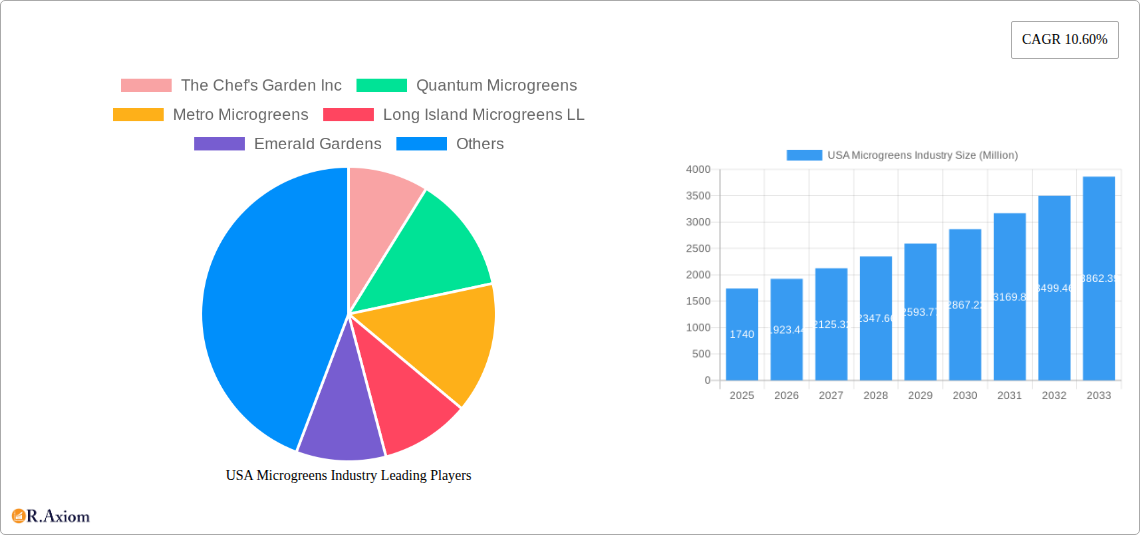
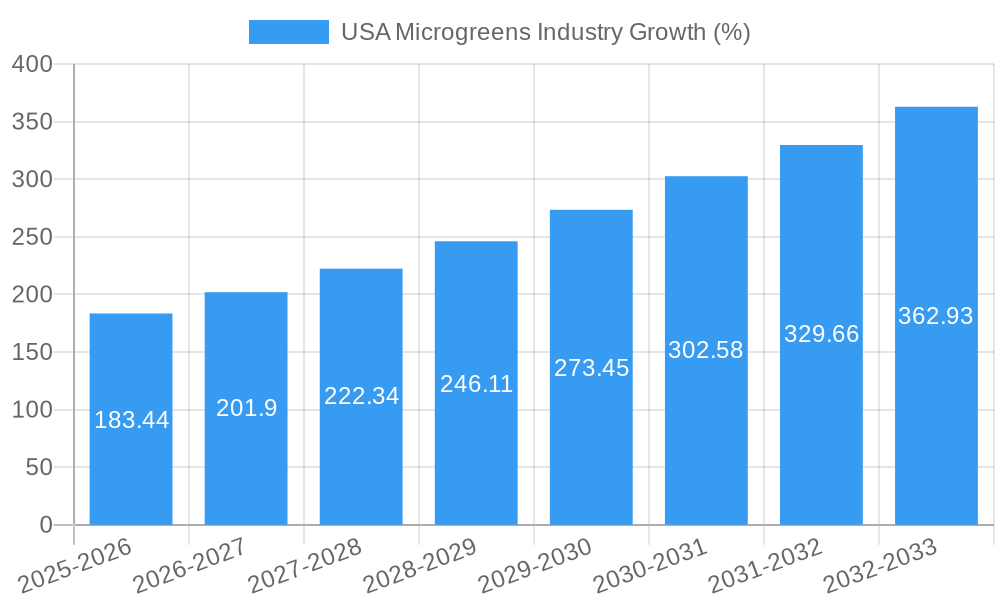
The US microgreens industry, valued at $1.74 billion in 2025, is experiencing robust growth, projected to expand at a compound annual growth rate (CAGR) of 10.60% from 2025 to 2033. This surge is driven by several key factors. Increasing consumer awareness of the nutritional benefits of microgreens, coupled with a rising preference for healthy and convenient food options, fuels significant demand. The growing popularity of plant-based diets and the increasing adoption of microgreens in restaurants and food service establishments further contribute to market expansion. Furthermore, advancements in indoor and vertical farming technologies are improving yield, reducing production costs, and enhancing year-round availability, thereby stimulating market growth. While challenges exist, such as fluctuating raw material prices and the need for specialized infrastructure, the overall market outlook remains exceptionally positive.
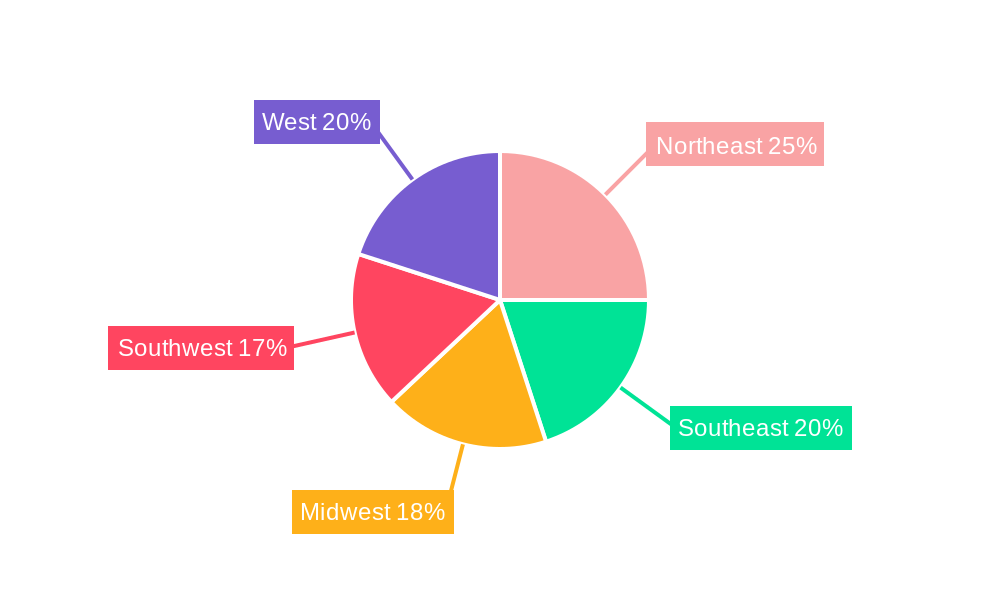
The segmentation of the US microgreens market reveals significant opportunities. Sales channels like hypermarkets and supermarkets are dominant, reflecting the increasing availability of microgreens in mainstream retail. However, the restaurant segment is witnessing strong growth as chefs incorporate microgreens into innovative dishes, catering to discerning consumers. The farming segment shows a clear preference for indoor and vertical farming methods, demonstrating the industry's adaptation to technological advancements for optimized production and sustainability. Popular microgreen varieties include broccoli, lettuce & chicory, basil, and others, reflecting consumer preferences and ease of cultivation. Key players like AeroFarms LLC, The Chef's Garden Inc., and Quantum Microgreens are driving innovation and market expansion through their technological expertise and brand recognition. Regional variations in consumption patterns exist, with potential for future growth in all regions including the Northeast, Southeast, Midwest, Southwest, and West.
This comprehensive report provides a detailed analysis of the USA microgreens industry, encompassing market size, growth projections, key players, and emerging trends from 2019 to 2033. The study period covers the historical period (2019-2024), the base year (2025), and the forecast period (2025-2033). This report is essential for industry stakeholders, investors, and anyone seeking to understand the dynamics of this rapidly evolving market.
USA Microgreens Industry Market Concentration & Innovation
This section analyzes the competitive landscape, innovation drivers, regulatory environment, and market dynamics within the USA microgreens industry. The market exhibits moderate concentration, with several key players vying for market share. While precise market share figures for individual companies require further detailed research, a few companies like AeroFarms, The Chef's Garden Inc, and Quantum Microgreens, hold substantial portions of the market. The M&A activity in this sector has been moderate in recent years, with deal values varying greatly depending on the size and scope of the acquired company. Innovation is driven primarily by advancements in vertical farming and aeroponic technologies, seeking greater efficiency and yield. Regulatory frameworks, concerning food safety and agricultural practices, play a significant role in shaping the industry's growth trajectory. Product substitutes, such as conventionally grown leafy greens, present a constant competitive pressure. End-user trends favor healthier, locally sourced produce, driving demand for microgreens.
- Key Metrics: Market share data for leading companies (to be determined based on in-depth analysis) ; M&A deal values (to be detailed in the full report)
- Innovation Drivers: Vertical farming, aeroponics, automation, precision agriculture
- Regulatory Landscape: FDA regulations, USDA guidelines, local farming regulations
USA Microgreens Industry Industry Trends & Insights
The USA microgreens industry is experiencing robust growth, fueled by a rising consumer preference for healthy and nutritious food. Increased awareness of the nutritional benefits of microgreens, their versatility in culinary applications, and their perceived "clean" image have bolstered demand. Technological advancements in vertical farming and indoor agriculture are improving production efficiency and yield, reducing reliance on traditional farming methods. The market is witnessing a gradual shift toward sustainable and eco-friendly practices. Competitive dynamics are characterized by both established players and emerging entrants vying for market share, leading to increased innovation and product diversification. The Compound Annual Growth Rate (CAGR) for the period 2025-2033 is projected to be xx%, reflecting the dynamic growth of this sector. Market penetration is increasing steadily, driven by the factors mentioned above, but specific numbers require extensive primary and secondary data analysis.
Dominant Markets & Segments in USA Microgreens Industry
The dominant segment within the USA microgreens industry presents considerable variations depending on the specific criteria used. Let’s consider some segmentations:
Sales Channels:
- Hypermarket/Supermarket: This channel represents a significant portion of the market due to high consumer access. Key drivers include increased consumer awareness, retail expansion, and product diversification.
- Restaurants: The restaurant sector is a crucial market driver due to chefs’ growing interest in incorporating microgreens into their menus.
- Other Channels: This category encompasses direct-to-consumer sales, farmers' markets, and online retailers, offering diverse market access and growth potential.
Farming Techniques:
- Indoor Farming: This is a rapidly growing segment, driven by controlled environments, enhanced quality, and increased production efficiency.
- Vertical Farming: This innovative approach maximizes space utilization and offers high-yield potential. It drives efficiency and sustainability.
- Commercial Greenhouses: This segment offers a balance between controlled environments and scalability, providing a strong presence in the market.
- Other Farming Techniques: This category includes traditional field cultivation and other less-common methods.
Microgreen Types: The market exhibits a diverse range of microgreens types, each with its own characteristics: Broccoli, Lettuce and Chicory, Basil, Fennel, Carrots, Radish, Amaranth, Arugula, Beets, Mustard, Kale, Cress and Chard are major contributors to the overall market volume. Market dominance within these types is likely to fluctuate based on seasonal availability, consumer preferences, and production efficiencies.
(A detailed analysis of the dominance in each segment including key drivers is provided in the full report)
USA Microgreens Industry Product Developments
Recent years have seen significant product innovations, including new microgreen varieties, improved packaging to maintain freshness and quality, and the development of tailored microgreen blends for specific culinary applications. These advancements address the market's demand for variety, quality, and convenience. Technological trends in hydroponics and aeroponics continue to drive innovation, leading to improved yields, reduced resource usage, and enhanced product consistency. Market fit is enhanced by focusing on consumer preferences for convenience, taste, and nutritional benefits.
Report Scope & Segmentation Analysis
This report comprehensively segments the USA microgreens market based on Sales Channels (Hypermarket/Supermarket, Restaurants, Other Channels), Farming Techniques (Indoor Farming, Vertical Farming, Commercial Greenhouses, Other Farming Techniques), and Microgreen Types (Broccoli, Lettuce and Chicory, Basil, Fennel, Carrots, Radish, Amaranth, Arugula, Beets, Mustard, Kale, Cress and Chard). Each segment's growth projection, market size, and competitive dynamics are analyzed in detail within the full report. The market sizes are projected to show substantial growth across all segments, with specific values requiring detailed analysis. The competitive dynamics within each segment are influenced by factors such as production scale, technology adoption, and brand recognition.
Key Drivers of USA Microgreens Industry Growth
The growth of the USA microgreens industry is driven by several key factors. Firstly, the rising consumer awareness of health and wellness fuels demand for nutrient-rich foods, placing microgreens in high demand. Secondly, technological advancements in farming techniques like vertical and indoor farming are optimizing efficiency, and yield and reducing production costs. Finally, the expanding food service industry's adoption of microgreens in menus and the retail sector's growing inventory of microgreen products further boosts growth.
Challenges in the USA Microgreens Industry Sector
Despite considerable market growth, several challenges hamper the industry. Supply chain issues and seasonal availability contribute to fluctuating prices and potential shortages. The relatively high production costs compared to conventional greens pose a barrier to wider market penetration. Furthermore, competition from established leafy green producers and the need for stringent food safety standards add to the challenges faced by businesses in this sector.
Emerging Opportunities in USA Microgreens Industry
Emerging opportunities in the USA microgreens market include the expansion into new market segments (e.g., direct-to-consumer sales, meal kit services), the development of novel microgreen varieties with enhanced nutritional profiles, and the exploration of value-added products (e.g., microgreen-infused snacks and beverages). Technological innovation, especially in automation and AI-powered farming, presents further opportunities for streamlining production and enhancing efficiency.
Leading Players in the USA Microgreens Industry Market
- The Chef's Garden Inc
- Quantum Microgreens
- Metro Microgreens
- Long Island Microgreens LL
- Emerald Gardens
- Fresh Origins
- Florida Microgreens
- Farmbox Greens LLC
- Arizona Microgreens LLC
- AeroFarms LLC
Key Developments in USA Microgreens Industry Industry
- September 2022: AeroFarms established the world's largest aeroponic smart farm in Danville, VA, significantly increasing production capacity.
- July 2022: AeroFarms expanded its vertical farm in Pittsylvania County, further boosting production to meet growing demand.
- February 2022: Infarm opened a new vertical farming center in Texas, expanding its presence in the US market.
Strategic Outlook for USA Microgreens Industry Market
The USA microgreens market holds immense future potential, driven by sustained consumer demand for healthy and nutritious food, ongoing innovation in farming technologies, and the growing adoption of microgreens across various food segments. Further market penetration and the expansion into new product lines and geographic areas are likely to shape the industry's future trajectory. The focus on sustainability and eco-friendly practices will drive the adoption of advanced farming technologies, ensuring the sector's sustainable long-term growth.
USA Microgreens Industry Segmentation
- 1. Production Analysis
- 2. Consumption Analysis
- 3. Import Market Analysis (Value & Volume)
- 4. Export Market Analysis (Value & Volume)
- 5. Price Trend Analysis
USA Microgreens Industry Segmentation By Geography
-
1. North America
- 1.1. United States
- 1.2. Canada
- 1.3. Mexico
-
2. South America
- 2.1. Brazil
- 2.2. Argentina
- 2.3. Rest of South America
-
3. Europe
- 3.1. United Kingdom
- 3.2. Germany
- 3.3. France
- 3.4. Italy
- 3.5. Spain
- 3.6. Russia
- 3.7. Benelux
- 3.8. Nordics
- 3.9. Rest of Europe
-
4. Middle East & Africa
- 4.1. Turkey
- 4.2. Israel
- 4.3. GCC
- 4.4. North Africa
- 4.5. South Africa
- 4.6. Rest of Middle East & Africa
-
5. Asia Pacific
- 5.1. China
- 5.2. India
- 5.3. Japan
- 5.4. South Korea
- 5.5. ASEAN
- 5.6. Oceania
- 5.7. Rest of Asia Pacific
USA Microgreens Industry REPORT HIGHLIGHTS
| Aspects | Details |
|---|---|
| Study Period | 2019-2033 |
| Base Year | 2024 |
| Estimated Year | 2025 |
| Forecast Period | 2025-2033 |
| Historical Period | 2019-2024 |
| Growth Rate | CAGR of 10.60% from 2019-2033 |
| Segmentation |
|
Table of Contents
- 1. Introduction
- 1.1. Research Scope
- 1.2. Market Segmentation
- 1.3. Research Methodology
- 1.4. Definitions and Assumptions
- 2. Executive Summary
- 2.1. Introduction
- 3. Market Dynamics
- 3.1. Introduction
- 3.2. Market Drivers
- 3.2.1. Need for Custom Product Development; Use of CROs for Regulatory Services
- 3.3. Market Restrains
- 3.3.1. Data and Cyber Security Concerns; Lack of Experts and Professionals in this Industry
- 3.4. Market Trends
- 3.4.1. Increased Investments in Vertical Farming Domain
- 4. Market Factor Analysis
- 4.1. Porters Five Forces
- 4.2. Supply/Value Chain
- 4.3. PESTEL analysis
- 4.4. Market Entropy
- 4.5. Patent/Trademark Analysis
- 5. Global USA Microgreens Industry Analysis, Insights and Forecast, 2019-2031
- 5.1. Market Analysis, Insights and Forecast - by Production Analysis
- 5.2. Market Analysis, Insights and Forecast - by Consumption Analysis
- 5.3. Market Analysis, Insights and Forecast - by Import Market Analysis (Value & Volume)
- 5.4. Market Analysis, Insights and Forecast - by Export Market Analysis (Value & Volume)
- 5.5. Market Analysis, Insights and Forecast - by Price Trend Analysis
- 5.6. Market Analysis, Insights and Forecast - by Region
- 5.6.1. North America
- 5.6.2. South America
- 5.6.3. Europe
- 5.6.4. Middle East & Africa
- 5.6.5. Asia Pacific
- 5.1. Market Analysis, Insights and Forecast - by Production Analysis
- 6. North America USA Microgreens Industry Analysis, Insights and Forecast, 2019-2031
- 6.1. Market Analysis, Insights and Forecast - by Production Analysis
- 6.2. Market Analysis, Insights and Forecast - by Consumption Analysis
- 6.3. Market Analysis, Insights and Forecast - by Import Market Analysis (Value & Volume)
- 6.4. Market Analysis, Insights and Forecast - by Export Market Analysis (Value & Volume)
- 6.5. Market Analysis, Insights and Forecast - by Price Trend Analysis
- 6.1. Market Analysis, Insights and Forecast - by Production Analysis
- 7. South America USA Microgreens Industry Analysis, Insights and Forecast, 2019-2031
- 7.1. Market Analysis, Insights and Forecast - by Production Analysis
- 7.2. Market Analysis, Insights and Forecast - by Consumption Analysis
- 7.3. Market Analysis, Insights and Forecast - by Import Market Analysis (Value & Volume)
- 7.4. Market Analysis, Insights and Forecast - by Export Market Analysis (Value & Volume)
- 7.5. Market Analysis, Insights and Forecast - by Price Trend Analysis
- 7.1. Market Analysis, Insights and Forecast - by Production Analysis
- 8. Europe USA Microgreens Industry Analysis, Insights and Forecast, 2019-2031
- 8.1. Market Analysis, Insights and Forecast - by Production Analysis
- 8.2. Market Analysis, Insights and Forecast - by Consumption Analysis
- 8.3. Market Analysis, Insights and Forecast - by Import Market Analysis (Value & Volume)
- 8.4. Market Analysis, Insights and Forecast - by Export Market Analysis (Value & Volume)
- 8.5. Market Analysis, Insights and Forecast - by Price Trend Analysis
- 8.1. Market Analysis, Insights and Forecast - by Production Analysis
- 9. Middle East & Africa USA Microgreens Industry Analysis, Insights and Forecast, 2019-2031
- 9.1. Market Analysis, Insights and Forecast - by Production Analysis
- 9.2. Market Analysis, Insights and Forecast - by Consumption Analysis
- 9.3. Market Analysis, Insights and Forecast - by Import Market Analysis (Value & Volume)
- 9.4. Market Analysis, Insights and Forecast - by Export Market Analysis (Value & Volume)
- 9.5. Market Analysis, Insights and Forecast - by Price Trend Analysis
- 9.1. Market Analysis, Insights and Forecast - by Production Analysis
- 10. Asia Pacific USA Microgreens Industry Analysis, Insights and Forecast, 2019-2031
- 10.1. Market Analysis, Insights and Forecast - by Production Analysis
- 10.2. Market Analysis, Insights and Forecast - by Consumption Analysis
- 10.3. Market Analysis, Insights and Forecast - by Import Market Analysis (Value & Volume)
- 10.4. Market Analysis, Insights and Forecast - by Export Market Analysis (Value & Volume)
- 10.5. Market Analysis, Insights and Forecast - by Price Trend Analysis
- 10.1. Market Analysis, Insights and Forecast - by Production Analysis
- 11. Northeast USA Microgreens Industry Analysis, Insights and Forecast, 2019-2031
- 12. Southeast USA Microgreens Industry Analysis, Insights and Forecast, 2019-2031
- 13. Midwest USA Microgreens Industry Analysis, Insights and Forecast, 2019-2031
- 14. Southwest USA Microgreens Industry Analysis, Insights and Forecast, 2019-2031
- 15. West USA Microgreens Industry Analysis, Insights and Forecast, 2019-2031
- 16. Competitive Analysis
- 16.1. Global Market Share Analysis 2024
- 16.2. Company Profiles
- 16.2.1 The Chef's Garden Inc
- 16.2.1.1. Overview
- 16.2.1.2. Products
- 16.2.1.3. SWOT Analysis
- 16.2.1.4. Recent Developments
- 16.2.1.5. Financials (Based on Availability)
- 16.2.2 Quantum Microgreens
- 16.2.2.1. Overview
- 16.2.2.2. Products
- 16.2.2.3. SWOT Analysis
- 16.2.2.4. Recent Developments
- 16.2.2.5. Financials (Based on Availability)
- 16.2.3 Metro Microgreens
- 16.2.3.1. Overview
- 16.2.3.2. Products
- 16.2.3.3. SWOT Analysis
- 16.2.3.4. Recent Developments
- 16.2.3.5. Financials (Based on Availability)
- 16.2.4 Long Island Microgreens LL
- 16.2.4.1. Overview
- 16.2.4.2. Products
- 16.2.4.3. SWOT Analysis
- 16.2.4.4. Recent Developments
- 16.2.4.5. Financials (Based on Availability)
- 16.2.5 Emerald Gardens
- 16.2.5.1. Overview
- 16.2.5.2. Products
- 16.2.5.3. SWOT Analysis
- 16.2.5.4. Recent Developments
- 16.2.5.5. Financials (Based on Availability)
- 16.2.6 Fresh Origins
- 16.2.6.1. Overview
- 16.2.6.2. Products
- 16.2.6.3. SWOT Analysis
- 16.2.6.4. Recent Developments
- 16.2.6.5. Financials (Based on Availability)
- 16.2.7 Florida Microgreens
- 16.2.7.1. Overview
- 16.2.7.2. Products
- 16.2.7.3. SWOT Analysis
- 16.2.7.4. Recent Developments
- 16.2.7.5. Financials (Based on Availability)
- 16.2.8 Farmbox Greens LLC
- 16.2.8.1. Overview
- 16.2.8.2. Products
- 16.2.8.3. SWOT Analysis
- 16.2.8.4. Recent Developments
- 16.2.8.5. Financials (Based on Availability)
- 16.2.9 Arizona Microgreens LLC
- 16.2.9.1. Overview
- 16.2.9.2. Products
- 16.2.9.3. SWOT Analysis
- 16.2.9.4. Recent Developments
- 16.2.9.5. Financials (Based on Availability)
- 16.2.10 AeroFarms LLC
- 16.2.10.1. Overview
- 16.2.10.2. Products
- 16.2.10.3. SWOT Analysis
- 16.2.10.4. Recent Developments
- 16.2.10.5. Financials (Based on Availability)
- 16.2.1 The Chef's Garden Inc
List of Figures
- Figure 1: Global USA Microgreens Industry Revenue Breakdown (Million, %) by Region 2024 & 2032
- Figure 2: United states USA Microgreens Industry Revenue (Million), by Country 2024 & 2032
- Figure 3: United states USA Microgreens Industry Revenue Share (%), by Country 2024 & 2032
- Figure 4: North America USA Microgreens Industry Revenue (Million), by Production Analysis 2024 & 2032
- Figure 5: North America USA Microgreens Industry Revenue Share (%), by Production Analysis 2024 & 2032
- Figure 6: North America USA Microgreens Industry Revenue (Million), by Consumption Analysis 2024 & 2032
- Figure 7: North America USA Microgreens Industry Revenue Share (%), by Consumption Analysis 2024 & 2032
- Figure 8: North America USA Microgreens Industry Revenue (Million), by Import Market Analysis (Value & Volume) 2024 & 2032
- Figure 9: North America USA Microgreens Industry Revenue Share (%), by Import Market Analysis (Value & Volume) 2024 & 2032
- Figure 10: North America USA Microgreens Industry Revenue (Million), by Export Market Analysis (Value & Volume) 2024 & 2032
- Figure 11: North America USA Microgreens Industry Revenue Share (%), by Export Market Analysis (Value & Volume) 2024 & 2032
- Figure 12: North America USA Microgreens Industry Revenue (Million), by Price Trend Analysis 2024 & 2032
- Figure 13: North America USA Microgreens Industry Revenue Share (%), by Price Trend Analysis 2024 & 2032
- Figure 14: North America USA Microgreens Industry Revenue (Million), by Country 2024 & 2032
- Figure 15: North America USA Microgreens Industry Revenue Share (%), by Country 2024 & 2032
- Figure 16: South America USA Microgreens Industry Revenue (Million), by Production Analysis 2024 & 2032
- Figure 17: South America USA Microgreens Industry Revenue Share (%), by Production Analysis 2024 & 2032
- Figure 18: South America USA Microgreens Industry Revenue (Million), by Consumption Analysis 2024 & 2032
- Figure 19: South America USA Microgreens Industry Revenue Share (%), by Consumption Analysis 2024 & 2032
- Figure 20: South America USA Microgreens Industry Revenue (Million), by Import Market Analysis (Value & Volume) 2024 & 2032
- Figure 21: South America USA Microgreens Industry Revenue Share (%), by Import Market Analysis (Value & Volume) 2024 & 2032
- Figure 22: South America USA Microgreens Industry Revenue (Million), by Export Market Analysis (Value & Volume) 2024 & 2032
- Figure 23: South America USA Microgreens Industry Revenue Share (%), by Export Market Analysis (Value & Volume) 2024 & 2032
- Figure 24: South America USA Microgreens Industry Revenue (Million), by Price Trend Analysis 2024 & 2032
- Figure 25: South America USA Microgreens Industry Revenue Share (%), by Price Trend Analysis 2024 & 2032
- Figure 26: South America USA Microgreens Industry Revenue (Million), by Country 2024 & 2032
- Figure 27: South America USA Microgreens Industry Revenue Share (%), by Country 2024 & 2032
- Figure 28: Europe USA Microgreens Industry Revenue (Million), by Production Analysis 2024 & 2032
- Figure 29: Europe USA Microgreens Industry Revenue Share (%), by Production Analysis 2024 & 2032
- Figure 30: Europe USA Microgreens Industry Revenue (Million), by Consumption Analysis 2024 & 2032
- Figure 31: Europe USA Microgreens Industry Revenue Share (%), by Consumption Analysis 2024 & 2032
- Figure 32: Europe USA Microgreens Industry Revenue (Million), by Import Market Analysis (Value & Volume) 2024 & 2032
- Figure 33: Europe USA Microgreens Industry Revenue Share (%), by Import Market Analysis (Value & Volume) 2024 & 2032
- Figure 34: Europe USA Microgreens Industry Revenue (Million), by Export Market Analysis (Value & Volume) 2024 & 2032
- Figure 35: Europe USA Microgreens Industry Revenue Share (%), by Export Market Analysis (Value & Volume) 2024 & 2032
- Figure 36: Europe USA Microgreens Industry Revenue (Million), by Price Trend Analysis 2024 & 2032
- Figure 37: Europe USA Microgreens Industry Revenue Share (%), by Price Trend Analysis 2024 & 2032
- Figure 38: Europe USA Microgreens Industry Revenue (Million), by Country 2024 & 2032
- Figure 39: Europe USA Microgreens Industry Revenue Share (%), by Country 2024 & 2032
- Figure 40: Middle East & Africa USA Microgreens Industry Revenue (Million), by Production Analysis 2024 & 2032
- Figure 41: Middle East & Africa USA Microgreens Industry Revenue Share (%), by Production Analysis 2024 & 2032
- Figure 42: Middle East & Africa USA Microgreens Industry Revenue (Million), by Consumption Analysis 2024 & 2032
- Figure 43: Middle East & Africa USA Microgreens Industry Revenue Share (%), by Consumption Analysis 2024 & 2032
- Figure 44: Middle East & Africa USA Microgreens Industry Revenue (Million), by Import Market Analysis (Value & Volume) 2024 & 2032
- Figure 45: Middle East & Africa USA Microgreens Industry Revenue Share (%), by Import Market Analysis (Value & Volume) 2024 & 2032
- Figure 46: Middle East & Africa USA Microgreens Industry Revenue (Million), by Export Market Analysis (Value & Volume) 2024 & 2032
- Figure 47: Middle East & Africa USA Microgreens Industry Revenue Share (%), by Export Market Analysis (Value & Volume) 2024 & 2032
- Figure 48: Middle East & Africa USA Microgreens Industry Revenue (Million), by Price Trend Analysis 2024 & 2032
- Figure 49: Middle East & Africa USA Microgreens Industry Revenue Share (%), by Price Trend Analysis 2024 & 2032
- Figure 50: Middle East & Africa USA Microgreens Industry Revenue (Million), by Country 2024 & 2032
- Figure 51: Middle East & Africa USA Microgreens Industry Revenue Share (%), by Country 2024 & 2032
- Figure 52: Asia Pacific USA Microgreens Industry Revenue (Million), by Production Analysis 2024 & 2032
- Figure 53: Asia Pacific USA Microgreens Industry Revenue Share (%), by Production Analysis 2024 & 2032
- Figure 54: Asia Pacific USA Microgreens Industry Revenue (Million), by Consumption Analysis 2024 & 2032
- Figure 55: Asia Pacific USA Microgreens Industry Revenue Share (%), by Consumption Analysis 2024 & 2032
- Figure 56: Asia Pacific USA Microgreens Industry Revenue (Million), by Import Market Analysis (Value & Volume) 2024 & 2032
- Figure 57: Asia Pacific USA Microgreens Industry Revenue Share (%), by Import Market Analysis (Value & Volume) 2024 & 2032
- Figure 58: Asia Pacific USA Microgreens Industry Revenue (Million), by Export Market Analysis (Value & Volume) 2024 & 2032
- Figure 59: Asia Pacific USA Microgreens Industry Revenue Share (%), by Export Market Analysis (Value & Volume) 2024 & 2032
- Figure 60: Asia Pacific USA Microgreens Industry Revenue (Million), by Price Trend Analysis 2024 & 2032
- Figure 61: Asia Pacific USA Microgreens Industry Revenue Share (%), by Price Trend Analysis 2024 & 2032
- Figure 62: Asia Pacific USA Microgreens Industry Revenue (Million), by Country 2024 & 2032
- Figure 63: Asia Pacific USA Microgreens Industry Revenue Share (%), by Country 2024 & 2032
List of Tables
- Table 1: Global USA Microgreens Industry Revenue Million Forecast, by Region 2019 & 2032
- Table 2: Global USA Microgreens Industry Revenue Million Forecast, by Production Analysis 2019 & 2032
- Table 3: Global USA Microgreens Industry Revenue Million Forecast, by Consumption Analysis 2019 & 2032
- Table 4: Global USA Microgreens Industry Revenue Million Forecast, by Import Market Analysis (Value & Volume) 2019 & 2032
- Table 5: Global USA Microgreens Industry Revenue Million Forecast, by Export Market Analysis (Value & Volume) 2019 & 2032
- Table 6: Global USA Microgreens Industry Revenue Million Forecast, by Price Trend Analysis 2019 & 2032
- Table 7: Global USA Microgreens Industry Revenue Million Forecast, by Region 2019 & 2032
- Table 8: Global USA Microgreens Industry Revenue Million Forecast, by Country 2019 & 2032
- Table 9: Northeast USA Microgreens Industry Revenue (Million) Forecast, by Application 2019 & 2032
- Table 10: Southeast USA Microgreens Industry Revenue (Million) Forecast, by Application 2019 & 2032
- Table 11: Midwest USA Microgreens Industry Revenue (Million) Forecast, by Application 2019 & 2032
- Table 12: Southwest USA Microgreens Industry Revenue (Million) Forecast, by Application 2019 & 2032
- Table 13: West USA Microgreens Industry Revenue (Million) Forecast, by Application 2019 & 2032
- Table 14: Global USA Microgreens Industry Revenue Million Forecast, by Production Analysis 2019 & 2032
- Table 15: Global USA Microgreens Industry Revenue Million Forecast, by Consumption Analysis 2019 & 2032
- Table 16: Global USA Microgreens Industry Revenue Million Forecast, by Import Market Analysis (Value & Volume) 2019 & 2032
- Table 17: Global USA Microgreens Industry Revenue Million Forecast, by Export Market Analysis (Value & Volume) 2019 & 2032
- Table 18: Global USA Microgreens Industry Revenue Million Forecast, by Price Trend Analysis 2019 & 2032
- Table 19: Global USA Microgreens Industry Revenue Million Forecast, by Country 2019 & 2032
- Table 20: United States USA Microgreens Industry Revenue (Million) Forecast, by Application 2019 & 2032
- Table 21: Canada USA Microgreens Industry Revenue (Million) Forecast, by Application 2019 & 2032
- Table 22: Mexico USA Microgreens Industry Revenue (Million) Forecast, by Application 2019 & 2032
- Table 23: Global USA Microgreens Industry Revenue Million Forecast, by Production Analysis 2019 & 2032
- Table 24: Global USA Microgreens Industry Revenue Million Forecast, by Consumption Analysis 2019 & 2032
- Table 25: Global USA Microgreens Industry Revenue Million Forecast, by Import Market Analysis (Value & Volume) 2019 & 2032
- Table 26: Global USA Microgreens Industry Revenue Million Forecast, by Export Market Analysis (Value & Volume) 2019 & 2032
- Table 27: Global USA Microgreens Industry Revenue Million Forecast, by Price Trend Analysis 2019 & 2032
- Table 28: Global USA Microgreens Industry Revenue Million Forecast, by Country 2019 & 2032
- Table 29: Brazil USA Microgreens Industry Revenue (Million) Forecast, by Application 2019 & 2032
- Table 30: Argentina USA Microgreens Industry Revenue (Million) Forecast, by Application 2019 & 2032
- Table 31: Rest of South America USA Microgreens Industry Revenue (Million) Forecast, by Application 2019 & 2032
- Table 32: Global USA Microgreens Industry Revenue Million Forecast, by Production Analysis 2019 & 2032
- Table 33: Global USA Microgreens Industry Revenue Million Forecast, by Consumption Analysis 2019 & 2032
- Table 34: Global USA Microgreens Industry Revenue Million Forecast, by Import Market Analysis (Value & Volume) 2019 & 2032
- Table 35: Global USA Microgreens Industry Revenue Million Forecast, by Export Market Analysis (Value & Volume) 2019 & 2032
- Table 36: Global USA Microgreens Industry Revenue Million Forecast, by Price Trend Analysis 2019 & 2032
- Table 37: Global USA Microgreens Industry Revenue Million Forecast, by Country 2019 & 2032
- Table 38: United Kingdom USA Microgreens Industry Revenue (Million) Forecast, by Application 2019 & 2032
- Table 39: Germany USA Microgreens Industry Revenue (Million) Forecast, by Application 2019 & 2032
- Table 40: France USA Microgreens Industry Revenue (Million) Forecast, by Application 2019 & 2032
- Table 41: Italy USA Microgreens Industry Revenue (Million) Forecast, by Application 2019 & 2032
- Table 42: Spain USA Microgreens Industry Revenue (Million) Forecast, by Application 2019 & 2032
- Table 43: Russia USA Microgreens Industry Revenue (Million) Forecast, by Application 2019 & 2032
- Table 44: Benelux USA Microgreens Industry Revenue (Million) Forecast, by Application 2019 & 2032
- Table 45: Nordics USA Microgreens Industry Revenue (Million) Forecast, by Application 2019 & 2032
- Table 46: Rest of Europe USA Microgreens Industry Revenue (Million) Forecast, by Application 2019 & 2032
- Table 47: Global USA Microgreens Industry Revenue Million Forecast, by Production Analysis 2019 & 2032
- Table 48: Global USA Microgreens Industry Revenue Million Forecast, by Consumption Analysis 2019 & 2032
- Table 49: Global USA Microgreens Industry Revenue Million Forecast, by Import Market Analysis (Value & Volume) 2019 & 2032
- Table 50: Global USA Microgreens Industry Revenue Million Forecast, by Export Market Analysis (Value & Volume) 2019 & 2032
- Table 51: Global USA Microgreens Industry Revenue Million Forecast, by Price Trend Analysis 2019 & 2032
- Table 52: Global USA Microgreens Industry Revenue Million Forecast, by Country 2019 & 2032
- Table 53: Turkey USA Microgreens Industry Revenue (Million) Forecast, by Application 2019 & 2032
- Table 54: Israel USA Microgreens Industry Revenue (Million) Forecast, by Application 2019 & 2032
- Table 55: GCC USA Microgreens Industry Revenue (Million) Forecast, by Application 2019 & 2032
- Table 56: North Africa USA Microgreens Industry Revenue (Million) Forecast, by Application 2019 & 2032
- Table 57: South Africa USA Microgreens Industry Revenue (Million) Forecast, by Application 2019 & 2032
- Table 58: Rest of Middle East & Africa USA Microgreens Industry Revenue (Million) Forecast, by Application 2019 & 2032
- Table 59: Global USA Microgreens Industry Revenue Million Forecast, by Production Analysis 2019 & 2032
- Table 60: Global USA Microgreens Industry Revenue Million Forecast, by Consumption Analysis 2019 & 2032
- Table 61: Global USA Microgreens Industry Revenue Million Forecast, by Import Market Analysis (Value & Volume) 2019 & 2032
- Table 62: Global USA Microgreens Industry Revenue Million Forecast, by Export Market Analysis (Value & Volume) 2019 & 2032
- Table 63: Global USA Microgreens Industry Revenue Million Forecast, by Price Trend Analysis 2019 & 2032
- Table 64: Global USA Microgreens Industry Revenue Million Forecast, by Country 2019 & 2032
- Table 65: China USA Microgreens Industry Revenue (Million) Forecast, by Application 2019 & 2032
- Table 66: India USA Microgreens Industry Revenue (Million) Forecast, by Application 2019 & 2032
- Table 67: Japan USA Microgreens Industry Revenue (Million) Forecast, by Application 2019 & 2032
- Table 68: South Korea USA Microgreens Industry Revenue (Million) Forecast, by Application 2019 & 2032
- Table 69: ASEAN USA Microgreens Industry Revenue (Million) Forecast, by Application 2019 & 2032
- Table 70: Oceania USA Microgreens Industry Revenue (Million) Forecast, by Application 2019 & 2032
- Table 71: Rest of Asia Pacific USA Microgreens Industry Revenue (Million) Forecast, by Application 2019 & 2032
Frequently Asked Questions
1. What is the projected Compound Annual Growth Rate (CAGR) of the USA Microgreens Industry?
The projected CAGR is approximately 10.60%.
2. Which companies are prominent players in the USA Microgreens Industry?
Key companies in the market include The Chef's Garden Inc, Quantum Microgreens, Metro Microgreens, Long Island Microgreens LL, Emerald Gardens, Fresh Origins, Florida Microgreens, Farmbox Greens LLC, Arizona Microgreens LLC, AeroFarms LLC.
3. What are the main segments of the USA Microgreens Industry?
The market segments include Production Analysis, Consumption Analysis, Import Market Analysis (Value & Volume), Export Market Analysis (Value & Volume), Price Trend Analysis.
4. Can you provide details about the market size?
The market size is estimated to be USD 1.74 Million as of 2022.
5. What are some drivers contributing to market growth?
Need for Custom Product Development; Use of CROs for Regulatory Services.
6. What are the notable trends driving market growth?
Increased Investments in Vertical Farming Domain.
7. Are there any restraints impacting market growth?
Data and Cyber Security Concerns; Lack of Experts and Professionals in this Industry.
8. Can you provide examples of recent developments in the market?
September 2022: To meet increased customer demand, AeroFarmsDanville VA established the world's largest Aeroponic Smart Farm with the newest Indoor Vertical Farm capable of growing over 3 million lb of fresh leafy greens annually.
9. What pricing options are available for accessing the report?
Pricing options include single-user, multi-user, and enterprise licenses priced at USD 3800, USD 4500, and USD 5800 respectively.
10. Is the market size provided in terms of value or volume?
The market size is provided in terms of value, measured in Million.
11. Are there any specific market keywords associated with the report?
Yes, the market keyword associated with the report is "USA Microgreens Industry," which aids in identifying and referencing the specific market segment covered.
12. How do I determine which pricing option suits my needs best?
The pricing options vary based on user requirements and access needs. Individual users may opt for single-user licenses, while businesses requiring broader access may choose multi-user or enterprise licenses for cost-effective access to the report.
13. Are there any additional resources or data provided in the USA Microgreens Industry report?
While the report offers comprehensive insights, it's advisable to review the specific contents or supplementary materials provided to ascertain if additional resources or data are available.
14. How can I stay updated on further developments or reports in the USA Microgreens Industry?
To stay informed about further developments, trends, and reports in the USA Microgreens Industry, consider subscribing to industry newsletters, following relevant companies and organizations, or regularly checking reputable industry news sources and publications.
Methodology
Step 1 - Identification of Relevant Samples Size from Population Database


Step 2 - Approaches for Defining Global Market Size (Value, Volume* & Price*)

Note*: In applicable scenarios
Step 3 - Data Sources
Primary Research
- Web Analytics
- Survey Reports
- Research Institute
- Latest Research Reports
- Opinion Leaders
Secondary Research
- Annual Reports
- White Paper
- Latest Press Release
- Industry Association
- Paid Database
- Investor Presentations

Step 4 - Data Triangulation
Involves using different sources of information in order to increase the validity of a study
These sources are likely to be stakeholders in a program - participants, other researchers, program staff, other community members, and so on.
Then we put all data in single framework & apply various statistical tools to find out the dynamic on the market.
During the analysis stage, feedback from the stakeholder groups would be compared to determine areas of agreement as well as areas of divergence


