

Key Insights
The USA onshore drilling fluid market is poised for substantial expansion, driven by intensified oil and gas exploration and production, particularly within shale formations. A projected Compound Annual Growth Rate (CAGR) of 7.5% from 2024 to 2033 underscores significant market growth. Advancements in drilling technologies, including horizontal drilling and hydraulic fracturing, necessitate high-performance drilling fluids. A growing demand for sustainable and environmentally friendly fluid options is steering market innovation, encouraging R&D investment in biodegradable and less-toxic alternatives. While regulatory frameworks and oil price volatility may present challenges, the long-term outlook remains robust due to the ongoing need for efficient drilling operations. The market is diverse, featuring global corporations and regional specialists competing through price, innovation, and specialized services. Segmentation likely encompasses water-based, oil-based, and synthetic-based fluids, tailored to specific geological conditions and drilling requirements. With a current market size of $2.7 billion in 2024, substantial growth is anticipated throughout the forecast period. Key growth areas will focus on environmentally responsible and technologically advanced solutions.
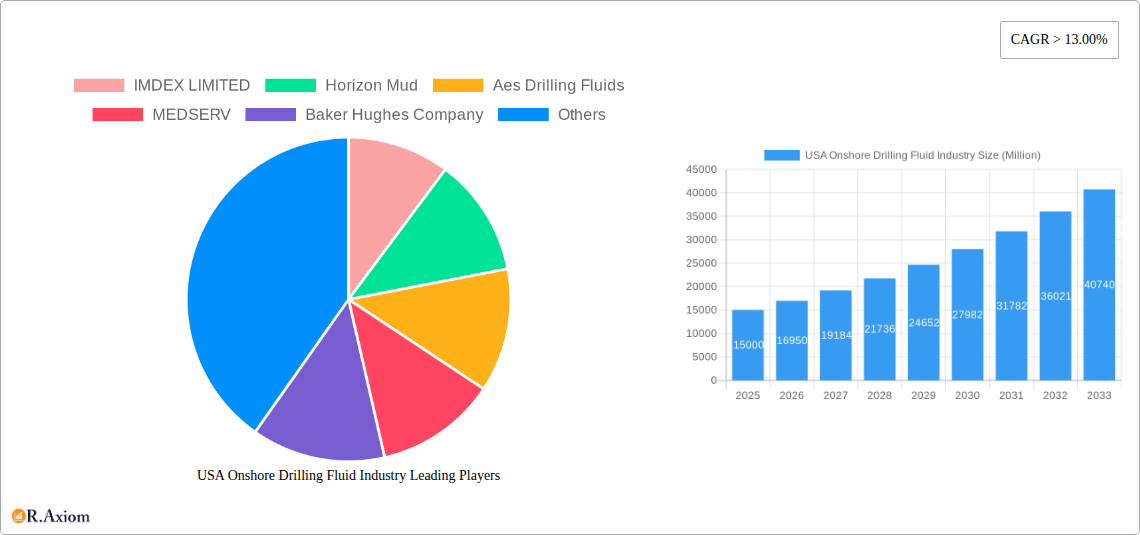
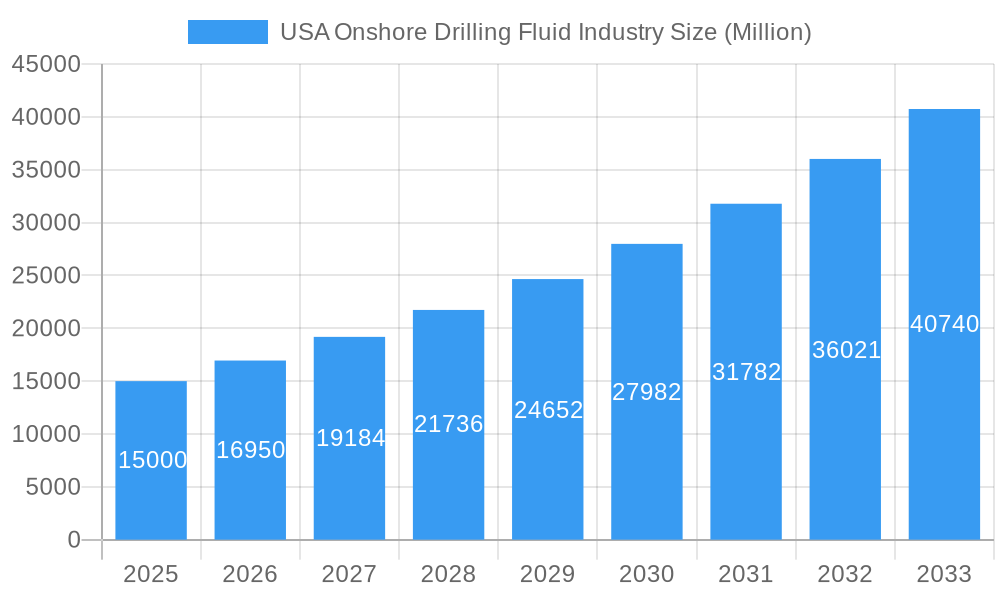
USA Onshore Drilling Fluid Industry Market Size (In Billion)
The competitive environment is marked by intense rivalry and strategic alliances. Leading companies are pursuing mergers, acquisitions, and partnerships to broaden their product offerings and market presence. Smaller firms are concentrating on specialized segments and niche solutions for differentiation. Future innovation will be spurred by the demand for enhanced drilling efficiency and minimized environmental impact, leading to the development of advanced drilling fluid technologies and a stronger emphasis on sustainability. Regional variations in regulations and geology will also shape market dynamics, creating localized growth trends within the USA onshore drilling fluid sector.
USA Onshore Drilling Fluid Industry Company Market Share
USA Onshore Drilling Fluid Industry: A Comprehensive Market Report (2019-2033)
This comprehensive report provides an in-depth analysis of the USA onshore drilling fluid industry, offering valuable insights for industry stakeholders, investors, and strategic decision-makers. The report covers the period from 2019 to 2033, with 2025 serving as the base and estimated year. The forecast period extends from 2025 to 2033, while historical data encompasses 2019-2024. The market analysis incorporates key segments and leading players, providing a granular understanding of market dynamics and future growth potential.
USA Onshore Drilling Fluid Industry Market Concentration & Innovation
This section analyzes the competitive landscape of the USA onshore drilling fluid market, examining market concentration, innovation drivers, regulatory influences, product substitutes, end-user trends, and mergers & acquisitions (M&A) activities. The market is moderately concentrated, with the top five players holding approximately xx% of the market share in 2025. Innovation is driven by the need for environmentally friendly fluids, improved performance characteristics, and cost reduction. Key regulatory frameworks, such as EPA regulations on wastewater disposal, significantly impact industry operations. The emergence of synthetic-based fluids presents a notable substitution threat. End-user demand is heavily influenced by shale gas and oil production levels. M&A activity has been relatively moderate in recent years, with a total deal value of approximately $xx Million in the 2019-2024 period. Major deals included the acquisition of [Company A] by [Company B] for $xx Million in 2022.
- Market Concentration: Top 5 players hold xx% market share (2025).
- Innovation Drivers: Environmental concerns, performance enhancement, cost reduction.
- Regulatory Framework: EPA regulations on wastewater disposal.
- Product Substitutes: Synthetic-based fluids.
- End-User Trends: Driven by shale gas and oil production.
- M&A Activity: Total deal value of approximately $xx Million (2019-2024).
USA Onshore Drilling Fluid Industry Industry Trends & Insights
The USA onshore drilling fluid market exhibits a complex interplay of growth drivers, technological advancements, and evolving consumer preferences. The market experienced a CAGR of xx% during the historical period (2019-2024), primarily driven by increased onshore drilling activities, particularly in shale basins. Technological advancements, such as the development of high-performance drilling fluids tailored to specific geological formations, have enhanced drilling efficiency. However, fluctuating oil and gas prices pose a significant challenge. The market penetration of environmentally friendly drilling fluids is gradually increasing, driven by stricter environmental regulations and growing sustainability concerns. The competitive dynamics are characterized by intense rivalry among established players and the emergence of niche players offering specialized solutions. The market is expected to witness a CAGR of xx% during the forecast period (2025-2033).
Dominant Markets & Segments in USA Onshore Drilling Fluid Industry
The Permian Basin remains the dominant market for onshore drilling fluids in the USA, driven by robust oil and gas production. The region's favorable geological conditions, extensive infrastructure, and supportive regulatory environment contribute to its market leadership.
- Key Drivers (Permian Basin):
- High oil and gas production.
- Favorable geological conditions.
- Extensive infrastructure.
- Supportive regulatory environment.
Other significant markets include the Eagle Ford Shale and Bakken Shale formations. Market segmentation by fluid type (water-based, oil-based, synthetic-based) reveals a growing preference for environmentally friendly water-based and synthetic-based fluids. The oil-based segment holds a xx% market share in 2025 but is anticipated to decrease slightly due to environmental concerns. The water-based segment is projected to grow at a xx% CAGR in the forecast period, driven by stricter environmental regulations.
USA Onshore Drilling Fluid Industry Product Developments
Recent product developments focus on enhanced performance, environmental sustainability, and cost-effectiveness. Innovations include nanotechnology-enhanced fluids, which improve drilling efficiency and reduce fluid loss. Biodegradable and recyclable fluids are gaining traction due to increasing environmental concerns. These developments offer competitive advantages by improving operational efficiency, lowering environmental impact, and reducing overall costs.
Report Scope & Segmentation Analysis
The report segments the USA onshore drilling fluid market by fluid type (water-based, oil-based, synthetic-based), application (conventional drilling, horizontal drilling, directional drilling), and region (Permian Basin, Eagle Ford Shale, Bakken Shale, others). Each segment is analyzed based on its market size, growth projections, and competitive dynamics. Water-based fluids are projected to dominate the market by volume due to increasing environmental regulations. Oil-based fluids have a higher market value despite the environmental concerns. Synthetic-based fluids are gaining traction as a sustainable option.
Key Drivers of USA Onshore Drilling Fluid Industry Growth
Several key factors drive the growth of the USA onshore drilling fluid industry. Increased onshore drilling activities fueled by shale gas and oil production are a major catalyst. Technological advancements, such as improved drilling techniques and fluid formulations, enhance efficiency and reduce costs. Favorable government policies supporting domestic energy production also contribute to growth. Finally, increasing demand for environmentally friendly drilling fluids presents a significant opportunity for innovation and market expansion.
Challenges in the USA Onshore Drilling Fluid Industry Sector
The industry faces several challenges, including fluctuating oil and gas prices, which directly impact demand. Stricter environmental regulations and concerns about wastewater disposal add to operational costs and complexities. Intense competition among established players and the emergence of new entrants put pressure on profit margins. Supply chain disruptions also pose a significant risk to the industry's stability. These factors combined can result in a xx% reduction in profit margins in unfavorable market conditions.
Emerging Opportunities in USA Onshore Drilling Fluid Industry
Emerging opportunities include the development and adoption of advanced drilling fluids with enhanced performance characteristics, improved environmental sustainability, and reduced operational costs. Growing demand for fluids suitable for unconventional reservoirs, such as shale formations, presents significant growth potential. Furthermore, innovative solutions for efficient wastewater management and disposal offer lucrative market opportunities.
Leading Players in the USA Onshore Drilling Fluid Industry Market
- IMDEX LIMITED
- Horizon Mud
- Aes Drilling Fluids
- MEDSERV
- Baker Hughes Company
- Schlumberger Limited
- Newpark Resources Inc
- Weatherford
- National Oilwell Varco
- Francis Drilling Fluids Ltd
- Oleon Americas Inc (Avril Group)
- Q'max Solutions Inc
- Unique Drilling Fluids Inc
- Sunwest Fluids LLC
- McAda Drilling Fluids
- Geo Drilling Fluids Inc
- CES Energy Solutions Corp
- List Not Exhaustive
Key Developments in USA Onshore Drilling Fluid Industry Industry
- Jan 2023: Baker Hughes launched a new generation of environmentally friendly drilling fluids.
- May 2022: Schlumberger acquired a smaller drilling fluids company for $xx Million.
- Oct 2021: New regulations regarding wastewater disposal were implemented.
- More developments to be added…
Strategic Outlook for USA Onshore Drilling Fluid Industry Market
The USA onshore drilling fluid market is poised for continued growth, driven by factors such as increasing onshore drilling activities, technological advancements, and the growing adoption of environmentally friendly fluids. While challenges persist, the industry's ability to innovate and adapt to evolving market conditions will determine its long-term success. The market's potential is significant, with projected market value exceeding $xx Million by 2033. Strategic investments in research and development, coupled with a focus on sustainability, will be critical for players seeking to secure a competitive advantage.
USA Onshore Drilling Fluid Industry Segmentation
-
1. Additive Type
- 1.1. Protective Chemicals
- 1.2. Fluid Viscosifiers
- 1.3. Weighting Agents
- 1.4. Wetting Agents
- 1.5. Lost Circulation Materials
- 1.6. Thinners
- 1.7. Rheology Modifiers
- 1.8. Surfactants
- 1.9. Alkalinity and pH Control Materials
- 1.10. Shale Stabilizers
- 1.11. Other Additive Types
-
2. Product Type
- 2.1. Oil-based Drilling Fluid
- 2.2. Synthetic-based Drilling Fluid
- 2.3. Water-based Drilling Fluid
-
3. Basin
- 3.1. Permian
- 3.2. Eagle Ford
- 3.3. Niobrara
- 3.4. Bakken
- 3.5. Appalachia
- 3.6. Other Basins
USA Onshore Drilling Fluid Industry Segmentation By Geography
-
1. North America
- 1.1. United States
- 1.2. Canada
- 1.3. Mexico
-
2. South America
- 2.1. Brazil
- 2.2. Argentina
- 2.3. Rest of South America
-
3. Europe
- 3.1. United Kingdom
- 3.2. Germany
- 3.3. France
- 3.4. Italy
- 3.5. Spain
- 3.6. Russia
- 3.7. Benelux
- 3.8. Nordics
- 3.9. Rest of Europe
-
4. Middle East & Africa
- 4.1. Turkey
- 4.2. Israel
- 4.3. GCC
- 4.4. North Africa
- 4.5. South Africa
- 4.6. Rest of Middle East & Africa
-
5. Asia Pacific
- 5.1. China
- 5.2. India
- 5.3. Japan
- 5.4. South Korea
- 5.5. ASEAN
- 5.6. Oceania
- 5.7. Rest of Asia Pacific
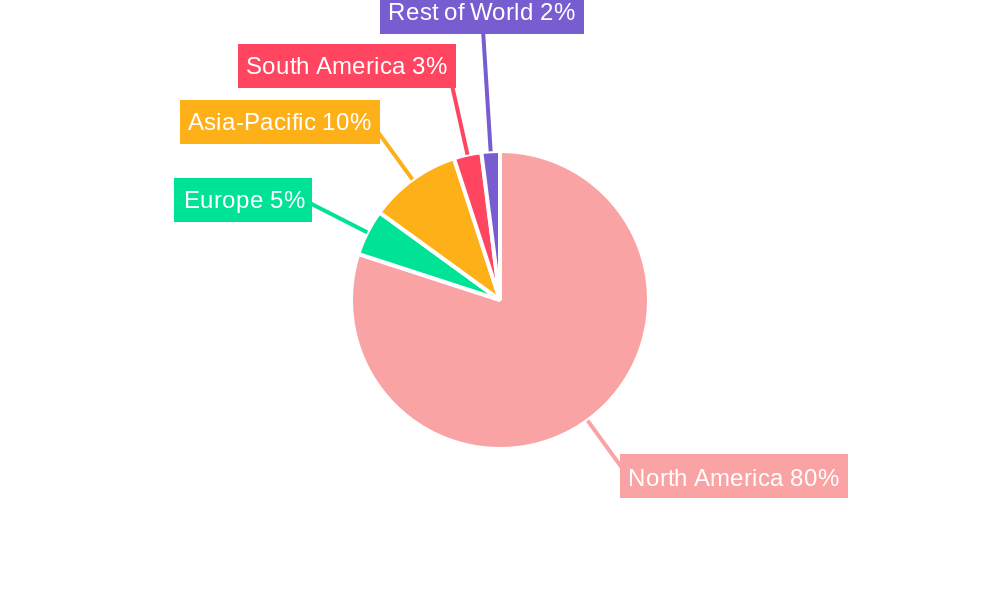
USA Onshore Drilling Fluid Industry Regional Market Share
Geographic Coverage of USA Onshore Drilling Fluid Industry
USA Onshore Drilling Fluid Industry REPORT HIGHLIGHTS
| Aspects | Details |
|---|---|
| Study Period | 2020-2034 |
| Base Year | 2025 |
| Estimated Year | 2026 |
| Forecast Period | 2026-2034 |
| Historical Period | 2020-2025 |
| Growth Rate | CAGR of 7.5% from 2020-2034 |
| Segmentation |
|
Table of Contents
- 1. Introduction
- 1.1. Research Scope
- 1.2. Market Segmentation
- 1.3. Research Objective
- 1.4. Definitions and Assumptions
- 2. Executive Summary
- 2.1. Market Snapshot
- 3. Market Dynamics
- 3.1. Market Drivers
- 3.2. Market Restrains
- 3.3. Market Trends
- 3.4. Market Opportunities
- 4. Market Factor Analysis
- 4.1. Porters Five Forces
- 4.1.1. Bargaining Power of Suppliers
- 4.1.2. Bargaining Power of Buyers
- 4.1.3. Threat of New Entrants
- 4.1.4. Threat of Substitutes
- 4.1.5. Competitive Rivalry
- 4.2. PESTEL analysis
- 4.3. BCG Analysis
- 4.3.1. Stars (High Growth, High Market Share)
- 4.3.2. Cash Cows (Low Growth, High Market Share)
- 4.3.3. Question Mark (High Growth, Low Market Share)
- 4.3.4. Dogs (Low Growth, Low Market Share)
- 4.4. Ansoff Matrix Analysis
- 4.5. Supply Chain Analysis
- 4.6. Regulatory Landscape
- 4.7. Current Market Potential and Opportunity Assessment (TAM–SAM–SOM Framework)
- 4.8. RAX Analyst Note
- 4.1. Porters Five Forces
- 5. Market Analysis, Insights and Forecast 2021-2033
- 5.1. Market Analysis, Insights and Forecast - by Additive Type
- 5.1.1. Protective Chemicals
- 5.1.2. Fluid Viscosifiers
- 5.1.3. Weighting Agents
- 5.1.4. Wetting Agents
- 5.1.5. Lost Circulation Materials
- 5.1.6. Thinners
- 5.1.7. Rheology Modifiers
- 5.1.8. Surfactants
- 5.1.9. Alkalinity and pH Control Materials
- 5.1.10. Shale Stabilizers
- 5.1.11. Other Additive Types
- 5.2. Market Analysis, Insights and Forecast - by Product Type
- 5.2.1. Oil-based Drilling Fluid
- 5.2.2. Synthetic-based Drilling Fluid
- 5.2.3. Water-based Drilling Fluid
- 5.3. Market Analysis, Insights and Forecast - by Basin
- 5.3.1. Permian
- 5.3.2. Eagle Ford
- 5.3.3. Niobrara
- 5.3.4. Bakken
- 5.3.5. Appalachia
- 5.3.6. Other Basins
- 5.4. Market Analysis, Insights and Forecast - by Region
- 5.4.1. North America
- 5.4.2. South America
- 5.4.3. Europe
- 5.4.4. Middle East & Africa
- 5.4.5. Asia Pacific
- 5.1. Market Analysis, Insights and Forecast - by Additive Type
- 6. Global USA Onshore Drilling Fluid Industry Analysis, Insights and Forecast, 2021-2033
- 6.1. Market Analysis, Insights and Forecast - by Additive Type
- 6.1.1. Protective Chemicals
- 6.1.2. Fluid Viscosifiers
- 6.1.3. Weighting Agents
- 6.1.4. Wetting Agents
- 6.1.5. Lost Circulation Materials
- 6.1.6. Thinners
- 6.1.7. Rheology Modifiers
- 6.1.8. Surfactants
- 6.1.9. Alkalinity and pH Control Materials
- 6.1.10. Shale Stabilizers
- 6.1.11. Other Additive Types
- 6.2. Market Analysis, Insights and Forecast - by Product Type
- 6.2.1. Oil-based Drilling Fluid
- 6.2.2. Synthetic-based Drilling Fluid
- 6.2.3. Water-based Drilling Fluid
- 6.3. Market Analysis, Insights and Forecast - by Basin
- 6.3.1. Permian
- 6.3.2. Eagle Ford
- 6.3.3. Niobrara
- 6.3.4. Bakken
- 6.3.5. Appalachia
- 6.3.6. Other Basins
- 6.1. Market Analysis, Insights and Forecast - by Additive Type
- 7. North America USA Onshore Drilling Fluid Industry Analysis, Insights and Forecast, 2020-2032
- 7.1. Market Analysis, Insights and Forecast - by Additive Type
- 7.1.1. Protective Chemicals
- 7.1.2. Fluid Viscosifiers
- 7.1.3. Weighting Agents
- 7.1.4. Wetting Agents
- 7.1.5. Lost Circulation Materials
- 7.1.6. Thinners
- 7.1.7. Rheology Modifiers
- 7.1.8. Surfactants
- 7.1.9. Alkalinity and pH Control Materials
- 7.1.10. Shale Stabilizers
- 7.1.11. Other Additive Types
- 7.2. Market Analysis, Insights and Forecast - by Product Type
- 7.2.1. Oil-based Drilling Fluid
- 7.2.2. Synthetic-based Drilling Fluid
- 7.2.3. Water-based Drilling Fluid
- 7.3. Market Analysis, Insights and Forecast - by Basin
- 7.3.1. Permian
- 7.3.2. Eagle Ford
- 7.3.3. Niobrara
- 7.3.4. Bakken
- 7.3.5. Appalachia
- 7.3.6. Other Basins
- 7.1. Market Analysis, Insights and Forecast - by Additive Type
- 8. South America USA Onshore Drilling Fluid Industry Analysis, Insights and Forecast, 2020-2032
- 8.1. Market Analysis, Insights and Forecast - by Additive Type
- 8.1.1. Protective Chemicals
- 8.1.2. Fluid Viscosifiers
- 8.1.3. Weighting Agents
- 8.1.4. Wetting Agents
- 8.1.5. Lost Circulation Materials
- 8.1.6. Thinners
- 8.1.7. Rheology Modifiers
- 8.1.8. Surfactants
- 8.1.9. Alkalinity and pH Control Materials
- 8.1.10. Shale Stabilizers
- 8.1.11. Other Additive Types
- 8.2. Market Analysis, Insights and Forecast - by Product Type
- 8.2.1. Oil-based Drilling Fluid
- 8.2.2. Synthetic-based Drilling Fluid
- 8.2.3. Water-based Drilling Fluid
- 8.3. Market Analysis, Insights and Forecast - by Basin
- 8.3.1. Permian
- 8.3.2. Eagle Ford
- 8.3.3. Niobrara
- 8.3.4. Bakken
- 8.3.5. Appalachia
- 8.3.6. Other Basins
- 8.1. Market Analysis, Insights and Forecast - by Additive Type
- 9. Europe USA Onshore Drilling Fluid Industry Analysis, Insights and Forecast, 2020-2032
- 9.1. Market Analysis, Insights and Forecast - by Additive Type
- 9.1.1. Protective Chemicals
- 9.1.2. Fluid Viscosifiers
- 9.1.3. Weighting Agents
- 9.1.4. Wetting Agents
- 9.1.5. Lost Circulation Materials
- 9.1.6. Thinners
- 9.1.7. Rheology Modifiers
- 9.1.8. Surfactants
- 9.1.9. Alkalinity and pH Control Materials
- 9.1.10. Shale Stabilizers
- 9.1.11. Other Additive Types
- 9.2. Market Analysis, Insights and Forecast - by Product Type
- 9.2.1. Oil-based Drilling Fluid
- 9.2.2. Synthetic-based Drilling Fluid
- 9.2.3. Water-based Drilling Fluid
- 9.3. Market Analysis, Insights and Forecast - by Basin
- 9.3.1. Permian
- 9.3.2. Eagle Ford
- 9.3.3. Niobrara
- 9.3.4. Bakken
- 9.3.5. Appalachia
- 9.3.6. Other Basins
- 9.1. Market Analysis, Insights and Forecast - by Additive Type
- 10. Middle East & Africa USA Onshore Drilling Fluid Industry Analysis, Insights and Forecast, 2020-2032
- 10.1. Market Analysis, Insights and Forecast - by Additive Type
- 10.1.1. Protective Chemicals
- 10.1.2. Fluid Viscosifiers
- 10.1.3. Weighting Agents
- 10.1.4. Wetting Agents
- 10.1.5. Lost Circulation Materials
- 10.1.6. Thinners
- 10.1.7. Rheology Modifiers
- 10.1.8. Surfactants
- 10.1.9. Alkalinity and pH Control Materials
- 10.1.10. Shale Stabilizers
- 10.1.11. Other Additive Types
- 10.2. Market Analysis, Insights and Forecast - by Product Type
- 10.2.1. Oil-based Drilling Fluid
- 10.2.2. Synthetic-based Drilling Fluid
- 10.2.3. Water-based Drilling Fluid
- 10.3. Market Analysis, Insights and Forecast - by Basin
- 10.3.1. Permian
- 10.3.2. Eagle Ford
- 10.3.3. Niobrara
- 10.3.4. Bakken
- 10.3.5. Appalachia
- 10.3.6. Other Basins
- 10.1. Market Analysis, Insights and Forecast - by Additive Type
- 11. Asia Pacific USA Onshore Drilling Fluid Industry Analysis, Insights and Forecast, 2020-2032
- 11.1. Market Analysis, Insights and Forecast - by Additive Type
- 11.1.1. Protective Chemicals
- 11.1.2. Fluid Viscosifiers
- 11.1.3. Weighting Agents
- 11.1.4. Wetting Agents
- 11.1.5. Lost Circulation Materials
- 11.1.6. Thinners
- 11.1.7. Rheology Modifiers
- 11.1.8. Surfactants
- 11.1.9. Alkalinity and pH Control Materials
- 11.1.10. Shale Stabilizers
- 11.1.11. Other Additive Types
- 11.2. Market Analysis, Insights and Forecast - by Product Type
- 11.2.1. Oil-based Drilling Fluid
- 11.2.2. Synthetic-based Drilling Fluid
- 11.2.3. Water-based Drilling Fluid
- 11.3. Market Analysis, Insights and Forecast - by Basin
- 11.3.1. Permian
- 11.3.2. Eagle Ford
- 11.3.3. Niobrara
- 11.3.4. Bakken
- 11.3.5. Appalachia
- 11.3.6. Other Basins
- 11.1. Market Analysis, Insights and Forecast - by Additive Type
- 12. Competitive Analysis
- 12.1. Company Profiles
- 12.1.1 IMDEX LIMITED
- 12.1.1.1. Company Overview
- 12.1.1.2. Products
- 12.1.1.3. Company Financials
- 12.1.1.4. SWOT Analysis
- 12.1.2 Horizon Mud
- 12.1.2.1. Company Overview
- 12.1.2.2. Products
- 12.1.2.3. Company Financials
- 12.1.2.4. SWOT Analysis
- 12.1.3 Aes Drilling Fluids
- 12.1.3.1. Company Overview
- 12.1.3.2. Products
- 12.1.3.3. Company Financials
- 12.1.3.4. SWOT Analysis
- 12.1.4 MEDSERV
- 12.1.4.1. Company Overview
- 12.1.4.2. Products
- 12.1.4.3. Company Financials
- 12.1.4.4. SWOT Analysis
- 12.1.5 Baker Hughes Company
- 12.1.5.1. Company Overview
- 12.1.5.2. Products
- 12.1.5.3. Company Financials
- 12.1.5.4. SWOT Analysis
- 12.1.6 Schlumberger Limited
- 12.1.6.1. Company Overview
- 12.1.6.2. Products
- 12.1.6.3. Company Financials
- 12.1.6.4. SWOT Analysis
- 12.1.7 Newpark Resources Inc
- 12.1.7.1. Company Overview
- 12.1.7.2. Products
- 12.1.7.3. Company Financials
- 12.1.7.4. SWOT Analysis
- 12.1.8 Weatherford
- 12.1.8.1. Company Overview
- 12.1.8.2. Products
- 12.1.8.3. Company Financials
- 12.1.8.4. SWOT Analysis
- 12.1.9 National Oilwell Varco
- 12.1.9.1. Company Overview
- 12.1.9.2. Products
- 12.1.9.3. Company Financials
- 12.1.9.4. SWOT Analysis
- 12.1.10 Francis Drilling Fluids Ltd
- 12.1.10.1. Company Overview
- 12.1.10.2. Products
- 12.1.10.3. Company Financials
- 12.1.10.4. SWOT Analysis
- 12.1.11 Oleon Americas Inc (Avril Group)
- 12.1.11.1. Company Overview
- 12.1.11.2. Products
- 12.1.11.3. Company Financials
- 12.1.11.4. SWOT Analysis
- 12.1.12 Q'max Solutions Inc
- 12.1.12.1. Company Overview
- 12.1.12.2. Products
- 12.1.12.3. Company Financials
- 12.1.12.4. SWOT Analysis
- 12.1.13 Unique Drilling Fluids Inc
- 12.1.13.1. Company Overview
- 12.1.13.2. Products
- 12.1.13.3. Company Financials
- 12.1.13.4. SWOT Analysis
- 12.1.14 Sunwest Fluids LLC
- 12.1.14.1. Company Overview
- 12.1.14.2. Products
- 12.1.14.3. Company Financials
- 12.1.14.4. SWOT Analysis
- 12.1.15 McAda Drilling Fluids
- 12.1.15.1. Company Overview
- 12.1.15.2. Products
- 12.1.15.3. Company Financials
- 12.1.15.4. SWOT Analysis
- 12.1.16 Geo Drilling Fluids Inc
- 12.1.16.1. Company Overview
- 12.1.16.2. Products
- 12.1.16.3. Company Financials
- 12.1.16.4. SWOT Analysis
- 12.1.17 CES Energy Solutions Corp *List Not Exhaustive
- 12.1.17.1. Company Overview
- 12.1.17.2. Products
- 12.1.17.3. Company Financials
- 12.1.17.4. SWOT Analysis
- 12.1.1 IMDEX LIMITED
- 12.2. Market Entropy
- 12.2.1 Company's Key Areas Served
- 12.2.2 Recent Developments
- 12.3. Company Market Share Analysis 2025
- 12.3.1 Top 5 Companies Market Share Analysis
- 12.3.2 Top 3 Companies Market Share Analysis
- 12.4. List of Potential Customers
- 13. Research Methodology
List of Figures
- Figure 1: Global USA Onshore Drilling Fluid Industry Revenue Breakdown (billion, %) by Region 2025 & 2033
- Figure 2: North America USA Onshore Drilling Fluid Industry Revenue (billion), by Additive Type 2025 & 2033
- Figure 3: North America USA Onshore Drilling Fluid Industry Revenue Share (%), by Additive Type 2025 & 2033
- Figure 4: North America USA Onshore Drilling Fluid Industry Revenue (billion), by Product Type 2025 & 2033
- Figure 5: North America USA Onshore Drilling Fluid Industry Revenue Share (%), by Product Type 2025 & 2033
- Figure 6: North America USA Onshore Drilling Fluid Industry Revenue (billion), by Basin 2025 & 2033
- Figure 7: North America USA Onshore Drilling Fluid Industry Revenue Share (%), by Basin 2025 & 2033
- Figure 8: North America USA Onshore Drilling Fluid Industry Revenue (billion), by Country 2025 & 2033
- Figure 9: North America USA Onshore Drilling Fluid Industry Revenue Share (%), by Country 2025 & 2033
- Figure 10: South America USA Onshore Drilling Fluid Industry Revenue (billion), by Additive Type 2025 & 2033
- Figure 11: South America USA Onshore Drilling Fluid Industry Revenue Share (%), by Additive Type 2025 & 2033
- Figure 12: South America USA Onshore Drilling Fluid Industry Revenue (billion), by Product Type 2025 & 2033
- Figure 13: South America USA Onshore Drilling Fluid Industry Revenue Share (%), by Product Type 2025 & 2033
- Figure 14: South America USA Onshore Drilling Fluid Industry Revenue (billion), by Basin 2025 & 2033
- Figure 15: South America USA Onshore Drilling Fluid Industry Revenue Share (%), by Basin 2025 & 2033
- Figure 16: South America USA Onshore Drilling Fluid Industry Revenue (billion), by Country 2025 & 2033
- Figure 17: South America USA Onshore Drilling Fluid Industry Revenue Share (%), by Country 2025 & 2033
- Figure 18: Europe USA Onshore Drilling Fluid Industry Revenue (billion), by Additive Type 2025 & 2033
- Figure 19: Europe USA Onshore Drilling Fluid Industry Revenue Share (%), by Additive Type 2025 & 2033
- Figure 20: Europe USA Onshore Drilling Fluid Industry Revenue (billion), by Product Type 2025 & 2033
- Figure 21: Europe USA Onshore Drilling Fluid Industry Revenue Share (%), by Product Type 2025 & 2033
- Figure 22: Europe USA Onshore Drilling Fluid Industry Revenue (billion), by Basin 2025 & 2033
- Figure 23: Europe USA Onshore Drilling Fluid Industry Revenue Share (%), by Basin 2025 & 2033
- Figure 24: Europe USA Onshore Drilling Fluid Industry Revenue (billion), by Country 2025 & 2033
- Figure 25: Europe USA Onshore Drilling Fluid Industry Revenue Share (%), by Country 2025 & 2033
- Figure 26: Middle East & Africa USA Onshore Drilling Fluid Industry Revenue (billion), by Additive Type 2025 & 2033
- Figure 27: Middle East & Africa USA Onshore Drilling Fluid Industry Revenue Share (%), by Additive Type 2025 & 2033
- Figure 28: Middle East & Africa USA Onshore Drilling Fluid Industry Revenue (billion), by Product Type 2025 & 2033
- Figure 29: Middle East & Africa USA Onshore Drilling Fluid Industry Revenue Share (%), by Product Type 2025 & 2033
- Figure 30: Middle East & Africa USA Onshore Drilling Fluid Industry Revenue (billion), by Basin 2025 & 2033
- Figure 31: Middle East & Africa USA Onshore Drilling Fluid Industry Revenue Share (%), by Basin 2025 & 2033
- Figure 32: Middle East & Africa USA Onshore Drilling Fluid Industry Revenue (billion), by Country 2025 & 2033
- Figure 33: Middle East & Africa USA Onshore Drilling Fluid Industry Revenue Share (%), by Country 2025 & 2033
- Figure 34: Asia Pacific USA Onshore Drilling Fluid Industry Revenue (billion), by Additive Type 2025 & 2033
- Figure 35: Asia Pacific USA Onshore Drilling Fluid Industry Revenue Share (%), by Additive Type 2025 & 2033
- Figure 36: Asia Pacific USA Onshore Drilling Fluid Industry Revenue (billion), by Product Type 2025 & 2033
- Figure 37: Asia Pacific USA Onshore Drilling Fluid Industry Revenue Share (%), by Product Type 2025 & 2033
- Figure 38: Asia Pacific USA Onshore Drilling Fluid Industry Revenue (billion), by Basin 2025 & 2033
- Figure 39: Asia Pacific USA Onshore Drilling Fluid Industry Revenue Share (%), by Basin 2025 & 2033
- Figure 40: Asia Pacific USA Onshore Drilling Fluid Industry Revenue (billion), by Country 2025 & 2033
- Figure 41: Asia Pacific USA Onshore Drilling Fluid Industry Revenue Share (%), by Country 2025 & 2033
List of Tables
- Table 1: Global USA Onshore Drilling Fluid Industry Revenue billion Forecast, by Additive Type 2020 & 2033
- Table 2: Global USA Onshore Drilling Fluid Industry Revenue billion Forecast, by Product Type 2020 & 2033
- Table 3: Global USA Onshore Drilling Fluid Industry Revenue billion Forecast, by Basin 2020 & 2033
- Table 4: Global USA Onshore Drilling Fluid Industry Revenue billion Forecast, by Region 2020 & 2033
- Table 5: Global USA Onshore Drilling Fluid Industry Revenue billion Forecast, by Additive Type 2020 & 2033
- Table 6: Global USA Onshore Drilling Fluid Industry Revenue billion Forecast, by Product Type 2020 & 2033
- Table 7: Global USA Onshore Drilling Fluid Industry Revenue billion Forecast, by Basin 2020 & 2033
- Table 8: Global USA Onshore Drilling Fluid Industry Revenue billion Forecast, by Country 2020 & 2033
- Table 9: United States USA Onshore Drilling Fluid Industry Revenue (billion) Forecast, by Application 2020 & 2033
- Table 10: Canada USA Onshore Drilling Fluid Industry Revenue (billion) Forecast, by Application 2020 & 2033
- Table 11: Mexico USA Onshore Drilling Fluid Industry Revenue (billion) Forecast, by Application 2020 & 2033
- Table 12: Global USA Onshore Drilling Fluid Industry Revenue billion Forecast, by Additive Type 2020 & 2033
- Table 13: Global USA Onshore Drilling Fluid Industry Revenue billion Forecast, by Product Type 2020 & 2033
- Table 14: Global USA Onshore Drilling Fluid Industry Revenue billion Forecast, by Basin 2020 & 2033
- Table 15: Global USA Onshore Drilling Fluid Industry Revenue billion Forecast, by Country 2020 & 2033
- Table 16: Brazil USA Onshore Drilling Fluid Industry Revenue (billion) Forecast, by Application 2020 & 2033
- Table 17: Argentina USA Onshore Drilling Fluid Industry Revenue (billion) Forecast, by Application 2020 & 2033
- Table 18: Rest of South America USA Onshore Drilling Fluid Industry Revenue (billion) Forecast, by Application 2020 & 2033
- Table 19: Global USA Onshore Drilling Fluid Industry Revenue billion Forecast, by Additive Type 2020 & 2033
- Table 20: Global USA Onshore Drilling Fluid Industry Revenue billion Forecast, by Product Type 2020 & 2033
- Table 21: Global USA Onshore Drilling Fluid Industry Revenue billion Forecast, by Basin 2020 & 2033
- Table 22: Global USA Onshore Drilling Fluid Industry Revenue billion Forecast, by Country 2020 & 2033
- Table 23: United Kingdom USA Onshore Drilling Fluid Industry Revenue (billion) Forecast, by Application 2020 & 2033
- Table 24: Germany USA Onshore Drilling Fluid Industry Revenue (billion) Forecast, by Application 2020 & 2033
- Table 25: France USA Onshore Drilling Fluid Industry Revenue (billion) Forecast, by Application 2020 & 2033
- Table 26: Italy USA Onshore Drilling Fluid Industry Revenue (billion) Forecast, by Application 2020 & 2033
- Table 27: Spain USA Onshore Drilling Fluid Industry Revenue (billion) Forecast, by Application 2020 & 2033
- Table 28: Russia USA Onshore Drilling Fluid Industry Revenue (billion) Forecast, by Application 2020 & 2033
- Table 29: Benelux USA Onshore Drilling Fluid Industry Revenue (billion) Forecast, by Application 2020 & 2033
- Table 30: Nordics USA Onshore Drilling Fluid Industry Revenue (billion) Forecast, by Application 2020 & 2033
- Table 31: Rest of Europe USA Onshore Drilling Fluid Industry Revenue (billion) Forecast, by Application 2020 & 2033
- Table 32: Global USA Onshore Drilling Fluid Industry Revenue billion Forecast, by Additive Type 2020 & 2033
- Table 33: Global USA Onshore Drilling Fluid Industry Revenue billion Forecast, by Product Type 2020 & 2033
- Table 34: Global USA Onshore Drilling Fluid Industry Revenue billion Forecast, by Basin 2020 & 2033
- Table 35: Global USA Onshore Drilling Fluid Industry Revenue billion Forecast, by Country 2020 & 2033
- Table 36: Turkey USA Onshore Drilling Fluid Industry Revenue (billion) Forecast, by Application 2020 & 2033
- Table 37: Israel USA Onshore Drilling Fluid Industry Revenue (billion) Forecast, by Application 2020 & 2033
- Table 38: GCC USA Onshore Drilling Fluid Industry Revenue (billion) Forecast, by Application 2020 & 2033
- Table 39: North Africa USA Onshore Drilling Fluid Industry Revenue (billion) Forecast, by Application 2020 & 2033
- Table 40: South Africa USA Onshore Drilling Fluid Industry Revenue (billion) Forecast, by Application 2020 & 2033
- Table 41: Rest of Middle East & Africa USA Onshore Drilling Fluid Industry Revenue (billion) Forecast, by Application 2020 & 2033
- Table 42: Global USA Onshore Drilling Fluid Industry Revenue billion Forecast, by Additive Type 2020 & 2033
- Table 43: Global USA Onshore Drilling Fluid Industry Revenue billion Forecast, by Product Type 2020 & 2033
- Table 44: Global USA Onshore Drilling Fluid Industry Revenue billion Forecast, by Basin 2020 & 2033
- Table 45: Global USA Onshore Drilling Fluid Industry Revenue billion Forecast, by Country 2020 & 2033
- Table 46: China USA Onshore Drilling Fluid Industry Revenue (billion) Forecast, by Application 2020 & 2033
- Table 47: India USA Onshore Drilling Fluid Industry Revenue (billion) Forecast, by Application 2020 & 2033
- Table 48: Japan USA Onshore Drilling Fluid Industry Revenue (billion) Forecast, by Application 2020 & 2033
- Table 49: South Korea USA Onshore Drilling Fluid Industry Revenue (billion) Forecast, by Application 2020 & 2033
- Table 50: ASEAN USA Onshore Drilling Fluid Industry Revenue (billion) Forecast, by Application 2020 & 2033
- Table 51: Oceania USA Onshore Drilling Fluid Industry Revenue (billion) Forecast, by Application 2020 & 2033
- Table 52: Rest of Asia Pacific USA Onshore Drilling Fluid Industry Revenue (billion) Forecast, by Application 2020 & 2033
Frequently Asked Questions
1. What is the projected Compound Annual Growth Rate (CAGR) of the USA Onshore Drilling Fluid Industry?
The projected CAGR is approximately 7.5%.
2. Which companies are prominent players in the USA Onshore Drilling Fluid Industry?
Key companies in the market include IMDEX LIMITED, Horizon Mud, Aes Drilling Fluids, MEDSERV, Baker Hughes Company, Schlumberger Limited, Newpark Resources Inc, Weatherford, National Oilwell Varco, Francis Drilling Fluids Ltd, Oleon Americas Inc (Avril Group), Q'max Solutions Inc, Unique Drilling Fluids Inc, Sunwest Fluids LLC, McAda Drilling Fluids, Geo Drilling Fluids Inc, CES Energy Solutions Corp *List Not Exhaustive.
3. What are the main segments of the USA Onshore Drilling Fluid Industry?
The market segments include Additive Type, Product Type, Basin.
4. Can you provide details about the market size?
The market size is estimated to be USD 2.7 billion as of 2022.
5. What are some drivers contributing to market growth?
; Low Breakeven Price and High Crude Oil Price; Increasing Demand for Longer Lateral Length; Continuous Growth in Demand from Permian Basin.
6. What are the notable trends driving market growth?
Continuous Growth in Demand from Permian Basin.
7. Are there any restraints impacting market growth?
; Low Breakeven Price and High Crude Oil Price; Increasing Demand for Longer Lateral Length; Continuous Growth in Demand from Permian Basin.
8. Can you provide examples of recent developments in the market?
N/A
9. What pricing options are available for accessing the report?
Pricing options include single-user, multi-user, and enterprise licenses priced at USD 3800, USD 4500, and USD 5800 respectively.
10. Is the market size provided in terms of value or volume?
The market size is provided in terms of value, measured in billion.
11. Are there any specific market keywords associated with the report?
Yes, the market keyword associated with the report is "USA Onshore Drilling Fluid Industry," which aids in identifying and referencing the specific market segment covered.
12. How do I determine which pricing option suits my needs best?
The pricing options vary based on user requirements and access needs. Individual users may opt for single-user licenses, while businesses requiring broader access may choose multi-user or enterprise licenses for cost-effective access to the report.
13. Are there any additional resources or data provided in the USA Onshore Drilling Fluid Industry report?
While the report offers comprehensive insights, it's advisable to review the specific contents or supplementary materials provided to ascertain if additional resources or data are available.
14. How can I stay updated on further developments or reports in the USA Onshore Drilling Fluid Industry?
To stay informed about further developments, trends, and reports in the USA Onshore Drilling Fluid Industry, consider subscribing to industry newsletters, following relevant companies and organizations, or regularly checking reputable industry news sources and publications.
Methodology
Step 1 - Identification of Relevant Samples Size from Population Database


Step 2 - Approaches for Defining Global Market Size (Value, Volume* & Price*)

Note*: In applicable scenarios
Step 3 - Data Sources
Primary Research
- Web Analytics
- Survey Reports
- Research Institute
- Latest Research Reports
- Opinion Leaders
Secondary Research
- Annual Reports
- White Paper
- Latest Press Release
- Industry Association
- Paid Database
- Investor Presentations

Step 4 - Data Triangulation
Involves using different sources of information in order to increase the validity of a study
These sources are likely to be stakeholders in a program - participants, other researchers, program staff, other community members, and so on.
Then we put all data in single framework & apply various statistical tools to find out the dynamic on the market.
During the analysis stage, feedback from the stakeholder groups would be compared to determine areas of agreement as well as areas of divergence