Key Insights
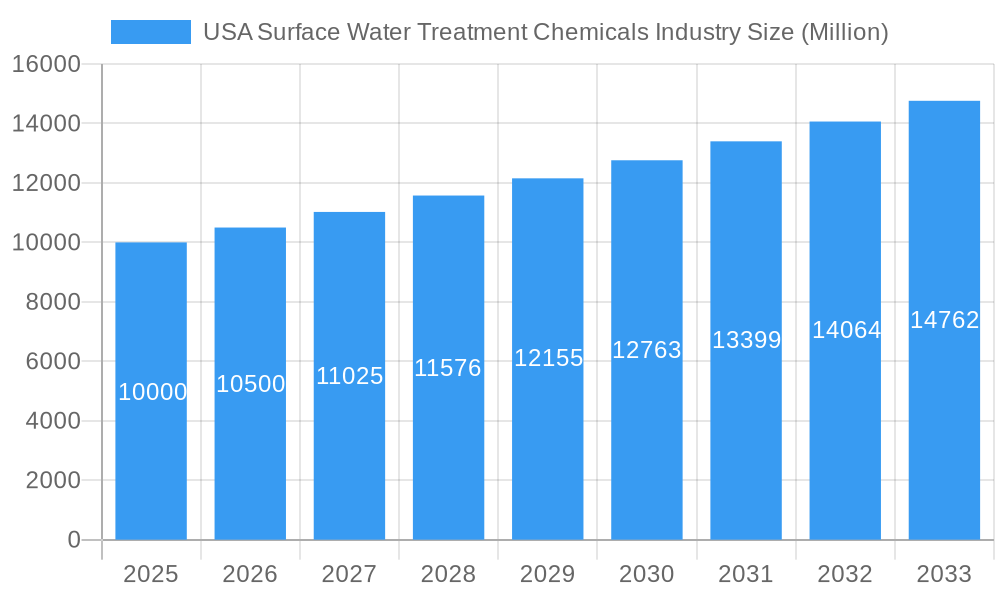
The US surface water treatment chemicals market is experiencing robust growth, driven by increasing urbanization, industrialization, and stringent regulatory compliance concerning water quality. The market, estimated at $10 billion in 2025, is projected to exhibit a healthy Compound Annual Growth Rate (CAGR) throughout the forecast period (2025-2033). This growth is fueled by several key factors. Firstly, the rising prevalence of waterborne diseases necessitates advanced treatment technologies, boosting demand for effective chemicals. Secondly, stricter EPA regulations and increasing public awareness of water quality issues are driving investments in advanced treatment infrastructure and consequently, chemical consumption. Furthermore, the expanding use of coagulation, flocculation, disinfection, and other water treatment processes across various sectors, including municipal water supplies, industrial applications, and agricultural irrigation, contributes to the market's expansion. Technological advancements leading to more efficient and environmentally friendly chemicals are also stimulating market growth.
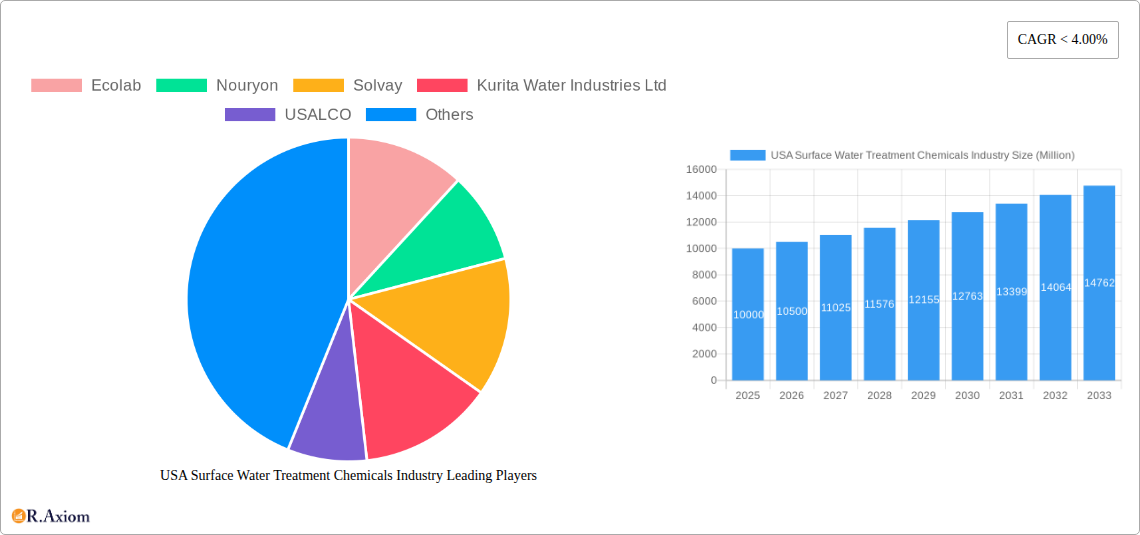
USA Surface Water Treatment Chemicals Industry Market Size (In Billion)
While precise figures for historical market size (2019-2024) are unavailable, a reasonable estimation, considering the current market size and expected CAGR, points towards a steady increase from approximately $8 billion in 2019 to $10 billion in 2025. The forecast period will see continued growth, primarily due to expanding infrastructure projects, particularly in rapidly developing regions of the US. This growth is expected to be slightly moderated by increasing focus on sustainable and eco-friendly alternatives, potentially leading to shifts in chemical composition and market share among various chemical types. However, the overall positive trends in water infrastructure investments and stricter environmental regulations suggest a continued upward trajectory for the market throughout the forecast period.
USA Surface Water Treatment Chemicals Industry Company Market Share
USA Surface Water Treatment Chemicals Industry: A Comprehensive Market Report (2019-2033)
This detailed report provides a comprehensive analysis of the USA surface water treatment chemicals industry, offering invaluable insights for industry stakeholders, investors, and strategic decision-makers. The study covers the period 2019-2033, with 2025 as the base year and a forecast period extending to 2033. The report leverages extensive primary and secondary research to deliver a precise and actionable overview of this dynamic market.
USA Surface Water Treatment Chemicals Industry Market Concentration & Innovation
The USA surface water treatment chemicals market exhibits a moderately concentrated landscape, with key players like Ecolab, Nouryon, Solvay, and Kemira holding significant market share. The combined market share of the top five players is estimated at xx%. Innovation is driven by stringent environmental regulations, the increasing demand for sustainable solutions, and the need for enhanced water treatment efficiency. Key drivers of innovation include the development of advanced biocides, more efficient coagulants, and corrosion inhibitors with reduced environmental impact.
- Market Concentration: Top 5 players hold approximately xx% market share in 2025.
- Innovation Drivers: Stringent environmental regulations, demand for sustainable solutions, and efficiency improvements.
- Regulatory Frameworks: EPA regulations significantly impact product development and market access.
- Product Substitutes: The emergence of alternative technologies, such as membrane filtration, presents a competitive challenge.
- End-User Trends: Growing awareness of water scarcity and water quality is fueling demand for advanced treatment solutions.
- M&A Activities: The industry has witnessed several mergers and acquisitions in recent years, with deal values exceeding $xx Million in the period 2019-2024. These activities are primarily driven by the need to expand market reach and diversify product portfolios.
USA Surface Water Treatment Chemicals Industry Industry Trends & Insights
The USA surface water treatment chemicals market is experiencing robust growth, projected to register a CAGR of xx% during the forecast period (2025-2033). This growth is propelled by several key factors, including rising industrialization, increasing urbanization, growing concerns over waterborne diseases, and the stringent implementation of water quality standards. Technological advancements, such as the development of nanotechnology-based treatment solutions and AI-powered water management systems, are further boosting market expansion. However, fluctuating raw material prices and economic uncertainties pose challenges to sustained growth. Market penetration of advanced treatment technologies remains relatively low, presenting significant opportunities for future expansion. Competitive dynamics are characterized by intense price competition and a focus on developing value-added services.
Dominant Markets & Segments in USA Surface Water Treatment Chemicals Industry
The Municipal segment dominates the end-user industry, driven by increasing investments in municipal water infrastructure and stringent regulations on effluent discharge. Among product types, Coagulants and Flocculants hold the largest market share, owing to their widespread application in various water treatment processes. The Western region of the USA exhibits the highest market growth due to factors including rapid industrialization, increasing population density, and the presence of significant industrial clusters.
- Dominant End-User Industry: Municipal (driven by infrastructure investments and regulations)
- Dominant Product Type: Coagulants and Flocculants (widely used in water treatment)
- Dominant Region: Western USA (due to industrialization, population density, and industrial clusters)
Key Drivers (by segment):
- Municipal: Stringent environmental regulations, growing urbanization, and infrastructure development.
- Power: Need for high-quality water for cooling and steam generation.
- Oil and Gas: Water treatment requirements in drilling, fracking, and refining processes.
- Coagulants & Flocculants: Cost-effectiveness and high efficiency in removing suspended solids.
- Biocides & Disinfectants: Growing concerns over waterborne pathogens.
USA Surface Water Treatment Chemicals Industry Product Developments
Recent product innovations focus on environmentally friendly and highly efficient solutions. Companies are developing biocides with reduced toxicity, coagulants with improved settling characteristics, and corrosion inhibitors that minimize environmental impact. The focus is on developing products that cater to specific end-user needs, offering customized solutions and value-added services. This trend toward customized solutions is enhancing product differentiation and increasing market competitiveness.
Report Scope & Segmentation Analysis
This report segments the USA surface water treatment chemicals market by product type (Biocides and Disinfectants, Coagulants and Flocculants, Corrosion and Scale Inhibitors, Defoamers and Defoaming Agents, pH & Adjusters and Softeners, Other Product Types) and end-user industry (Power, Oil and Gas, Chemical Manufacturing, Mining and Mineral Processing, Municipal, Food and Beverage, Pulp and Paper, Other End-user Industries). Each segment's market size, growth projections, and competitive landscape are analyzed in detail, providing a granular understanding of the market dynamics.
Key Drivers of USA Surface Water Treatment Chemicals Industry Growth
Several factors drive market growth, including stringent environmental regulations necessitating advanced water treatment, rapid industrialization and urbanization increasing water demand, growing awareness of waterborne diseases, and technological advancements in treatment technologies. Government initiatives promoting water conservation and infrastructure development further stimulate market expansion.
Challenges in the USA Surface Water Treatment Chemicals Industry Sector
The industry faces challenges such as fluctuating raw material prices impacting production costs, stringent regulatory compliance requirements increasing operational complexity, and intense competition from both domestic and international players. Supply chain disruptions can also affect product availability and pricing.
Emerging Opportunities in USA Surface Water Treatment Chemicals Industry
Emerging opportunities include the growing demand for sustainable and eco-friendly water treatment solutions, increasing adoption of advanced technologies such as membrane filtration and nanotechnology, and the expansion of water treatment infrastructure in developing regions. The focus on developing smart water management systems presents a significant growth avenue.
Leading Players in the USA Surface Water Treatment Chemicals Industry Market
- Ecolab
- Nouryon
- Solvay
- Kurita Water Industries Ltd
- USALCO
- SUEZ
- Kemira
- Dow
- ChemTreat Inc
- Solenis
- Buckman Laboratories Inc
- Veolia
- Albemarle Corporation
- Chemtrade
Key Developments in USA Surface Water Treatment Chemicals Industry Industry
- 2023: Ecolab launched a new line of sustainable biocides.
- 2022: Solvay acquired a smaller water treatment chemicals company, expanding its market reach.
- 2021: New EPA regulations on wastewater discharge came into effect, impacting the industry.
- 2020: The COVID-19 pandemic temporarily disrupted supply chains. (Further developments can be added here)
Strategic Outlook for USA Surface Water Treatment Chemicals Industry Market
The USA surface water treatment chemicals market is poised for significant growth, driven by long-term trends such as increasing water scarcity, stringent environmental regulations, and technological advancements. Companies focusing on sustainable and innovative solutions, coupled with strategic partnerships and acquisitions, are well-positioned to capitalize on the market's growth potential. The market is expected to witness increased consolidation and a shift toward providing comprehensive water management solutions, beyond just chemical treatments.
USA Surface Water Treatment Chemicals Industry Segmentation
-
1. Product Type
- 1.1. Biocides and Disinfectants
- 1.2. Coagulants and Flocculants
- 1.3. Corrosion and Scale Inhibitors
- 1.4. Defoamers and Defoaming Agents
- 1.5. pH & Adjusters and Softeners
- 1.6. Other Product Types
-
2. End-user Industry
- 2.1. Power
- 2.2. Oil and Gas
- 2.3. Chemical Manufacturing
- 2.4. Mining and Mineral Processing
- 2.5. Municipal
- 2.6. Food and Beverage
- 2.7. Pulp and Paper
- 2.8. Other End-user Industries
USA Surface Water Treatment Chemicals Industry Segmentation By Geography
-
1. North America
- 1.1. United States
- 1.2. Canada
- 1.3. Mexico
-
2. South America
- 2.1. Brazil
- 2.2. Argentina
- 2.3. Rest of South America
-
3. Europe
- 3.1. United Kingdom
- 3.2. Germany
- 3.3. France
- 3.4. Italy
- 3.5. Spain
- 3.6. Russia
- 3.7. Benelux
- 3.8. Nordics
- 3.9. Rest of Europe
-
4. Middle East & Africa
- 4.1. Turkey
- 4.2. Israel
- 4.3. GCC
- 4.4. North Africa
- 4.5. South Africa
- 4.6. Rest of Middle East & Africa
-
5. Asia Pacific
- 5.1. China
- 5.2. India
- 5.3. Japan
- 5.4. South Korea
- 5.5. ASEAN
- 5.6. Oceania
- 5.7. Rest of Asia Pacific
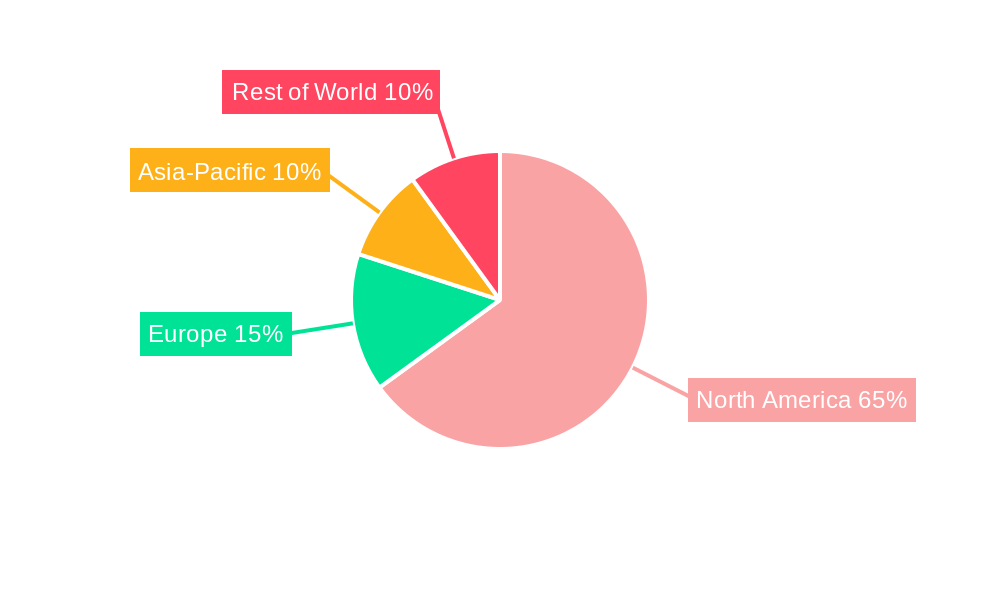
USA Surface Water Treatment Chemicals Industry Regional Market Share
Geographic Coverage of USA Surface Water Treatment Chemicals Industry
USA Surface Water Treatment Chemicals Industry REPORT HIGHLIGHTS
| Aspects | Details |
|---|---|
| Study Period | 2020-2034 |
| Base Year | 2025 |
| Estimated Year | 2026 |
| Forecast Period | 2026-2034 |
| Historical Period | 2020-2025 |
| Growth Rate | CAGR of 4.2% from 2020-2034 |
| Segmentation |
|
Table of Contents
- 1. Introduction
- 1.1. Research Scope
- 1.2. Market Segmentation
- 1.3. Research Objective
- 1.4. Definitions and Assumptions
- 2. Executive Summary
- 2.1. Market Snapshot
- 3. Market Dynamics
- 3.1. Market Drivers
- 3.2. Market Restrains
- 3.3. Market Trends
- 3.4. Market Opportunities
- 4. Market Factor Analysis
- 4.1. Porters Five Forces
- 4.1.1. Bargaining Power of Suppliers
- 4.1.2. Bargaining Power of Buyers
- 4.1.3. Threat of New Entrants
- 4.1.4. Threat of Substitutes
- 4.1.5. Competitive Rivalry
- 4.2. PESTEL analysis
- 4.3. BCG Analysis
- 4.3.1. Stars (High Growth, High Market Share)
- 4.3.2. Cash Cows (Low Growth, High Market Share)
- 4.3.3. Question Mark (High Growth, Low Market Share)
- 4.3.4. Dogs (Low Growth, Low Market Share)
- 4.4. Ansoff Matrix Analysis
- 4.5. Supply Chain Analysis
- 4.6. Regulatory Landscape
- 4.7. Current Market Potential and Opportunity Assessment (TAM–SAM–SOM Framework)
- 4.8. RAX Analyst Note
- 4.1. Porters Five Forces
- 5. Market Analysis, Insights and Forecast 2021-2033
- 5.1. Market Analysis, Insights and Forecast - by Product Type
- 5.1.1. Biocides and Disinfectants
- 5.1.2. Coagulants and Flocculants
- 5.1.3. Corrosion and Scale Inhibitors
- 5.1.4. Defoamers and Defoaming Agents
- 5.1.5. pH & Adjusters and Softeners
- 5.1.6. Other Product Types
- 5.2. Market Analysis, Insights and Forecast - by End-user Industry
- 5.2.1. Power
- 5.2.2. Oil and Gas
- 5.2.3. Chemical Manufacturing
- 5.2.4. Mining and Mineral Processing
- 5.2.5. Municipal
- 5.2.6. Food and Beverage
- 5.2.7. Pulp and Paper
- 5.2.8. Other End-user Industries
- 5.3. Market Analysis, Insights and Forecast - by Region
- 5.3.1. North America
- 5.3.2. South America
- 5.3.3. Europe
- 5.3.4. Middle East & Africa
- 5.3.5. Asia Pacific
- 5.1. Market Analysis, Insights and Forecast - by Product Type
- 6. Global USA Surface Water Treatment Chemicals Industry Analysis, Insights and Forecast, 2021-2033
- 6.1. Market Analysis, Insights and Forecast - by Product Type
- 6.1.1. Biocides and Disinfectants
- 6.1.2. Coagulants and Flocculants
- 6.1.3. Corrosion and Scale Inhibitors
- 6.1.4. Defoamers and Defoaming Agents
- 6.1.5. pH & Adjusters and Softeners
- 6.1.6. Other Product Types
- 6.2. Market Analysis, Insights and Forecast - by End-user Industry
- 6.2.1. Power
- 6.2.2. Oil and Gas
- 6.2.3. Chemical Manufacturing
- 6.2.4. Mining and Mineral Processing
- 6.2.5. Municipal
- 6.2.6. Food and Beverage
- 6.2.7. Pulp and Paper
- 6.2.8. Other End-user Industries
- 6.1. Market Analysis, Insights and Forecast - by Product Type
- 7. North America USA Surface Water Treatment Chemicals Industry Analysis, Insights and Forecast, 2020-2032
- 7.1. Market Analysis, Insights and Forecast - by Product Type
- 7.1.1. Biocides and Disinfectants
- 7.1.2. Coagulants and Flocculants
- 7.1.3. Corrosion and Scale Inhibitors
- 7.1.4. Defoamers and Defoaming Agents
- 7.1.5. pH & Adjusters and Softeners
- 7.1.6. Other Product Types
- 7.2. Market Analysis, Insights and Forecast - by End-user Industry
- 7.2.1. Power
- 7.2.2. Oil and Gas
- 7.2.3. Chemical Manufacturing
- 7.2.4. Mining and Mineral Processing
- 7.2.5. Municipal
- 7.2.6. Food and Beverage
- 7.2.7. Pulp and Paper
- 7.2.8. Other End-user Industries
- 7.1. Market Analysis, Insights and Forecast - by Product Type
- 8. South America USA Surface Water Treatment Chemicals Industry Analysis, Insights and Forecast, 2020-2032
- 8.1. Market Analysis, Insights and Forecast - by Product Type
- 8.1.1. Biocides and Disinfectants
- 8.1.2. Coagulants and Flocculants
- 8.1.3. Corrosion and Scale Inhibitors
- 8.1.4. Defoamers and Defoaming Agents
- 8.1.5. pH & Adjusters and Softeners
- 8.1.6. Other Product Types
- 8.2. Market Analysis, Insights and Forecast - by End-user Industry
- 8.2.1. Power
- 8.2.2. Oil and Gas
- 8.2.3. Chemical Manufacturing
- 8.2.4. Mining and Mineral Processing
- 8.2.5. Municipal
- 8.2.6. Food and Beverage
- 8.2.7. Pulp and Paper
- 8.2.8. Other End-user Industries
- 8.1. Market Analysis, Insights and Forecast - by Product Type
- 9. Europe USA Surface Water Treatment Chemicals Industry Analysis, Insights and Forecast, 2020-2032
- 9.1. Market Analysis, Insights and Forecast - by Product Type
- 9.1.1. Biocides and Disinfectants
- 9.1.2. Coagulants and Flocculants
- 9.1.3. Corrosion and Scale Inhibitors
- 9.1.4. Defoamers and Defoaming Agents
- 9.1.5. pH & Adjusters and Softeners
- 9.1.6. Other Product Types
- 9.2. Market Analysis, Insights and Forecast - by End-user Industry
- 9.2.1. Power
- 9.2.2. Oil and Gas
- 9.2.3. Chemical Manufacturing
- 9.2.4. Mining and Mineral Processing
- 9.2.5. Municipal
- 9.2.6. Food and Beverage
- 9.2.7. Pulp and Paper
- 9.2.8. Other End-user Industries
- 9.1. Market Analysis, Insights and Forecast - by Product Type
- 10. Middle East & Africa USA Surface Water Treatment Chemicals Industry Analysis, Insights and Forecast, 2020-2032
- 10.1. Market Analysis, Insights and Forecast - by Product Type
- 10.1.1. Biocides and Disinfectants
- 10.1.2. Coagulants and Flocculants
- 10.1.3. Corrosion and Scale Inhibitors
- 10.1.4. Defoamers and Defoaming Agents
- 10.1.5. pH & Adjusters and Softeners
- 10.1.6. Other Product Types
- 10.2. Market Analysis, Insights and Forecast - by End-user Industry
- 10.2.1. Power
- 10.2.2. Oil and Gas
- 10.2.3. Chemical Manufacturing
- 10.2.4. Mining and Mineral Processing
- 10.2.5. Municipal
- 10.2.6. Food and Beverage
- 10.2.7. Pulp and Paper
- 10.2.8. Other End-user Industries
- 10.1. Market Analysis, Insights and Forecast - by Product Type
- 11. Asia Pacific USA Surface Water Treatment Chemicals Industry Analysis, Insights and Forecast, 2020-2032
- 11.1. Market Analysis, Insights and Forecast - by Product Type
- 11.1.1. Biocides and Disinfectants
- 11.1.2. Coagulants and Flocculants
- 11.1.3. Corrosion and Scale Inhibitors
- 11.1.4. Defoamers and Defoaming Agents
- 11.1.5. pH & Adjusters and Softeners
- 11.1.6. Other Product Types
- 11.2. Market Analysis, Insights and Forecast - by End-user Industry
- 11.2.1. Power
- 11.2.2. Oil and Gas
- 11.2.3. Chemical Manufacturing
- 11.2.4. Mining and Mineral Processing
- 11.2.5. Municipal
- 11.2.6. Food and Beverage
- 11.2.7. Pulp and Paper
- 11.2.8. Other End-user Industries
- 11.1. Market Analysis, Insights and Forecast - by Product Type
- 12. Competitive Analysis
- 12.1. Company Profiles
- 12.1.1 Ecolab
- 12.1.1.1. Company Overview
- 12.1.1.2. Products
- 12.1.1.3. Company Financials
- 12.1.1.4. SWOT Analysis
- 12.1.2 Nouryon
- 12.1.2.1. Company Overview
- 12.1.2.2. Products
- 12.1.2.3. Company Financials
- 12.1.2.4. SWOT Analysis
- 12.1.3 Solvay
- 12.1.3.1. Company Overview
- 12.1.3.2. Products
- 12.1.3.3. Company Financials
- 12.1.3.4. SWOT Analysis
- 12.1.4 Kurita Water Industries Ltd
- 12.1.4.1. Company Overview
- 12.1.4.2. Products
- 12.1.4.3. Company Financials
- 12.1.4.4. SWOT Analysis
- 12.1.5 USALCO
- 12.1.5.1. Company Overview
- 12.1.5.2. Products
- 12.1.5.3. Company Financials
- 12.1.5.4. SWOT Analysis
- 12.1.6 SUEZ
- 12.1.6.1. Company Overview
- 12.1.6.2. Products
- 12.1.6.3. Company Financials
- 12.1.6.4. SWOT Analysis
- 12.1.7 Kemira
- 12.1.7.1. Company Overview
- 12.1.7.2. Products
- 12.1.7.3. Company Financials
- 12.1.7.4. SWOT Analysis
- 12.1.8 Dow
- 12.1.8.1. Company Overview
- 12.1.8.2. Products
- 12.1.8.3. Company Financials
- 12.1.8.4. SWOT Analysis
- 12.1.9 ChemTreat Inc
- 12.1.9.1. Company Overview
- 12.1.9.2. Products
- 12.1.9.3. Company Financials
- 12.1.9.4. SWOT Analysis
- 12.1.10 Solenis
- 12.1.10.1. Company Overview
- 12.1.10.2. Products
- 12.1.10.3. Company Financials
- 12.1.10.4. SWOT Analysis
- 12.1.11 Buckman Laboratories Inc
- 12.1.11.1. Company Overview
- 12.1.11.2. Products
- 12.1.11.3. Company Financials
- 12.1.11.4. SWOT Analysis
- 12.1.12 Veolia
- 12.1.12.1. Company Overview
- 12.1.12.2. Products
- 12.1.12.3. Company Financials
- 12.1.12.4. SWOT Analysis
- 12.1.13 Albemarle Corporation
- 12.1.13.1. Company Overview
- 12.1.13.2. Products
- 12.1.13.3. Company Financials
- 12.1.13.4. SWOT Analysis
- 12.1.14 Chemtrade
- 12.1.14.1. Company Overview
- 12.1.14.2. Products
- 12.1.14.3. Company Financials
- 12.1.14.4. SWOT Analysis
- 12.1.1 Ecolab
- 12.2. Market Entropy
- 12.2.1 Company's Key Areas Served
- 12.2.2 Recent Developments
- 12.3. Company Market Share Analysis 2025
- 12.3.1 Top 5 Companies Market Share Analysis
- 12.3.2 Top 3 Companies Market Share Analysis
- 12.4. List of Potential Customers
- 13. Research Methodology
List of Figures
- Figure 1: Global USA Surface Water Treatment Chemicals Industry Revenue Breakdown (billion, %) by Region 2025 & 2033
- Figure 2: Global USA Surface Water Treatment Chemicals Industry Volume Breakdown (K Tons, %) by Region 2025 & 2033
- Figure 3: North America USA Surface Water Treatment Chemicals Industry Revenue (billion), by Product Type 2025 & 2033
- Figure 4: North America USA Surface Water Treatment Chemicals Industry Volume (K Tons), by Product Type 2025 & 2033
- Figure 5: North America USA Surface Water Treatment Chemicals Industry Revenue Share (%), by Product Type 2025 & 2033
- Figure 6: North America USA Surface Water Treatment Chemicals Industry Volume Share (%), by Product Type 2025 & 2033
- Figure 7: North America USA Surface Water Treatment Chemicals Industry Revenue (billion), by End-user Industry 2025 & 2033
- Figure 8: North America USA Surface Water Treatment Chemicals Industry Volume (K Tons), by End-user Industry 2025 & 2033
- Figure 9: North America USA Surface Water Treatment Chemicals Industry Revenue Share (%), by End-user Industry 2025 & 2033
- Figure 10: North America USA Surface Water Treatment Chemicals Industry Volume Share (%), by End-user Industry 2025 & 2033
- Figure 11: North America USA Surface Water Treatment Chemicals Industry Revenue (billion), by Country 2025 & 2033
- Figure 12: North America USA Surface Water Treatment Chemicals Industry Volume (K Tons), by Country 2025 & 2033
- Figure 13: North America USA Surface Water Treatment Chemicals Industry Revenue Share (%), by Country 2025 & 2033
- Figure 14: North America USA Surface Water Treatment Chemicals Industry Volume Share (%), by Country 2025 & 2033
- Figure 15: South America USA Surface Water Treatment Chemicals Industry Revenue (billion), by Product Type 2025 & 2033
- Figure 16: South America USA Surface Water Treatment Chemicals Industry Volume (K Tons), by Product Type 2025 & 2033
- Figure 17: South America USA Surface Water Treatment Chemicals Industry Revenue Share (%), by Product Type 2025 & 2033
- Figure 18: South America USA Surface Water Treatment Chemicals Industry Volume Share (%), by Product Type 2025 & 2033
- Figure 19: South America USA Surface Water Treatment Chemicals Industry Revenue (billion), by End-user Industry 2025 & 2033
- Figure 20: South America USA Surface Water Treatment Chemicals Industry Volume (K Tons), by End-user Industry 2025 & 2033
- Figure 21: South America USA Surface Water Treatment Chemicals Industry Revenue Share (%), by End-user Industry 2025 & 2033
- Figure 22: South America USA Surface Water Treatment Chemicals Industry Volume Share (%), by End-user Industry 2025 & 2033
- Figure 23: South America USA Surface Water Treatment Chemicals Industry Revenue (billion), by Country 2025 & 2033
- Figure 24: South America USA Surface Water Treatment Chemicals Industry Volume (K Tons), by Country 2025 & 2033
- Figure 25: South America USA Surface Water Treatment Chemicals Industry Revenue Share (%), by Country 2025 & 2033
- Figure 26: South America USA Surface Water Treatment Chemicals Industry Volume Share (%), by Country 2025 & 2033
- Figure 27: Europe USA Surface Water Treatment Chemicals Industry Revenue (billion), by Product Type 2025 & 2033
- Figure 28: Europe USA Surface Water Treatment Chemicals Industry Volume (K Tons), by Product Type 2025 & 2033
- Figure 29: Europe USA Surface Water Treatment Chemicals Industry Revenue Share (%), by Product Type 2025 & 2033
- Figure 30: Europe USA Surface Water Treatment Chemicals Industry Volume Share (%), by Product Type 2025 & 2033
- Figure 31: Europe USA Surface Water Treatment Chemicals Industry Revenue (billion), by End-user Industry 2025 & 2033
- Figure 32: Europe USA Surface Water Treatment Chemicals Industry Volume (K Tons), by End-user Industry 2025 & 2033
- Figure 33: Europe USA Surface Water Treatment Chemicals Industry Revenue Share (%), by End-user Industry 2025 & 2033
- Figure 34: Europe USA Surface Water Treatment Chemicals Industry Volume Share (%), by End-user Industry 2025 & 2033
- Figure 35: Europe USA Surface Water Treatment Chemicals Industry Revenue (billion), by Country 2025 & 2033
- Figure 36: Europe USA Surface Water Treatment Chemicals Industry Volume (K Tons), by Country 2025 & 2033
- Figure 37: Europe USA Surface Water Treatment Chemicals Industry Revenue Share (%), by Country 2025 & 2033
- Figure 38: Europe USA Surface Water Treatment Chemicals Industry Volume Share (%), by Country 2025 & 2033
- Figure 39: Middle East & Africa USA Surface Water Treatment Chemicals Industry Revenue (billion), by Product Type 2025 & 2033
- Figure 40: Middle East & Africa USA Surface Water Treatment Chemicals Industry Volume (K Tons), by Product Type 2025 & 2033
- Figure 41: Middle East & Africa USA Surface Water Treatment Chemicals Industry Revenue Share (%), by Product Type 2025 & 2033
- Figure 42: Middle East & Africa USA Surface Water Treatment Chemicals Industry Volume Share (%), by Product Type 2025 & 2033
- Figure 43: Middle East & Africa USA Surface Water Treatment Chemicals Industry Revenue (billion), by End-user Industry 2025 & 2033
- Figure 44: Middle East & Africa USA Surface Water Treatment Chemicals Industry Volume (K Tons), by End-user Industry 2025 & 2033
- Figure 45: Middle East & Africa USA Surface Water Treatment Chemicals Industry Revenue Share (%), by End-user Industry 2025 & 2033
- Figure 46: Middle East & Africa USA Surface Water Treatment Chemicals Industry Volume Share (%), by End-user Industry 2025 & 2033
- Figure 47: Middle East & Africa USA Surface Water Treatment Chemicals Industry Revenue (billion), by Country 2025 & 2033
- Figure 48: Middle East & Africa USA Surface Water Treatment Chemicals Industry Volume (K Tons), by Country 2025 & 2033
- Figure 49: Middle East & Africa USA Surface Water Treatment Chemicals Industry Revenue Share (%), by Country 2025 & 2033
- Figure 50: Middle East & Africa USA Surface Water Treatment Chemicals Industry Volume Share (%), by Country 2025 & 2033
- Figure 51: Asia Pacific USA Surface Water Treatment Chemicals Industry Revenue (billion), by Product Type 2025 & 2033
- Figure 52: Asia Pacific USA Surface Water Treatment Chemicals Industry Volume (K Tons), by Product Type 2025 & 2033
- Figure 53: Asia Pacific USA Surface Water Treatment Chemicals Industry Revenue Share (%), by Product Type 2025 & 2033
- Figure 54: Asia Pacific USA Surface Water Treatment Chemicals Industry Volume Share (%), by Product Type 2025 & 2033
- Figure 55: Asia Pacific USA Surface Water Treatment Chemicals Industry Revenue (billion), by End-user Industry 2025 & 2033
- Figure 56: Asia Pacific USA Surface Water Treatment Chemicals Industry Volume (K Tons), by End-user Industry 2025 & 2033
- Figure 57: Asia Pacific USA Surface Water Treatment Chemicals Industry Revenue Share (%), by End-user Industry 2025 & 2033
- Figure 58: Asia Pacific USA Surface Water Treatment Chemicals Industry Volume Share (%), by End-user Industry 2025 & 2033
- Figure 59: Asia Pacific USA Surface Water Treatment Chemicals Industry Revenue (billion), by Country 2025 & 2033
- Figure 60: Asia Pacific USA Surface Water Treatment Chemicals Industry Volume (K Tons), by Country 2025 & 2033
- Figure 61: Asia Pacific USA Surface Water Treatment Chemicals Industry Revenue Share (%), by Country 2025 & 2033
- Figure 62: Asia Pacific USA Surface Water Treatment Chemicals Industry Volume Share (%), by Country 2025 & 2033
List of Tables
- Table 1: Global USA Surface Water Treatment Chemicals Industry Revenue billion Forecast, by Product Type 2020 & 2033
- Table 2: Global USA Surface Water Treatment Chemicals Industry Volume K Tons Forecast, by Product Type 2020 & 2033
- Table 3: Global USA Surface Water Treatment Chemicals Industry Revenue billion Forecast, by End-user Industry 2020 & 2033
- Table 4: Global USA Surface Water Treatment Chemicals Industry Volume K Tons Forecast, by End-user Industry 2020 & 2033
- Table 5: Global USA Surface Water Treatment Chemicals Industry Revenue billion Forecast, by Region 2020 & 2033
- Table 6: Global USA Surface Water Treatment Chemicals Industry Volume K Tons Forecast, by Region 2020 & 2033
- Table 7: Global USA Surface Water Treatment Chemicals Industry Revenue billion Forecast, by Product Type 2020 & 2033
- Table 8: Global USA Surface Water Treatment Chemicals Industry Volume K Tons Forecast, by Product Type 2020 & 2033
- Table 9: Global USA Surface Water Treatment Chemicals Industry Revenue billion Forecast, by End-user Industry 2020 & 2033
- Table 10: Global USA Surface Water Treatment Chemicals Industry Volume K Tons Forecast, by End-user Industry 2020 & 2033
- Table 11: Global USA Surface Water Treatment Chemicals Industry Revenue billion Forecast, by Country 2020 & 2033
- Table 12: Global USA Surface Water Treatment Chemicals Industry Volume K Tons Forecast, by Country 2020 & 2033
- Table 13: United States USA Surface Water Treatment Chemicals Industry Revenue (billion) Forecast, by Application 2020 & 2033
- Table 14: United States USA Surface Water Treatment Chemicals Industry Volume (K Tons) Forecast, by Application 2020 & 2033
- Table 15: Canada USA Surface Water Treatment Chemicals Industry Revenue (billion) Forecast, by Application 2020 & 2033
- Table 16: Canada USA Surface Water Treatment Chemicals Industry Volume (K Tons) Forecast, by Application 2020 & 2033
- Table 17: Mexico USA Surface Water Treatment Chemicals Industry Revenue (billion) Forecast, by Application 2020 & 2033
- Table 18: Mexico USA Surface Water Treatment Chemicals Industry Volume (K Tons) Forecast, by Application 2020 & 2033
- Table 19: Global USA Surface Water Treatment Chemicals Industry Revenue billion Forecast, by Product Type 2020 & 2033
- Table 20: Global USA Surface Water Treatment Chemicals Industry Volume K Tons Forecast, by Product Type 2020 & 2033
- Table 21: Global USA Surface Water Treatment Chemicals Industry Revenue billion Forecast, by End-user Industry 2020 & 2033
- Table 22: Global USA Surface Water Treatment Chemicals Industry Volume K Tons Forecast, by End-user Industry 2020 & 2033
- Table 23: Global USA Surface Water Treatment Chemicals Industry Revenue billion Forecast, by Country 2020 & 2033
- Table 24: Global USA Surface Water Treatment Chemicals Industry Volume K Tons Forecast, by Country 2020 & 2033
- Table 25: Brazil USA Surface Water Treatment Chemicals Industry Revenue (billion) Forecast, by Application 2020 & 2033
- Table 26: Brazil USA Surface Water Treatment Chemicals Industry Volume (K Tons) Forecast, by Application 2020 & 2033
- Table 27: Argentina USA Surface Water Treatment Chemicals Industry Revenue (billion) Forecast, by Application 2020 & 2033
- Table 28: Argentina USA Surface Water Treatment Chemicals Industry Volume (K Tons) Forecast, by Application 2020 & 2033
- Table 29: Rest of South America USA Surface Water Treatment Chemicals Industry Revenue (billion) Forecast, by Application 2020 & 2033
- Table 30: Rest of South America USA Surface Water Treatment Chemicals Industry Volume (K Tons) Forecast, by Application 2020 & 2033
- Table 31: Global USA Surface Water Treatment Chemicals Industry Revenue billion Forecast, by Product Type 2020 & 2033
- Table 32: Global USA Surface Water Treatment Chemicals Industry Volume K Tons Forecast, by Product Type 2020 & 2033
- Table 33: Global USA Surface Water Treatment Chemicals Industry Revenue billion Forecast, by End-user Industry 2020 & 2033
- Table 34: Global USA Surface Water Treatment Chemicals Industry Volume K Tons Forecast, by End-user Industry 2020 & 2033
- Table 35: Global USA Surface Water Treatment Chemicals Industry Revenue billion Forecast, by Country 2020 & 2033
- Table 36: Global USA Surface Water Treatment Chemicals Industry Volume K Tons Forecast, by Country 2020 & 2033
- Table 37: United Kingdom USA Surface Water Treatment Chemicals Industry Revenue (billion) Forecast, by Application 2020 & 2033
- Table 38: United Kingdom USA Surface Water Treatment Chemicals Industry Volume (K Tons) Forecast, by Application 2020 & 2033
- Table 39: Germany USA Surface Water Treatment Chemicals Industry Revenue (billion) Forecast, by Application 2020 & 2033
- Table 40: Germany USA Surface Water Treatment Chemicals Industry Volume (K Tons) Forecast, by Application 2020 & 2033
- Table 41: France USA Surface Water Treatment Chemicals Industry Revenue (billion) Forecast, by Application 2020 & 2033
- Table 42: France USA Surface Water Treatment Chemicals Industry Volume (K Tons) Forecast, by Application 2020 & 2033
- Table 43: Italy USA Surface Water Treatment Chemicals Industry Revenue (billion) Forecast, by Application 2020 & 2033
- Table 44: Italy USA Surface Water Treatment Chemicals Industry Volume (K Tons) Forecast, by Application 2020 & 2033
- Table 45: Spain USA Surface Water Treatment Chemicals Industry Revenue (billion) Forecast, by Application 2020 & 2033
- Table 46: Spain USA Surface Water Treatment Chemicals Industry Volume (K Tons) Forecast, by Application 2020 & 2033
- Table 47: Russia USA Surface Water Treatment Chemicals Industry Revenue (billion) Forecast, by Application 2020 & 2033
- Table 48: Russia USA Surface Water Treatment Chemicals Industry Volume (K Tons) Forecast, by Application 2020 & 2033
- Table 49: Benelux USA Surface Water Treatment Chemicals Industry Revenue (billion) Forecast, by Application 2020 & 2033
- Table 50: Benelux USA Surface Water Treatment Chemicals Industry Volume (K Tons) Forecast, by Application 2020 & 2033
- Table 51: Nordics USA Surface Water Treatment Chemicals Industry Revenue (billion) Forecast, by Application 2020 & 2033
- Table 52: Nordics USA Surface Water Treatment Chemicals Industry Volume (K Tons) Forecast, by Application 2020 & 2033
- Table 53: Rest of Europe USA Surface Water Treatment Chemicals Industry Revenue (billion) Forecast, by Application 2020 & 2033
- Table 54: Rest of Europe USA Surface Water Treatment Chemicals Industry Volume (K Tons) Forecast, by Application 2020 & 2033
- Table 55: Global USA Surface Water Treatment Chemicals Industry Revenue billion Forecast, by Product Type 2020 & 2033
- Table 56: Global USA Surface Water Treatment Chemicals Industry Volume K Tons Forecast, by Product Type 2020 & 2033
- Table 57: Global USA Surface Water Treatment Chemicals Industry Revenue billion Forecast, by End-user Industry 2020 & 2033
- Table 58: Global USA Surface Water Treatment Chemicals Industry Volume K Tons Forecast, by End-user Industry 2020 & 2033
- Table 59: Global USA Surface Water Treatment Chemicals Industry Revenue billion Forecast, by Country 2020 & 2033
- Table 60: Global USA Surface Water Treatment Chemicals Industry Volume K Tons Forecast, by Country 2020 & 2033
- Table 61: Turkey USA Surface Water Treatment Chemicals Industry Revenue (billion) Forecast, by Application 2020 & 2033
- Table 62: Turkey USA Surface Water Treatment Chemicals Industry Volume (K Tons) Forecast, by Application 2020 & 2033
- Table 63: Israel USA Surface Water Treatment Chemicals Industry Revenue (billion) Forecast, by Application 2020 & 2033
- Table 64: Israel USA Surface Water Treatment Chemicals Industry Volume (K Tons) Forecast, by Application 2020 & 2033
- Table 65: GCC USA Surface Water Treatment Chemicals Industry Revenue (billion) Forecast, by Application 2020 & 2033
- Table 66: GCC USA Surface Water Treatment Chemicals Industry Volume (K Tons) Forecast, by Application 2020 & 2033
- Table 67: North Africa USA Surface Water Treatment Chemicals Industry Revenue (billion) Forecast, by Application 2020 & 2033
- Table 68: North Africa USA Surface Water Treatment Chemicals Industry Volume (K Tons) Forecast, by Application 2020 & 2033
- Table 69: South Africa USA Surface Water Treatment Chemicals Industry Revenue (billion) Forecast, by Application 2020 & 2033
- Table 70: South Africa USA Surface Water Treatment Chemicals Industry Volume (K Tons) Forecast, by Application 2020 & 2033
- Table 71: Rest of Middle East & Africa USA Surface Water Treatment Chemicals Industry Revenue (billion) Forecast, by Application 2020 & 2033
- Table 72: Rest of Middle East & Africa USA Surface Water Treatment Chemicals Industry Volume (K Tons) Forecast, by Application 2020 & 2033
- Table 73: Global USA Surface Water Treatment Chemicals Industry Revenue billion Forecast, by Product Type 2020 & 2033
- Table 74: Global USA Surface Water Treatment Chemicals Industry Volume K Tons Forecast, by Product Type 2020 & 2033
- Table 75: Global USA Surface Water Treatment Chemicals Industry Revenue billion Forecast, by End-user Industry 2020 & 2033
- Table 76: Global USA Surface Water Treatment Chemicals Industry Volume K Tons Forecast, by End-user Industry 2020 & 2033
- Table 77: Global USA Surface Water Treatment Chemicals Industry Revenue billion Forecast, by Country 2020 & 2033
- Table 78: Global USA Surface Water Treatment Chemicals Industry Volume K Tons Forecast, by Country 2020 & 2033
- Table 79: China USA Surface Water Treatment Chemicals Industry Revenue (billion) Forecast, by Application 2020 & 2033
- Table 80: China USA Surface Water Treatment Chemicals Industry Volume (K Tons) Forecast, by Application 2020 & 2033
- Table 81: India USA Surface Water Treatment Chemicals Industry Revenue (billion) Forecast, by Application 2020 & 2033
- Table 82: India USA Surface Water Treatment Chemicals Industry Volume (K Tons) Forecast, by Application 2020 & 2033
- Table 83: Japan USA Surface Water Treatment Chemicals Industry Revenue (billion) Forecast, by Application 2020 & 2033
- Table 84: Japan USA Surface Water Treatment Chemicals Industry Volume (K Tons) Forecast, by Application 2020 & 2033
- Table 85: South Korea USA Surface Water Treatment Chemicals Industry Revenue (billion) Forecast, by Application 2020 & 2033
- Table 86: South Korea USA Surface Water Treatment Chemicals Industry Volume (K Tons) Forecast, by Application 2020 & 2033
- Table 87: ASEAN USA Surface Water Treatment Chemicals Industry Revenue (billion) Forecast, by Application 2020 & 2033
- Table 88: ASEAN USA Surface Water Treatment Chemicals Industry Volume (K Tons) Forecast, by Application 2020 & 2033
- Table 89: Oceania USA Surface Water Treatment Chemicals Industry Revenue (billion) Forecast, by Application 2020 & 2033
- Table 90: Oceania USA Surface Water Treatment Chemicals Industry Volume (K Tons) Forecast, by Application 2020 & 2033
- Table 91: Rest of Asia Pacific USA Surface Water Treatment Chemicals Industry Revenue (billion) Forecast, by Application 2020 & 2033
- Table 92: Rest of Asia Pacific USA Surface Water Treatment Chemicals Industry Volume (K Tons) Forecast, by Application 2020 & 2033
Frequently Asked Questions
1. What is the projected Compound Annual Growth Rate (CAGR) of the USA Surface Water Treatment Chemicals Industry?
The projected CAGR is approximately 4.2%.
2. Which companies are prominent players in the USA Surface Water Treatment Chemicals Industry?
Key companies in the market include Ecolab, Nouryon, Solvay, Kurita Water Industries Ltd, USALCO, SUEZ, Kemira, Dow, ChemTreat Inc, Solenis, Buckman Laboratories Inc, Veolia, Albemarle Corporation, Chemtrade.
3. What are the main segments of the USA Surface Water Treatment Chemicals Industry?
The market segments include Product Type, End-user Industry.
4. Can you provide details about the market size?
The market size is estimated to be USD 35.8 billion as of 2022.
5. What are some drivers contributing to market growth?
; Government Initiatives to Control Production and Disposal of wastewater; Other Drivers.
6. What are the notable trends driving market growth?
Corrosion and Scale Inhibitors to Dominate the market.
7. Are there any restraints impacting market growth?
; Impact of COVID-19 on the Industry; High Cost and Hazardous Nature.
8. Can you provide examples of recent developments in the market?
N/A
9. What pricing options are available for accessing the report?
Pricing options include single-user, multi-user, and enterprise licenses priced at USD 3,950, USD 4,950, and USD 6,950 respectively.
10. Is the market size provided in terms of value or volume?
The market size is provided in terms of value, measured in billion and volume, measured in K Tons.
11. Are there any specific market keywords associated with the report?
Yes, the market keyword associated with the report is "USA Surface Water Treatment Chemicals Industry," which aids in identifying and referencing the specific market segment covered.
12. How do I determine which pricing option suits my needs best?
The pricing options vary based on user requirements and access needs. Individual users may opt for single-user licenses, while businesses requiring broader access may choose multi-user or enterprise licenses for cost-effective access to the report.
13. Are there any additional resources or data provided in the USA Surface Water Treatment Chemicals Industry report?
While the report offers comprehensive insights, it's advisable to review the specific contents or supplementary materials provided to ascertain if additional resources or data are available.
14. How can I stay updated on further developments or reports in the USA Surface Water Treatment Chemicals Industry?
To stay informed about further developments, trends, and reports in the USA Surface Water Treatment Chemicals Industry, consider subscribing to industry newsletters, following relevant companies and organizations, or regularly checking reputable industry news sources and publications.
Methodology
Step 1 - Identification of Relevant Samples Size from Population Database


Step 2 - Approaches for Defining Global Market Size (Value, Volume* & Price*)

Note*: In applicable scenarios
Step 3 - Data Sources
Primary Research
- Web Analytics
- Survey Reports
- Research Institute
- Latest Research Reports
- Opinion Leaders
Secondary Research
- Annual Reports
- White Paper
- Latest Press Release
- Industry Association
- Paid Database
- Investor Presentations

Step 4 - Data Triangulation
Involves using different sources of information in order to increase the validity of a study
These sources are likely to be stakeholders in a program - participants, other researchers, program staff, other community members, and so on.
Then we put all data in single framework & apply various statistical tools to find out the dynamic on the market.
During the analysis stage, feedback from the stakeholder groups would be compared to determine areas of agreement as well as areas of divergence

