Emerging Market Insights in Vanilla Bean Market: 2025-2033 Overview

Vanilla Bean Market by Production Analysis, by Consumption Analysis, by Import Market Analysis (Value & Volume), by Export Market Analysis (Value & Volume), by Price Trend Analysis, by United States, by Canada, by Mexico, by Germany, by France, by Netherlands, by Japan, by Indonesia, by China, by Madagascar, by Papua New Guinea, by Uganda Forecast 2025-2033

Jun 27 2025
Base Year: 2024

180 Pages
Main Logo

Emerging Market Insights in Vanilla Bean Market: 2025-2033 Overview


Home
Industries
Agriculture
sponsor image

Tailored for you

  • In-depth Analysis Tailored to Specified Regions or Segments
  • Company Profiles Customized to User Preferences
  • Comprehensive Insights Focused on Specific Segments or Regions
  • Customized Evaluation of Competitive Landscape to Meet Your Needs
  • Tailored Customization to Address Other Specific Requirements
Ask for customization


Key Insights

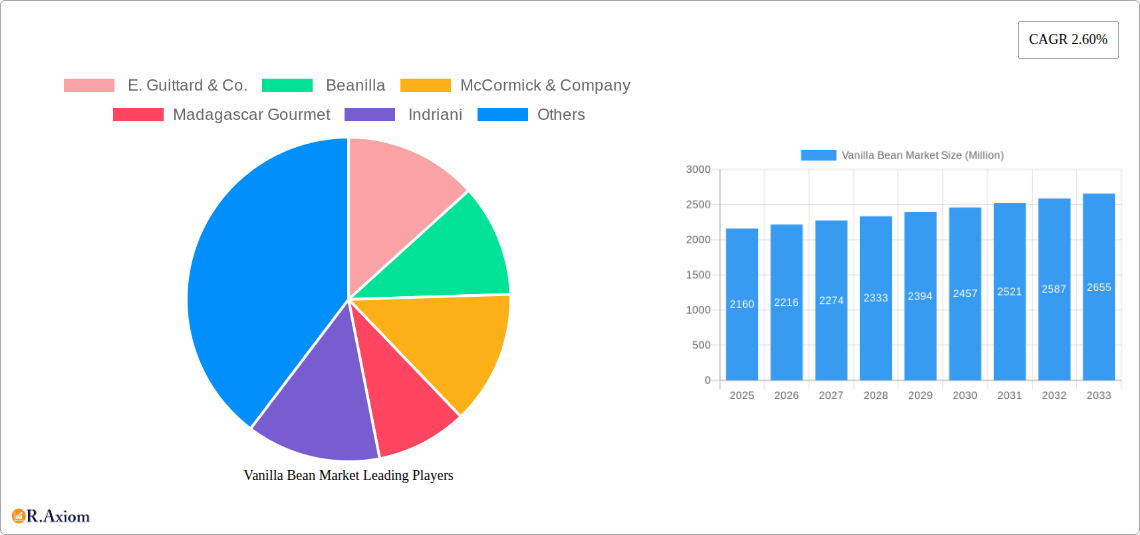
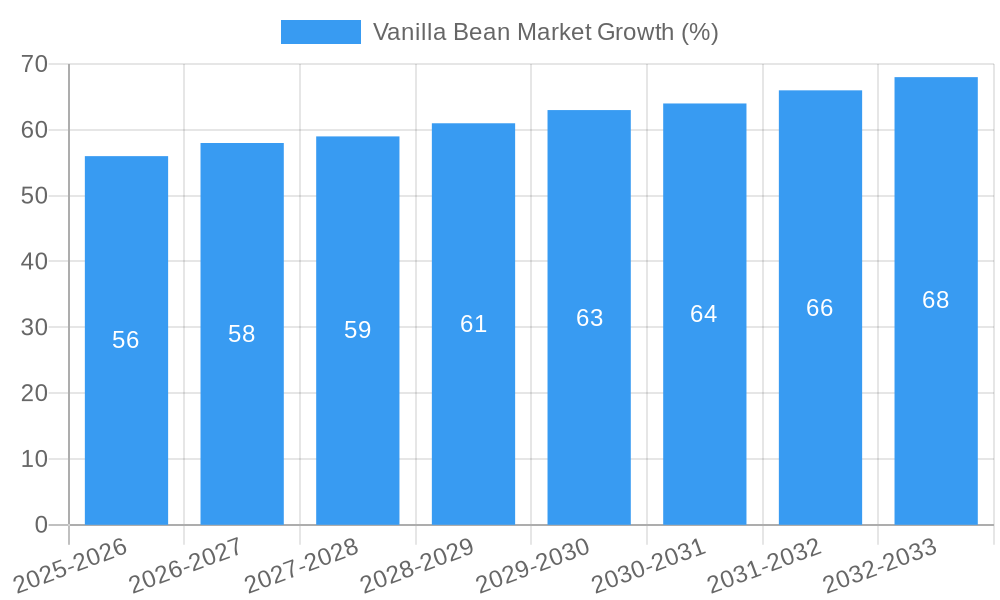
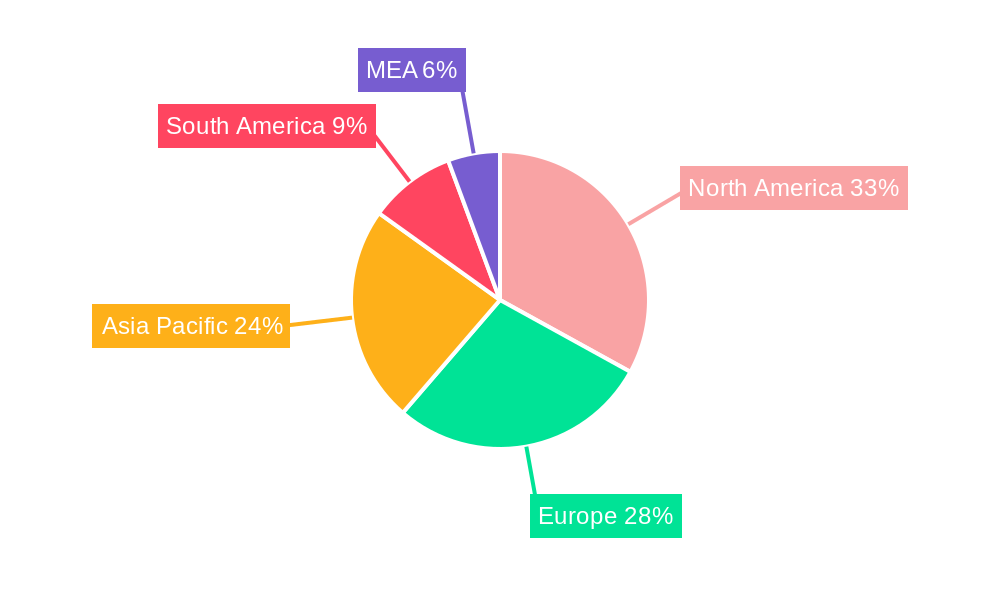
The global vanilla bean market, valued at $2.16 billion in 2025, is projected to experience steady growth, driven by increasing consumer demand for natural flavors and ingredients in food and beverages. The market's Compound Annual Growth Rate (CAGR) of 2.60% from 2025 to 2033 indicates a consistent expansion, fueled by rising disposable incomes, particularly in developing economies, and the growing popularity of gourmet foods and artisanal products. Key drivers include the rising demand for organic vanilla products, reflecting a broader consumer trend towards health and wellness, and the increasing use of vanilla in cosmetics and pharmaceuticals, which are expanding application areas. The market segmentation reveals strong growth potential in various product types, with vanilla extract maintaining a significant share due to its versatility and widespread use. Organic vanilla is gaining traction, driven by health-conscious consumers and premium pricing. The food and beverage industry remains the dominant end-user segment, although the cosmetics and pharmaceutical sectors offer promising growth opportunities. Geographic analysis reveals significant market presence in North America and Europe, but the Asia-Pacific region, particularly countries like India and China, holds considerable untapped potential, providing opportunities for market expansion in the coming years. Competition within the market is moderate, with major players like McCormick & Company and Nielsen-Massey Vanillas leading the market. However, the emergence of smaller, specialized companies focusing on organic and sustainably sourced vanilla is shaping market dynamics.

The competitive landscape is expected to remain dynamic, with existing players focusing on product innovation, expanding distribution channels, and developing sustainable sourcing practices. The increasing demand for traceability and transparency in the supply chain will also play a significant role. Potential restraints include price volatility associated with vanilla bean production, which is often affected by weather patterns and supply chain challenges. However, the long-term outlook remains positive, with the market poised for continued growth, driven by evolving consumer preferences, product diversification, and the expansion of applications across various industries. The market will likely witness increased focus on premiumization, with high-quality, ethically sourced vanilla commanding higher prices.

Vanilla Bean Market Research Report - Market Size, Growth & Forecast

Vanilla Bean Market: A Comprehensive Market Report (2019-2033)

This comprehensive report provides a detailed analysis of the global vanilla bean market, offering actionable insights for industry stakeholders, investors, and businesses operating within this dynamic sector. The report covers the period 2019-2033, with a focus on the forecast period 2025-2033, utilizing 2025 as the base year. The report projects a market size of xx Million by 2033, showcasing significant growth opportunities.

Vanilla Bean Market Concentration & Innovation

This section analyzes the competitive landscape of the vanilla bean market, encompassing market concentration, innovation drivers, regulatory influences, substitute products, end-user trends, and mergers and acquisitions (M&A) activities.

The market exhibits a moderately concentrated structure, with key players like McCormick & Company, Nielsen-Massey Vanillas, and E. Guittard & Co. holding significant market share. However, smaller niche players like VanillaVida are also driving innovation through technological advancements.

  • Market Share: McCormick & Company holds an estimated xx% market share, followed by Nielsen-Massey Vanillas at xx% and E. Guittard & Co. at xx%. Smaller players collectively account for the remaining xx%.
  • Innovation Drivers: Growing consumer demand for natural and organic products, coupled with advancements in flavor extraction and processing technologies, are primary innovation drivers. The use of image processing technology, as seen in VanillaVida's approach, is revolutionizing vanilla bean production.
  • Regulatory Framework: Regulations concerning organic certification and food safety standards significantly influence market dynamics. Compliance with these regulations is crucial for market entry and sustained growth.
  • Product Substitutes: Artificial vanilla flavorings pose a competitive threat; however, the increasing preference for natural ingredients is bolstering the demand for genuine vanilla beans.
  • M&A Activity: The vanilla bean market has witnessed a moderate level of M&A activity in recent years, with deal values averaging xx Million. These activities are driven by the consolidation of market share and access to new technologies or distribution channels.

Vanilla Bean Market Industry Trends & Insights

This section explores key market dynamics, including growth drivers, technological disruptions, consumer preferences, and competitive pressures. The global vanilla bean market is experiencing robust growth, driven by increasing consumer demand for natural flavors and the expanding use of vanilla in diverse applications.

The compound annual growth rate (CAGR) during the forecast period (2025-2033) is projected to be xx%, indicating significant market expansion. Market penetration is particularly high in the food and beverage industry, with vanilla extract being the most dominant product type. However, growth is also observed in other applications such as cosmetics and pharmaceuticals. Technological advancements, like VanillaVida's image-processing techniques for enhanced flavor profiles, are disrupting traditional vanilla production methods. Consumer preferences are shifting towards organic and sustainably sourced vanilla beans, further shaping market trends. Competitive dynamics are marked by a mix of established players and innovative start-ups vying for market share.

Vanilla Bean Market Growth

Dominant Markets & Segments in Vanilla Bean Market

The North American region currently dominates the vanilla bean market, followed by Europe. Within these regions, the food and beverage industry is the largest end-user segment, followed by the fragrance and flavor industries. The vanilla extract segment currently holds the highest market share amongst product types.

Key Drivers:

  • North America: High disposable income, strong consumer preference for natural flavors, and established food and beverage industries.
  • Europe: Increasing demand for gourmet food products and the growing popularity of artisanal confectionery.
  • Asia-Pacific: Rising middle class and increasing consumption of processed foods drive market growth.

Dominance Analysis: North America's dominance stems from high consumption of vanilla-flavored products and the presence of major players in the food and beverage industry. The vanilla extract segment's dominance is attributed to its versatility and cost-effectiveness compared to whole vanilla beans.

Vanilla Bean Market Product Developments

Recent product innovations focus on enhanced flavor profiles, convenient packaging formats (such as Nielsen-Massey’s 2-oz. vanilla bean paste), and sustainable sourcing. Technological advancements in extraction and processing methods are enhancing the quality and consistency of vanilla products, meeting the growing demand for premium, high-quality vanilla. The market is witnessing the introduction of novel products, such as vanilla powders and pastes, offering convenience to food manufacturers and consumers alike. This caters to the growing demand for ready-to-use vanilla solutions.

Report Scope & Segmentation Analysis

This report segments the vanilla bean market by product type (whole vanilla beans, vanilla extract, vanilla paste, vanilla powder), form (organic, conventional), application (food industry, cosmetics, pharmaceuticals), and end-user (food & beverage manufacturers, fragrance and flavor companies, pharmaceutical companies).

  • Product Type: Growth projections vary across product types, with vanilla extract currently dominating the market. However, whole vanilla beans are expected to see increased demand due to the growing preference for natural ingredients.
  • Form: The organic segment is experiencing significant growth due to increasing consumer preference for natural and sustainable products. Conventional vanilla beans still hold a substantial market share, driven by price sensitivity.
  • Application: The food industry remains the dominant application segment, followed by the fragrance and flavor industry. The pharmaceutical sector is also a growing application for vanilla beans and extracts, with expansion driven by the potential for bioactive compounds.
  • End-User: Food & beverage manufacturers constitute the largest end-user segment. Fragrance and flavor companies and pharmaceutical companies contribute significantly to market demand.

Key Drivers of Vanilla Bean Market Growth

Key growth drivers include rising consumer demand for natural and organic products, increasing application in various industries (food, cosmetics, pharmaceuticals), and technological advancements in cultivation and extraction techniques. Favorable economic conditions in major consuming regions further stimulate market expansion. Government regulations promoting organic farming practices also contribute to market growth.

Challenges in the Vanilla Bean Market Sector

Challenges include volatile vanilla bean prices due to weather-dependent harvests, supply chain disruptions impacting availability, and intense competition from artificial vanilla flavorings. Sustainability concerns regarding vanilla bean cultivation practices also pose a challenge, impacting ethical sourcing and environmental footprint. These factors, taken together, could potentially impact production volumes or lead to price fluctuations.

Emerging Opportunities in Vanilla Bean Market

Emerging opportunities include expanding into new markets with high growth potential (particularly in developing economies), utilizing innovative cultivation and processing technologies to enhance quality and efficiency, and leveraging sustainability initiatives to attract environmentally conscious consumers. Focus on product diversification and value-added products can also drive market growth.

Leading Players in the Vanilla Bean Market Market

  • McCormick & Company
  • E. Guittard & Co.
  • Beanilla
  • Madagascar Gourmet
  • Indriani
  • VanillaVida
  • Nielsen-Massey Vanillas

Key Developments in Vanilla Bean Market Industry

  • June 2022: Madagascar's vanilla cultivation sector, encompassing 25,000 hectares and 80,000 farmers, highlights the country's central role in global vanilla supply, with the Sava region producing high-quality beans primarily used in consumer products like chocolates and ice cream.
  • September 2022: VanillaVida’s introduction of image processing technology and non-GMO methods to enhance vanilla bean flavor profiles signifies a technological leap in vanilla production, improving both flavor and consistency.
  • January 2020: Nielsen-Massey Vanillas’ launch of 2-oz. bottles of Madagascar Bourbon Pure Vanilla Bean Paste expands product offerings and caters to consumer preferences for convenient packaging.

Strategic Outlook for Vanilla Bean Market Market

The vanilla bean market is poised for continued growth, driven by sustained consumer demand for natural flavors, expanding applications across various industries, and technological innovations enhancing production efficiency. Strategic investments in sustainable cultivation practices and product diversification will be crucial for sustained success within this dynamic market. The market's future potential lies in leveraging innovative technologies, expanding into new geographic markets, and meeting the growing consumer preference for high-quality, ethically sourced vanilla products.

Vanilla Bean Market Segmentation

  • 1. Production Analysis
  • 2. Consumption Analysis
  • 3. Import Market Analysis (Value & Volume)
  • 4. Export Market Analysis (Value & Volume)
  • 5. Price Trend Analysis

Vanilla Bean Market Segmentation By Geography

  • 1. United States
  • 2. Canada
  • 3. Mexico
  • 4. Germany
  • 5. France
  • 6. Netherlands
  • 7. Japan
  • 8. Indonesia
  • 9. China
  • 10. Madagascar
  • 11. Papua New Guinea
  • 12. Uganda
Vanilla Bean Market Regional Share


Vanilla Bean Market REPORT HIGHLIGHTS

AspectsDetails
Study Period 2019-2033
Base Year 2024
Estimated Year 2025
Forecast Period2025-2033
Historical Period2019-2024
Growth RateCAGR of 2.60% from 2019-2033
Segmentation
    • By Production Analysis
    • By Consumption Analysis
    • By Import Market Analysis (Value & Volume)
    • By Export Market Analysis (Value & Volume)
    • By Price Trend Analysis
  • By Geography
    • United States
    • Canada
    • Mexico
    • Germany
    • France
    • Netherlands
    • Japan
    • Indonesia
    • China
    • Madagascar
    • Papua New Guinea
    • Uganda


Table of Contents

  1. 1. Introduction
    • 1.1. Research Scope
    • 1.2. Market Segmentation
    • 1.3. Research Methodology
    • 1.4. Definitions and Assumptions
  2. 2. Executive Summary
    • 2.1. Introduction
  3. 3. Market Dynamics
    • 3.1. Introduction
      • 3.2. Market Drivers
        • 3.2.1. ; Awareness About Health Benefits Associated With Pecan Consumption; Wide Application of Pecan
      • 3.3. Market Restrains
        • 3.3.1. ; Volatility in the Prices; Adverse Weather Conditions Affecting Yield
      • 3.4. Market Trends
        • 3.4.1. Application in Food and Pharmaceutical Industry is Driving the Market
  4. 4. Market Factor Analysis
    • 4.1. Porters Five Forces
    • 4.2. Supply/Value Chain
    • 4.3. PESTEL analysis
    • 4.4. Market Entropy
    • 4.5. Patent/Trademark Analysis
  5. 5. Global Vanilla Bean Market Analysis, Insights and Forecast, 2019-2031
    • 5.1. Market Analysis, Insights and Forecast - by Production Analysis
      • 5.2. Market Analysis, Insights and Forecast - by Consumption Analysis
        • 5.3. Market Analysis, Insights and Forecast - by Import Market Analysis (Value & Volume)
          • 5.4. Market Analysis, Insights and Forecast - by Export Market Analysis (Value & Volume)
            • 5.5. Market Analysis, Insights and Forecast - by Price Trend Analysis
              • 5.6. Market Analysis, Insights and Forecast - by Region
                • 5.6.1. United States
                • 5.6.2. Canada
                • 5.6.3. Mexico
                • 5.6.4. Germany
                • 5.6.5. France
                • 5.6.6. Netherlands
                • 5.6.7. Japan
                • 5.6.8. Indonesia
                • 5.6.9. China
                • 5.6.10. Madagascar
                • 5.6.11. Papua New Guinea
                • 5.6.12. Uganda
            • 6. United States Vanilla Bean Market Analysis, Insights and Forecast, 2019-2031
              • 6.1. Market Analysis, Insights and Forecast - by Production Analysis
                • 6.2. Market Analysis, Insights and Forecast - by Consumption Analysis
                  • 6.3. Market Analysis, Insights and Forecast - by Import Market Analysis (Value & Volume)
                    • 6.4. Market Analysis, Insights and Forecast - by Export Market Analysis (Value & Volume)
                      • 6.5. Market Analysis, Insights and Forecast - by Price Trend Analysis
                      • 7. Canada Vanilla Bean Market Analysis, Insights and Forecast, 2019-2031
                        • 7.1. Market Analysis, Insights and Forecast - by Production Analysis
                          • 7.2. Market Analysis, Insights and Forecast - by Consumption Analysis
                            • 7.3. Market Analysis, Insights and Forecast - by Import Market Analysis (Value & Volume)
                              • 7.4. Market Analysis, Insights and Forecast - by Export Market Analysis (Value & Volume)
                                • 7.5. Market Analysis, Insights and Forecast - by Price Trend Analysis
                                • 8. Mexico Vanilla Bean Market Analysis, Insights and Forecast, 2019-2031
                                  • 8.1. Market Analysis, Insights and Forecast - by Production Analysis
                                    • 8.2. Market Analysis, Insights and Forecast - by Consumption Analysis
                                      • 8.3. Market Analysis, Insights and Forecast - by Import Market Analysis (Value & Volume)
                                        • 8.4. Market Analysis, Insights and Forecast - by Export Market Analysis (Value & Volume)
                                          • 8.5. Market Analysis, Insights and Forecast - by Price Trend Analysis
                                          • 9. Germany Vanilla Bean Market Analysis, Insights and Forecast, 2019-2031
                                            • 9.1. Market Analysis, Insights and Forecast - by Production Analysis
                                              • 9.2. Market Analysis, Insights and Forecast - by Consumption Analysis
                                                • 9.3. Market Analysis, Insights and Forecast - by Import Market Analysis (Value & Volume)
                                                  • 9.4. Market Analysis, Insights and Forecast - by Export Market Analysis (Value & Volume)
                                                    • 9.5. Market Analysis, Insights and Forecast - by Price Trend Analysis
                                                    • 10. France Vanilla Bean Market Analysis, Insights and Forecast, 2019-2031
                                                      • 10.1. Market Analysis, Insights and Forecast - by Production Analysis
                                                        • 10.2. Market Analysis, Insights and Forecast - by Consumption Analysis
                                                          • 10.3. Market Analysis, Insights and Forecast - by Import Market Analysis (Value & Volume)
                                                            • 10.4. Market Analysis, Insights and Forecast - by Export Market Analysis (Value & Volume)
                                                              • 10.5. Market Analysis, Insights and Forecast - by Price Trend Analysis
                                                              • 11. Netherlands Vanilla Bean Market Analysis, Insights and Forecast, 2019-2031
                                                                • 11.1. Market Analysis, Insights and Forecast - by Production Analysis
                                                                  • 11.2. Market Analysis, Insights and Forecast - by Consumption Analysis
                                                                    • 11.3. Market Analysis, Insights and Forecast - by Import Market Analysis (Value & Volume)
                                                                      • 11.4. Market Analysis, Insights and Forecast - by Export Market Analysis (Value & Volume)
                                                                        • 11.5. Market Analysis, Insights and Forecast - by Price Trend Analysis
                                                                        • 12. Japan Vanilla Bean Market Analysis, Insights and Forecast, 2019-2031
                                                                          • 12.1. Market Analysis, Insights and Forecast - by Production Analysis
                                                                            • 12.2. Market Analysis, Insights and Forecast - by Consumption Analysis
                                                                              • 12.3. Market Analysis, Insights and Forecast - by Import Market Analysis (Value & Volume)
                                                                                • 12.4. Market Analysis, Insights and Forecast - by Export Market Analysis (Value & Volume)
                                                                                  • 12.5. Market Analysis, Insights and Forecast - by Price Trend Analysis
                                                                                  • 13. Indonesia Vanilla Bean Market Analysis, Insights and Forecast, 2019-2031
                                                                                    • 13.1. Market Analysis, Insights and Forecast - by Production Analysis
                                                                                      • 13.2. Market Analysis, Insights and Forecast - by Consumption Analysis
                                                                                        • 13.3. Market Analysis, Insights and Forecast - by Import Market Analysis (Value & Volume)
                                                                                          • 13.4. Market Analysis, Insights and Forecast - by Export Market Analysis (Value & Volume)
                                                                                            • 13.5. Market Analysis, Insights and Forecast - by Price Trend Analysis
                                                                                            • 14. China Vanilla Bean Market Analysis, Insights and Forecast, 2019-2031
                                                                                              • 14.1. Market Analysis, Insights and Forecast - by Production Analysis
                                                                                                • 14.2. Market Analysis, Insights and Forecast - by Consumption Analysis
                                                                                                  • 14.3. Market Analysis, Insights and Forecast - by Import Market Analysis (Value & Volume)
                                                                                                    • 14.4. Market Analysis, Insights and Forecast - by Export Market Analysis (Value & Volume)
                                                                                                      • 14.5. Market Analysis, Insights and Forecast - by Price Trend Analysis
                                                                                                      • 15. Madagascar Vanilla Bean Market Analysis, Insights and Forecast, 2019-2031
                                                                                                        • 15.1. Market Analysis, Insights and Forecast - by Production Analysis
                                                                                                          • 15.2. Market Analysis, Insights and Forecast - by Consumption Analysis
                                                                                                            • 15.3. Market Analysis, Insights and Forecast - by Import Market Analysis (Value & Volume)
                                                                                                              • 15.4. Market Analysis, Insights and Forecast - by Export Market Analysis (Value & Volume)
                                                                                                                • 15.5. Market Analysis, Insights and Forecast - by Price Trend Analysis
                                                                                                                • 16. Papua New Guinea Vanilla Bean Market Analysis, Insights and Forecast, 2019-2031
                                                                                                                  • 16.1. Market Analysis, Insights and Forecast - by Production Analysis
                                                                                                                    • 16.2. Market Analysis, Insights and Forecast - by Consumption Analysis
                                                                                                                      • 16.3. Market Analysis, Insights and Forecast - by Import Market Analysis (Value & Volume)
                                                                                                                        • 16.4. Market Analysis, Insights and Forecast - by Export Market Analysis (Value & Volume)
                                                                                                                          • 16.5. Market Analysis, Insights and Forecast - by Price Trend Analysis
                                                                                                                          • 17. Uganda Vanilla Bean Market Analysis, Insights and Forecast, 2019-2031
                                                                                                                            • 17.1. Market Analysis, Insights and Forecast - by Production Analysis
                                                                                                                              • 17.2. Market Analysis, Insights and Forecast - by Consumption Analysis
                                                                                                                                • 17.3. Market Analysis, Insights and Forecast - by Import Market Analysis (Value & Volume)
                                                                                                                                  • 17.4. Market Analysis, Insights and Forecast - by Export Market Analysis (Value & Volume)
                                                                                                                                    • 17.5. Market Analysis, Insights and Forecast - by Price Trend Analysis
                                                                                                                                    • 18. South America Vanilla Bean Market Analysis, Insights and Forecast, 2019-2031
                                                                                                                                        • 18.1. Market Analysis, Insights and Forecast - By Country/Sub-region
                                                                                                                                          • 18.1.1 Brazil
                                                                                                                                          • 18.1.2 Argentina
                                                                                                                                          • 18.1.3 Rest of South America
                                                                                                                                    • 19. North America Vanilla Bean Market Analysis, Insights and Forecast, 2019-2031
                                                                                                                                        • 19.1. Market Analysis, Insights and Forecast - By Country/Sub-region
                                                                                                                                          • 19.1.1 United States
                                                                                                                                          • 19.1.2 Canada
                                                                                                                                          • 19.1.3 Mexico
                                                                                                                                    • 20. Asia Pacific Vanilla Bean Market Analysis, Insights and Forecast, 2019-2031
                                                                                                                                        • 20.1. Market Analysis, Insights and Forecast - By Country/Sub-region
                                                                                                                                          • 20.1.1 China
                                                                                                                                          • 20.1.2 Japan
                                                                                                                                          • 20.1.3 India
                                                                                                                                          • 20.1.4 South Korea
                                                                                                                                          • 20.1.5 Taiwan
                                                                                                                                          • 20.1.6 Australia
                                                                                                                                          • 20.1.7 Rest of Asia-Pacific
                                                                                                                                    • 21. Europe Vanilla Bean Market Analysis, Insights and Forecast, 2019-2031
                                                                                                                                        • 21.1. Market Analysis, Insights and Forecast - By Country/Sub-region
                                                                                                                                          • 21.1.1 Germany
                                                                                                                                          • 21.1.2 France
                                                                                                                                          • 21.1.3 Italy
                                                                                                                                          • 21.1.4 United Kingdom
                                                                                                                                          • 21.1.5 Netherlands
                                                                                                                                          • 21.1.6 Rest of Europe
                                                                                                                                    • 22. MEA Vanilla Bean Market Analysis, Insights and Forecast, 2019-2031
                                                                                                                                        • 22.1. Market Analysis, Insights and Forecast - By Country/Sub-region
                                                                                                                                          • 22.1.1 Middle East
                                                                                                                                          • 22.1.2 Africa
                                                                                                                                    • 23. Competitive Analysis
                                                                                                                                      • 23.1. Global Market Share Analysis 2024
                                                                                                                                        • 23.2. Company Profiles
                                                                                                                                          • 23.2.1 E. Guittard & Co.
                                                                                                                                            • 23.2.1.1. Overview
                                                                                                                                            • 23.2.1.2. Products
                                                                                                                                            • 23.2.1.3. SWOT Analysis
                                                                                                                                            • 23.2.1.4. Recent Developments
                                                                                                                                            • 23.2.1.5. Financials (Based on Availability)
                                                                                                                                          • 23.2.2 Beanilla
                                                                                                                                            • 23.2.2.1. Overview
                                                                                                                                            • 23.2.2.2. Products
                                                                                                                                            • 23.2.2.3. SWOT Analysis
                                                                                                                                            • 23.2.2.4. Recent Developments
                                                                                                                                            • 23.2.2.5. Financials (Based on Availability)
                                                                                                                                          • 23.2.3 McCormick & Company
                                                                                                                                            • 23.2.3.1. Overview
                                                                                                                                            • 23.2.3.2. Products
                                                                                                                                            • 23.2.3.3. SWOT Analysis
                                                                                                                                            • 23.2.3.4. Recent Developments
                                                                                                                                            • 23.2.3.5. Financials (Based on Availability)
                                                                                                                                          • 23.2.4 Madagascar Gourmet
                                                                                                                                            • 23.2.4.1. Overview
                                                                                                                                            • 23.2.4.2. Products
                                                                                                                                            • 23.2.4.3. SWOT Analysis
                                                                                                                                            • 23.2.4.4. Recent Developments
                                                                                                                                            • 23.2.4.5. Financials (Based on Availability)
                                                                                                                                          • 23.2.5 Indriani
                                                                                                                                            • 23.2.5.1. Overview
                                                                                                                                            • 23.2.5.2. Products
                                                                                                                                            • 23.2.5.3. SWOT Analysis
                                                                                                                                            • 23.2.5.4. Recent Developments
                                                                                                                                            • 23.2.5.5. Financials (Based on Availability)
                                                                                                                                          • 23.2.6 VanillaVida
                                                                                                                                            • 23.2.6.1. Overview
                                                                                                                                            • 23.2.6.2. Products
                                                                                                                                            • 23.2.6.3. SWOT Analysis
                                                                                                                                            • 23.2.6.4. Recent Developments
                                                                                                                                            • 23.2.6.5. Financials (Based on Availability)
                                                                                                                                          • 23.2.7 Nielsen-Massey Vanillas
                                                                                                                                            • 23.2.7.1. Overview
                                                                                                                                            • 23.2.7.2. Products
                                                                                                                                            • 23.2.7.3. SWOT Analysis
                                                                                                                                            • 23.2.7.4. Recent Developments
                                                                                                                                            • 23.2.7.5. Financials (Based on Availability)

                                                                                                                                    List of Figures

                                                                                                                                    1. Figure 1: Global Vanilla Bean Market Revenue Breakdown (Million, %) by Region 2024 & 2032
                                                                                                                                    2. Figure 2: Global Vanilla Bean Market Volume Breakdown (Kiloton, %) by Region 2024 & 2032
                                                                                                                                    3. Figure 3: South America Vanilla Bean Market Revenue (Million), by Country 2024 & 2032
                                                                                                                                    4. Figure 4: South America Vanilla Bean Market Volume (Kiloton), by Country 2024 & 2032
                                                                                                                                    5. Figure 5: South America Vanilla Bean Market Revenue Share (%), by Country 2024 & 2032
                                                                                                                                    6. Figure 6: South America Vanilla Bean Market Volume Share (%), by Country 2024 & 2032
                                                                                                                                    7. Figure 7: North America Vanilla Bean Market Revenue (Million), by Country 2024 & 2032
                                                                                                                                    8. Figure 8: North America Vanilla Bean Market Volume (Kiloton), by Country 2024 & 2032
                                                                                                                                    9. Figure 9: North America Vanilla Bean Market Revenue Share (%), by Country 2024 & 2032
                                                                                                                                    10. Figure 10: North America Vanilla Bean Market Volume Share (%), by Country 2024 & 2032
                                                                                                                                    11. Figure 11: Asia Pacific Vanilla Bean Market Revenue (Million), by Country 2024 & 2032
                                                                                                                                    12. Figure 12: Asia Pacific Vanilla Bean Market Volume (Kiloton), by Country 2024 & 2032
                                                                                                                                    13. Figure 13: Asia Pacific Vanilla Bean Market Revenue Share (%), by Country 2024 & 2032
                                                                                                                                    14. Figure 14: Asia Pacific Vanilla Bean Market Volume Share (%), by Country 2024 & 2032
                                                                                                                                    15. Figure 15: Europe Vanilla Bean Market Revenue (Million), by Country 2024 & 2032
                                                                                                                                    16. Figure 16: Europe Vanilla Bean Market Volume (Kiloton), by Country 2024 & 2032
                                                                                                                                    17. Figure 17: Europe Vanilla Bean Market Revenue Share (%), by Country 2024 & 2032
                                                                                                                                    18. Figure 18: Europe Vanilla Bean Market Volume Share (%), by Country 2024 & 2032
                                                                                                                                    19. Figure 19: MEA Vanilla Bean Market Revenue (Million), by Country 2024 & 2032
                                                                                                                                    20. Figure 20: MEA Vanilla Bean Market Volume (Kiloton), by Country 2024 & 2032
                                                                                                                                    21. Figure 21: MEA Vanilla Bean Market Revenue Share (%), by Country 2024 & 2032
                                                                                                                                    22. Figure 22: MEA Vanilla Bean Market Volume Share (%), by Country 2024 & 2032
                                                                                                                                    23. Figure 23: United States Vanilla Bean Market Revenue (Million), by Production Analysis 2024 & 2032
                                                                                                                                    24. Figure 24: United States Vanilla Bean Market Volume (Kiloton), by Production Analysis 2024 & 2032
                                                                                                                                    25. Figure 25: United States Vanilla Bean Market Revenue Share (%), by Production Analysis 2024 & 2032
                                                                                                                                    26. Figure 26: United States Vanilla Bean Market Volume Share (%), by Production Analysis 2024 & 2032
                                                                                                                                    27. Figure 27: United States Vanilla Bean Market Revenue (Million), by Consumption Analysis 2024 & 2032
                                                                                                                                    28. Figure 28: United States Vanilla Bean Market Volume (Kiloton), by Consumption Analysis 2024 & 2032
                                                                                                                                    29. Figure 29: United States Vanilla Bean Market Revenue Share (%), by Consumption Analysis 2024 & 2032
                                                                                                                                    30. Figure 30: United States Vanilla Bean Market Volume Share (%), by Consumption Analysis 2024 & 2032
                                                                                                                                    31. Figure 31: United States Vanilla Bean Market Revenue (Million), by Import Market Analysis (Value & Volume) 2024 & 2032
                                                                                                                                    32. Figure 32: United States Vanilla Bean Market Volume (Kiloton), by Import Market Analysis (Value & Volume) 2024 & 2032
                                                                                                                                    33. Figure 33: United States Vanilla Bean Market Revenue Share (%), by Import Market Analysis (Value & Volume) 2024 & 2032
                                                                                                                                    34. Figure 34: United States Vanilla Bean Market Volume Share (%), by Import Market Analysis (Value & Volume) 2024 & 2032
                                                                                                                                    35. Figure 35: United States Vanilla Bean Market Revenue (Million), by Export Market Analysis (Value & Volume) 2024 & 2032
                                                                                                                                    36. Figure 36: United States Vanilla Bean Market Volume (Kiloton), by Export Market Analysis (Value & Volume) 2024 & 2032
                                                                                                                                    37. Figure 37: United States Vanilla Bean Market Revenue Share (%), by Export Market Analysis (Value & Volume) 2024 & 2032
                                                                                                                                    38. Figure 38: United States Vanilla Bean Market Volume Share (%), by Export Market Analysis (Value & Volume) 2024 & 2032
                                                                                                                                    39. Figure 39: United States Vanilla Bean Market Revenue (Million), by Price Trend Analysis 2024 & 2032
                                                                                                                                    40. Figure 40: United States Vanilla Bean Market Volume (Kiloton), by Price Trend Analysis 2024 & 2032
                                                                                                                                    41. Figure 41: United States Vanilla Bean Market Revenue Share (%), by Price Trend Analysis 2024 & 2032
                                                                                                                                    42. Figure 42: United States Vanilla Bean Market Volume Share (%), by Price Trend Analysis 2024 & 2032
                                                                                                                                    43. Figure 43: United States Vanilla Bean Market Revenue (Million), by Country 2024 & 2032
                                                                                                                                    44. Figure 44: United States Vanilla Bean Market Volume (Kiloton), by Country 2024 & 2032
                                                                                                                                    45. Figure 45: United States Vanilla Bean Market Revenue Share (%), by Country 2024 & 2032
                                                                                                                                    46. Figure 46: United States Vanilla Bean Market Volume Share (%), by Country 2024 & 2032
                                                                                                                                    47. Figure 47: Canada Vanilla Bean Market Revenue (Million), by Production Analysis 2024 & 2032
                                                                                                                                    48. Figure 48: Canada Vanilla Bean Market Volume (Kiloton), by Production Analysis 2024 & 2032
                                                                                                                                    49. Figure 49: Canada Vanilla Bean Market Revenue Share (%), by Production Analysis 2024 & 2032
                                                                                                                                    50. Figure 50: Canada Vanilla Bean Market Volume Share (%), by Production Analysis 2024 & 2032
                                                                                                                                    51. Figure 51: Canada Vanilla Bean Market Revenue (Million), by Consumption Analysis 2024 & 2032
                                                                                                                                    52. Figure 52: Canada Vanilla Bean Market Volume (Kiloton), by Consumption Analysis 2024 & 2032
                                                                                                                                    53. Figure 53: Canada Vanilla Bean Market Revenue Share (%), by Consumption Analysis 2024 & 2032
                                                                                                                                    54. Figure 54: Canada Vanilla Bean Market Volume Share (%), by Consumption Analysis 2024 & 2032
                                                                                                                                    55. Figure 55: Canada Vanilla Bean Market Revenue (Million), by Import Market Analysis (Value & Volume) 2024 & 2032
                                                                                                                                    56. Figure 56: Canada Vanilla Bean Market Volume (Kiloton), by Import Market Analysis (Value & Volume) 2024 & 2032
                                                                                                                                    57. Figure 57: Canada Vanilla Bean Market Revenue Share (%), by Import Market Analysis (Value & Volume) 2024 & 2032
                                                                                                                                    58. Figure 58: Canada Vanilla Bean Market Volume Share (%), by Import Market Analysis (Value & Volume) 2024 & 2032
                                                                                                                                    59. Figure 59: Canada Vanilla Bean Market Revenue (Million), by Export Market Analysis (Value & Volume) 2024 & 2032
                                                                                                                                    60. Figure 60: Canada Vanilla Bean Market Volume (Kiloton), by Export Market Analysis (Value & Volume) 2024 & 2032
                                                                                                                                    61. Figure 61: Canada Vanilla Bean Market Revenue Share (%), by Export Market Analysis (Value & Volume) 2024 & 2032
                                                                                                                                    62. Figure 62: Canada Vanilla Bean Market Volume Share (%), by Export Market Analysis (Value & Volume) 2024 & 2032
                                                                                                                                    63. Figure 63: Canada Vanilla Bean Market Revenue (Million), by Price Trend Analysis 2024 & 2032
                                                                                                                                    64. Figure 64: Canada Vanilla Bean Market Volume (Kiloton), by Price Trend Analysis 2024 & 2032
                                                                                                                                    65. Figure 65: Canada Vanilla Bean Market Revenue Share (%), by Price Trend Analysis 2024 & 2032
                                                                                                                                    66. Figure 66: Canada Vanilla Bean Market Volume Share (%), by Price Trend Analysis 2024 & 2032
                                                                                                                                    67. Figure 67: Canada Vanilla Bean Market Revenue (Million), by Country 2024 & 2032
                                                                                                                                    68. Figure 68: Canada Vanilla Bean Market Volume (Kiloton), by Country 2024 & 2032
                                                                                                                                    69. Figure 69: Canada Vanilla Bean Market Revenue Share (%), by Country 2024 & 2032
                                                                                                                                    70. Figure 70: Canada Vanilla Bean Market Volume Share (%), by Country 2024 & 2032
                                                                                                                                    71. Figure 71: Mexico Vanilla Bean Market Revenue (Million), by Production Analysis 2024 & 2032
                                                                                                                                    72. Figure 72: Mexico Vanilla Bean Market Volume (Kiloton), by Production Analysis 2024 & 2032
                                                                                                                                    73. Figure 73: Mexico Vanilla Bean Market Revenue Share (%), by Production Analysis 2024 & 2032
                                                                                                                                    74. Figure 74: Mexico Vanilla Bean Market Volume Share (%), by Production Analysis 2024 & 2032
                                                                                                                                    75. Figure 75: Mexico Vanilla Bean Market Revenue (Million), by Consumption Analysis 2024 & 2032
                                                                                                                                    76. Figure 76: Mexico Vanilla Bean Market Volume (Kiloton), by Consumption Analysis 2024 & 2032
                                                                                                                                    77. Figure 77: Mexico Vanilla Bean Market Revenue Share (%), by Consumption Analysis 2024 & 2032
                                                                                                                                    78. Figure 78: Mexico Vanilla Bean Market Volume Share (%), by Consumption Analysis 2024 & 2032
                                                                                                                                    79. Figure 79: Mexico Vanilla Bean Market Revenue (Million), by Import Market Analysis (Value & Volume) 2024 & 2032
                                                                                                                                    80. Figure 80: Mexico Vanilla Bean Market Volume (Kiloton), by Import Market Analysis (Value & Volume) 2024 & 2032
                                                                                                                                    81. Figure 81: Mexico Vanilla Bean Market Revenue Share (%), by Import Market Analysis (Value & Volume) 2024 & 2032
                                                                                                                                    82. Figure 82: Mexico Vanilla Bean Market Volume Share (%), by Import Market Analysis (Value & Volume) 2024 & 2032
                                                                                                                                    83. Figure 83: Mexico Vanilla Bean Market Revenue (Million), by Export Market Analysis (Value & Volume) 2024 & 2032
                                                                                                                                    84. Figure 84: Mexico Vanilla Bean Market Volume (Kiloton), by Export Market Analysis (Value & Volume) 2024 & 2032
                                                                                                                                    85. Figure 85: Mexico Vanilla Bean Market Revenue Share (%), by Export Market Analysis (Value & Volume) 2024 & 2032
                                                                                                                                    86. Figure 86: Mexico Vanilla Bean Market Volume Share (%), by Export Market Analysis (Value & Volume) 2024 & 2032
                                                                                                                                    87. Figure 87: Mexico Vanilla Bean Market Revenue (Million), by Price Trend Analysis 2024 & 2032
                                                                                                                                    88. Figure 88: Mexico Vanilla Bean Market Volume (Kiloton), by Price Trend Analysis 2024 & 2032
                                                                                                                                    89. Figure 89: Mexico Vanilla Bean Market Revenue Share (%), by Price Trend Analysis 2024 & 2032
                                                                                                                                    90. Figure 90: Mexico Vanilla Bean Market Volume Share (%), by Price Trend Analysis 2024 & 2032
                                                                                                                                    91. Figure 91: Mexico Vanilla Bean Market Revenue (Million), by Country 2024 & 2032
                                                                                                                                    92. Figure 92: Mexico Vanilla Bean Market Volume (Kiloton), by Country 2024 & 2032
                                                                                                                                    93. Figure 93: Mexico Vanilla Bean Market Revenue Share (%), by Country 2024 & 2032
                                                                                                                                    94. Figure 94: Mexico Vanilla Bean Market Volume Share (%), by Country 2024 & 2032
                                                                                                                                    95. Figure 95: Germany Vanilla Bean Market Revenue (Million), by Production Analysis 2024 & 2032
                                                                                                                                    96. Figure 96: Germany Vanilla Bean Market Volume (Kiloton), by Production Analysis 2024 & 2032
                                                                                                                                    97. Figure 97: Germany Vanilla Bean Market Revenue Share (%), by Production Analysis 2024 & 2032
                                                                                                                                    98. Figure 98: Germany Vanilla Bean Market Volume Share (%), by Production Analysis 2024 & 2032
                                                                                                                                    99. Figure 99: Germany Vanilla Bean Market Revenue (Million), by Consumption Analysis 2024 & 2032
                                                                                                                                    100. Figure 100: Germany Vanilla Bean Market Volume (Kiloton), by Consumption Analysis 2024 & 2032
                                                                                                                                    101. Figure 101: Germany Vanilla Bean Market Revenue Share (%), by Consumption Analysis 2024 & 2032
                                                                                                                                    102. Figure 102: Germany Vanilla Bean Market Volume Share (%), by Consumption Analysis 2024 & 2032
                                                                                                                                    103. Figure 103: Germany Vanilla Bean Market Revenue (Million), by Import Market Analysis (Value & Volume) 2024 & 2032
                                                                                                                                    104. Figure 104: Germany Vanilla Bean Market Volume (Kiloton), by Import Market Analysis (Value & Volume) 2024 & 2032
                                                                                                                                    105. Figure 105: Germany Vanilla Bean Market Revenue Share (%), by Import Market Analysis (Value & Volume) 2024 & 2032
                                                                                                                                    106. Figure 106: Germany Vanilla Bean Market Volume Share (%), by Import Market Analysis (Value & Volume) 2024 & 2032
                                                                                                                                    107. Figure 107: Germany Vanilla Bean Market Revenue (Million), by Export Market Analysis (Value & Volume) 2024 & 2032
                                                                                                                                    108. Figure 108: Germany Vanilla Bean Market Volume (Kiloton), by Export Market Analysis (Value & Volume) 2024 & 2032
                                                                                                                                    109. Figure 109: Germany Vanilla Bean Market Revenue Share (%), by Export Market Analysis (Value & Volume) 2024 & 2032
                                                                                                                                    110. Figure 110: Germany Vanilla Bean Market Volume Share (%), by Export Market Analysis (Value & Volume) 2024 & 2032
                                                                                                                                    111. Figure 111: Germany Vanilla Bean Market Revenue (Million), by Price Trend Analysis 2024 & 2032
                                                                                                                                    112. Figure 112: Germany Vanilla Bean Market Volume (Kiloton), by Price Trend Analysis 2024 & 2032
                                                                                                                                    113. Figure 113: Germany Vanilla Bean Market Revenue Share (%), by Price Trend Analysis 2024 & 2032
                                                                                                                                    114. Figure 114: Germany Vanilla Bean Market Volume Share (%), by Price Trend Analysis 2024 & 2032
                                                                                                                                    115. Figure 115: Germany Vanilla Bean Market Revenue (Million), by Country 2024 & 2032
                                                                                                                                    116. Figure 116: Germany Vanilla Bean Market Volume (Kiloton), by Country 2024 & 2032
                                                                                                                                    117. Figure 117: Germany Vanilla Bean Market Revenue Share (%), by Country 2024 & 2032
                                                                                                                                    118. Figure 118: Germany Vanilla Bean Market Volume Share (%), by Country 2024 & 2032
                                                                                                                                    119. Figure 119: France Vanilla Bean Market Revenue (Million), by Production Analysis 2024 & 2032
                                                                                                                                    120. Figure 120: France Vanilla Bean Market Volume (Kiloton), by Production Analysis 2024 & 2032
                                                                                                                                    121. Figure 121: France Vanilla Bean Market Revenue Share (%), by Production Analysis 2024 & 2032
                                                                                                                                    122. Figure 122: France Vanilla Bean Market Volume Share (%), by Production Analysis 2024 & 2032
                                                                                                                                    123. Figure 123: France Vanilla Bean Market Revenue (Million), by Consumption Analysis 2024 & 2032
                                                                                                                                    124. Figure 124: France Vanilla Bean Market Volume (Kiloton), by Consumption Analysis 2024 & 2032
                                                                                                                                    125. Figure 125: France Vanilla Bean Market Revenue Share (%), by Consumption Analysis 2024 & 2032
                                                                                                                                    126. Figure 126: France Vanilla Bean Market Volume Share (%), by Consumption Analysis 2024 & 2032
                                                                                                                                    127. Figure 127: France Vanilla Bean Market Revenue (Million), by Import Market Analysis (Value & Volume) 2024 & 2032
                                                                                                                                    128. Figure 128: France Vanilla Bean Market Volume (Kiloton), by Import Market Analysis (Value & Volume) 2024 & 2032
                                                                                                                                    129. Figure 129: France Vanilla Bean Market Revenue Share (%), by Import Market Analysis (Value & Volume) 2024 & 2032
                                                                                                                                    130. Figure 130: France Vanilla Bean Market Volume Share (%), by Import Market Analysis (Value & Volume) 2024 & 2032
                                                                                                                                    131. Figure 131: France Vanilla Bean Market Revenue (Million), by Export Market Analysis (Value & Volume) 2024 & 2032
                                                                                                                                    132. Figure 132: France Vanilla Bean Market Volume (Kiloton), by Export Market Analysis (Value & Volume) 2024 & 2032
                                                                                                                                    133. Figure 133: France Vanilla Bean Market Revenue Share (%), by Export Market Analysis (Value & Volume) 2024 & 2032
                                                                                                                                    134. Figure 134: France Vanilla Bean Market Volume Share (%), by Export Market Analysis (Value & Volume) 2024 & 2032
                                                                                                                                    135. Figure 135: France Vanilla Bean Market Revenue (Million), by Price Trend Analysis 2024 & 2032
                                                                                                                                    136. Figure 136: France Vanilla Bean Market Volume (Kiloton), by Price Trend Analysis 2024 & 2032
                                                                                                                                    137. Figure 137: France Vanilla Bean Market Revenue Share (%), by Price Trend Analysis 2024 & 2032
                                                                                                                                    138. Figure 138: France Vanilla Bean Market Volume Share (%), by Price Trend Analysis 2024 & 2032
                                                                                                                                    139. Figure 139: France Vanilla Bean Market Revenue (Million), by Country 2024 & 2032
                                                                                                                                    140. Figure 140: France Vanilla Bean Market Volume (Kiloton), by Country 2024 & 2032
                                                                                                                                    141. Figure 141: France Vanilla Bean Market Revenue Share (%), by Country 2024 & 2032
                                                                                                                                    142. Figure 142: France Vanilla Bean Market Volume Share (%), by Country 2024 & 2032
                                                                                                                                    143. Figure 143: Netherlands Vanilla Bean Market Revenue (Million), by Production Analysis 2024 & 2032
                                                                                                                                    144. Figure 144: Netherlands Vanilla Bean Market Volume (Kiloton), by Production Analysis 2024 & 2032
                                                                                                                                    145. Figure 145: Netherlands Vanilla Bean Market Revenue Share (%), by Production Analysis 2024 & 2032
                                                                                                                                    146. Figure 146: Netherlands Vanilla Bean Market Volume Share (%), by Production Analysis 2024 & 2032
                                                                                                                                    147. Figure 147: Netherlands Vanilla Bean Market Revenue (Million), by Consumption Analysis 2024 & 2032
                                                                                                                                    148. Figure 148: Netherlands Vanilla Bean Market Volume (Kiloton), by Consumption Analysis 2024 & 2032
                                                                                                                                    149. Figure 149: Netherlands Vanilla Bean Market Revenue Share (%), by Consumption Analysis 2024 & 2032
                                                                                                                                    150. Figure 150: Netherlands Vanilla Bean Market Volume Share (%), by Consumption Analysis 2024 & 2032
                                                                                                                                    151. Figure 151: Netherlands Vanilla Bean Market Revenue (Million), by Import Market Analysis (Value & Volume) 2024 & 2032
                                                                                                                                    152. Figure 152: Netherlands Vanilla Bean Market Volume (Kiloton), by Import Market Analysis (Value & Volume) 2024 & 2032
                                                                                                                                    153. Figure 153: Netherlands Vanilla Bean Market Revenue Share (%), by Import Market Analysis (Value & Volume) 2024 & 2032
                                                                                                                                    154. Figure 154: Netherlands Vanilla Bean Market Volume Share (%), by Import Market Analysis (Value & Volume) 2024 & 2032
                                                                                                                                    155. Figure 155: Netherlands Vanilla Bean Market Revenue (Million), by Export Market Analysis (Value & Volume) 2024 & 2032
                                                                                                                                    156. Figure 156: Netherlands Vanilla Bean Market Volume (Kiloton), by Export Market Analysis (Value & Volume) 2024 & 2032
                                                                                                                                    157. Figure 157: Netherlands Vanilla Bean Market Revenue Share (%), by Export Market Analysis (Value & Volume) 2024 & 2032
                                                                                                                                    158. Figure 158: Netherlands Vanilla Bean Market Volume Share (%), by Export Market Analysis (Value & Volume) 2024 & 2032
                                                                                                                                    159. Figure 159: Netherlands Vanilla Bean Market Revenue (Million), by Price Trend Analysis 2024 & 2032
                                                                                                                                    160. Figure 160: Netherlands Vanilla Bean Market Volume (Kiloton), by Price Trend Analysis 2024 & 2032
                                                                                                                                    161. Figure 161: Netherlands Vanilla Bean Market Revenue Share (%), by Price Trend Analysis 2024 & 2032
                                                                                                                                    162. Figure 162: Netherlands Vanilla Bean Market Volume Share (%), by Price Trend Analysis 2024 & 2032
                                                                                                                                    163. Figure 163: Netherlands Vanilla Bean Market Revenue (Million), by Country 2024 & 2032
                                                                                                                                    164. Figure 164: Netherlands Vanilla Bean Market Volume (Kiloton), by Country 2024 & 2032
                                                                                                                                    165. Figure 165: Netherlands Vanilla Bean Market Revenue Share (%), by Country 2024 & 2032
                                                                                                                                    166. Figure 166: Netherlands Vanilla Bean Market Volume Share (%), by Country 2024 & 2032
                                                                                                                                    167. Figure 167: Japan Vanilla Bean Market Revenue (Million), by Production Analysis 2024 & 2032
                                                                                                                                    168. Figure 168: Japan Vanilla Bean Market Volume (Kiloton), by Production Analysis 2024 & 2032
                                                                                                                                    169. Figure 169: Japan Vanilla Bean Market Revenue Share (%), by Production Analysis 2024 & 2032
                                                                                                                                    170. Figure 170: Japan Vanilla Bean Market Volume Share (%), by Production Analysis 2024 & 2032
                                                                                                                                    171. Figure 171: Japan Vanilla Bean Market Revenue (Million), by Consumption Analysis 2024 & 2032
                                                                                                                                    172. Figure 172: Japan Vanilla Bean Market Volume (Kiloton), by Consumption Analysis 2024 & 2032
                                                                                                                                    173. Figure 173: Japan Vanilla Bean Market Revenue Share (%), by Consumption Analysis 2024 & 2032
                                                                                                                                    174. Figure 174: Japan Vanilla Bean Market Volume Share (%), by Consumption Analysis 2024 & 2032
                                                                                                                                    175. Figure 175: Japan Vanilla Bean Market Revenue (Million), by Import Market Analysis (Value & Volume) 2024 & 2032
                                                                                                                                    176. Figure 176: Japan Vanilla Bean Market Volume (Kiloton), by Import Market Analysis (Value & Volume) 2024 & 2032
                                                                                                                                    177. Figure 177: Japan Vanilla Bean Market Revenue Share (%), by Import Market Analysis (Value & Volume) 2024 & 2032
                                                                                                                                    178. Figure 178: Japan Vanilla Bean Market Volume Share (%), by Import Market Analysis (Value & Volume) 2024 & 2032
                                                                                                                                    179. Figure 179: Japan Vanilla Bean Market Revenue (Million), by Export Market Analysis (Value & Volume) 2024 & 2032
                                                                                                                                    180. Figure 180: Japan Vanilla Bean Market Volume (Kiloton), by Export Market Analysis (Value & Volume) 2024 & 2032
                                                                                                                                    181. Figure 181: Japan Vanilla Bean Market Revenue Share (%), by Export Market Analysis (Value & Volume) 2024 & 2032
                                                                                                                                    182. Figure 182: Japan Vanilla Bean Market Volume Share (%), by Export Market Analysis (Value & Volume) 2024 & 2032
                                                                                                                                    183. Figure 183: Japan Vanilla Bean Market Revenue (Million), by Price Trend Analysis 2024 & 2032
                                                                                                                                    184. Figure 184: Japan Vanilla Bean Market Volume (Kiloton), by Price Trend Analysis 2024 & 2032
                                                                                                                                    185. Figure 185: Japan Vanilla Bean Market Revenue Share (%), by Price Trend Analysis 2024 & 2032
                                                                                                                                    186. Figure 186: Japan Vanilla Bean Market Volume Share (%), by Price Trend Analysis 2024 & 2032
                                                                                                                                    187. Figure 187: Japan Vanilla Bean Market Revenue (Million), by Country 2024 & 2032
                                                                                                                                    188. Figure 188: Japan Vanilla Bean Market Volume (Kiloton), by Country 2024 & 2032
                                                                                                                                    189. Figure 189: Japan Vanilla Bean Market Revenue Share (%), by Country 2024 & 2032
                                                                                                                                    190. Figure 190: Japan Vanilla Bean Market Volume Share (%), by Country 2024 & 2032
                                                                                                                                    191. Figure 191: Indonesia Vanilla Bean Market Revenue (Million), by Production Analysis 2024 & 2032
                                                                                                                                    192. Figure 192: Indonesia Vanilla Bean Market Volume (Kiloton), by Production Analysis 2024 & 2032
                                                                                                                                    193. Figure 193: Indonesia Vanilla Bean Market Revenue Share (%), by Production Analysis 2024 & 2032
                                                                                                                                    194. Figure 194: Indonesia Vanilla Bean Market Volume Share (%), by Production Analysis 2024 & 2032
                                                                                                                                    195. Figure 195: Indonesia Vanilla Bean Market Revenue (Million), by Consumption Analysis 2024 & 2032
                                                                                                                                    196. Figure 196: Indonesia Vanilla Bean Market Volume (Kiloton), by Consumption Analysis 2024 & 2032
                                                                                                                                    197. Figure 197: Indonesia Vanilla Bean Market Revenue Share (%), by Consumption Analysis 2024 & 2032
                                                                                                                                    198. Figure 198: Indonesia Vanilla Bean Market Volume Share (%), by Consumption Analysis 2024 & 2032
                                                                                                                                    199. Figure 199: Indonesia Vanilla Bean Market Revenue (Million), by Import Market Analysis (Value & Volume) 2024 & 2032
                                                                                                                                    200. Figure 200: Indonesia Vanilla Bean Market Volume (Kiloton), by Import Market Analysis (Value & Volume) 2024 & 2032
                                                                                                                                    201. Figure 201: Indonesia Vanilla Bean Market Revenue Share (%), by Import Market Analysis (Value & Volume) 2024 & 2032
                                                                                                                                    202. Figure 202: Indonesia Vanilla Bean Market Volume Share (%), by Import Market Analysis (Value & Volume) 2024 & 2032
                                                                                                                                    203. Figure 203: Indonesia Vanilla Bean Market Revenue (Million), by Export Market Analysis (Value & Volume) 2024 & 2032
                                                                                                                                    204. Figure 204: Indonesia Vanilla Bean Market Volume (Kiloton), by Export Market Analysis (Value & Volume) 2024 & 2032
                                                                                                                                    205. Figure 205: Indonesia Vanilla Bean Market Revenue Share (%), by Export Market Analysis (Value & Volume) 2024 & 2032
                                                                                                                                    206. Figure 206: Indonesia Vanilla Bean Market Volume Share (%), by Export Market Analysis (Value & Volume) 2024 & 2032
                                                                                                                                    207. Figure 207: Indonesia Vanilla Bean Market Revenue (Million), by Price Trend Analysis 2024 & 2032
                                                                                                                                    208. Figure 208: Indonesia Vanilla Bean Market Volume (Kiloton), by Price Trend Analysis 2024 & 2032
                                                                                                                                    209. Figure 209: Indonesia Vanilla Bean Market Revenue Share (%), by Price Trend Analysis 2024 & 2032
                                                                                                                                    210. Figure 210: Indonesia Vanilla Bean Market Volume Share (%), by Price Trend Analysis 2024 & 2032
                                                                                                                                    211. Figure 211: Indonesia Vanilla Bean Market Revenue (Million), by Country 2024 & 2032
                                                                                                                                    212. Figure 212: Indonesia Vanilla Bean Market Volume (Kiloton), by Country 2024 & 2032
                                                                                                                                    213. Figure 213: Indonesia Vanilla Bean Market Revenue Share (%), by Country 2024 & 2032
                                                                                                                                    214. Figure 214: Indonesia Vanilla Bean Market Volume Share (%), by Country 2024 & 2032
                                                                                                                                    215. Figure 215: China Vanilla Bean Market Revenue (Million), by Production Analysis 2024 & 2032
                                                                                                                                    216. Figure 216: China Vanilla Bean Market Volume (Kiloton), by Production Analysis 2024 & 2032
                                                                                                                                    217. Figure 217: China Vanilla Bean Market Revenue Share (%), by Production Analysis 2024 & 2032
                                                                                                                                    218. Figure 218: China Vanilla Bean Market Volume Share (%), by Production Analysis 2024 & 2032
                                                                                                                                    219. Figure 219: China Vanilla Bean Market Revenue (Million), by Consumption Analysis 2024 & 2032
                                                                                                                                    220. Figure 220: China Vanilla Bean Market Volume (Kiloton), by Consumption Analysis 2024 & 2032
                                                                                                                                    221. Figure 221: China Vanilla Bean Market Revenue Share (%), by Consumption Analysis 2024 & 2032
                                                                                                                                    222. Figure 222: China Vanilla Bean Market Volume Share (%), by Consumption Analysis 2024 & 2032
                                                                                                                                    223. Figure 223: China Vanilla Bean Market Revenue (Million), by Import Market Analysis (Value & Volume) 2024 & 2032
                                                                                                                                    224. Figure 224: China Vanilla Bean Market Volume (Kiloton), by Import Market Analysis (Value & Volume) 2024 & 2032
                                                                                                                                    225. Figure 225: China Vanilla Bean Market Revenue Share (%), by Import Market Analysis (Value & Volume) 2024 & 2032
                                                                                                                                    226. Figure 226: China Vanilla Bean Market Volume Share (%), by Import Market Analysis (Value & Volume) 2024 & 2032
                                                                                                                                    227. Figure 227: China Vanilla Bean Market Revenue (Million), by Export Market Analysis (Value & Volume) 2024 & 2032
                                                                                                                                    228. Figure 228: China Vanilla Bean Market Volume (Kiloton), by Export Market Analysis (Value & Volume) 2024 & 2032
                                                                                                                                    229. Figure 229: China Vanilla Bean Market Revenue Share (%), by Export Market Analysis (Value & Volume) 2024 & 2032
                                                                                                                                    230. Figure 230: China Vanilla Bean Market Volume Share (%), by Export Market Analysis (Value & Volume) 2024 & 2032
                                                                                                                                    231. Figure 231: China Vanilla Bean Market Revenue (Million), by Price Trend Analysis 2024 & 2032
                                                                                                                                    232. Figure 232: China Vanilla Bean Market Volume (Kiloton), by Price Trend Analysis 2024 & 2032
                                                                                                                                    233. Figure 233: China Vanilla Bean Market Revenue Share (%), by Price Trend Analysis 2024 & 2032
                                                                                                                                    234. Figure 234: China Vanilla Bean Market Volume Share (%), by Price Trend Analysis 2024 & 2032
                                                                                                                                    235. Figure 235: China Vanilla Bean Market Revenue (Million), by Country 2024 & 2032
                                                                                                                                    236. Figure 236: China Vanilla Bean Market Volume (Kiloton), by Country 2024 & 2032
                                                                                                                                    237. Figure 237: China Vanilla Bean Market Revenue Share (%), by Country 2024 & 2032
                                                                                                                                    238. Figure 238: China Vanilla Bean Market Volume Share (%), by Country 2024 & 2032
                                                                                                                                    239. Figure 239: Madagascar Vanilla Bean Market Revenue (Million), by Production Analysis 2024 & 2032
                                                                                                                                    240. Figure 240: Madagascar Vanilla Bean Market Volume (Kiloton), by Production Analysis 2024 & 2032
                                                                                                                                    241. Figure 241: Madagascar Vanilla Bean Market Revenue Share (%), by Production Analysis 2024 & 2032
                                                                                                                                    242. Figure 242: Madagascar Vanilla Bean Market Volume Share (%), by Production Analysis 2024 & 2032
                                                                                                                                    243. Figure 243: Madagascar Vanilla Bean Market Revenue (Million), by Consumption Analysis 2024 & 2032
                                                                                                                                    244. Figure 244: Madagascar Vanilla Bean Market Volume (Kiloton), by Consumption Analysis 2024 & 2032
                                                                                                                                    245. Figure 245: Madagascar Vanilla Bean Market Revenue Share (%), by Consumption Analysis 2024 & 2032
                                                                                                                                    246. Figure 246: Madagascar Vanilla Bean Market Volume Share (%), by Consumption Analysis 2024 & 2032
                                                                                                                                    247. Figure 247: Madagascar Vanilla Bean Market Revenue (Million), by Import Market Analysis (Value & Volume) 2024 & 2032
                                                                                                                                    248. Figure 248: Madagascar Vanilla Bean Market Volume (Kiloton), by Import Market Analysis (Value & Volume) 2024 & 2032
                                                                                                                                    249. Figure 249: Madagascar Vanilla Bean Market Revenue Share (%), by Import Market Analysis (Value & Volume) 2024 & 2032
                                                                                                                                    250. Figure 250: Madagascar Vanilla Bean Market Volume Share (%), by Import Market Analysis (Value & Volume) 2024 & 2032
                                                                                                                                    251. Figure 251: Madagascar Vanilla Bean Market Revenue (Million), by Export Market Analysis (Value & Volume) 2024 & 2032
                                                                                                                                    252. Figure 252: Madagascar Vanilla Bean Market Volume (Kiloton), by Export Market Analysis (Value & Volume) 2024 & 2032
                                                                                                                                    253. Figure 253: Madagascar Vanilla Bean Market Revenue Share (%), by Export Market Analysis (Value & Volume) 2024 & 2032
                                                                                                                                    254. Figure 254: Madagascar Vanilla Bean Market Volume Share (%), by Export Market Analysis (Value & Volume) 2024 & 2032
                                                                                                                                    255. Figure 255: Madagascar Vanilla Bean Market Revenue (Million), by Price Trend Analysis 2024 & 2032
                                                                                                                                    256. Figure 256: Madagascar Vanilla Bean Market Volume (Kiloton), by Price Trend Analysis 2024 & 2032
                                                                                                                                    257. Figure 257: Madagascar Vanilla Bean Market Revenue Share (%), by Price Trend Analysis 2024 & 2032
                                                                                                                                    258. Figure 258: Madagascar Vanilla Bean Market Volume Share (%), by Price Trend Analysis 2024 & 2032
                                                                                                                                    259. Figure 259: Madagascar Vanilla Bean Market Revenue (Million), by Country 2024 & 2032
                                                                                                                                    260. Figure 260: Madagascar Vanilla Bean Market Volume (Kiloton), by Country 2024 & 2032
                                                                                                                                    261. Figure 261: Madagascar Vanilla Bean Market Revenue Share (%), by Country 2024 & 2032
                                                                                                                                    262. Figure 262: Madagascar Vanilla Bean Market Volume Share (%), by Country 2024 & 2032
                                                                                                                                    263. Figure 263: Papua New Guinea Vanilla Bean Market Revenue (Million), by Production Analysis 2024 & 2032
                                                                                                                                    264. Figure 264: Papua New Guinea Vanilla Bean Market Volume (Kiloton), by Production Analysis 2024 & 2032
                                                                                                                                    265. Figure 265: Papua New Guinea Vanilla Bean Market Revenue Share (%), by Production Analysis 2024 & 2032
                                                                                                                                    266. Figure 266: Papua New Guinea Vanilla Bean Market Volume Share (%), by Production Analysis 2024 & 2032
                                                                                                                                    267. Figure 267: Papua New Guinea Vanilla Bean Market Revenue (Million), by Consumption Analysis 2024 & 2032
                                                                                                                                    268. Figure 268: Papua New Guinea Vanilla Bean Market Volume (Kiloton), by Consumption Analysis 2024 & 2032
                                                                                                                                    269. Figure 269: Papua New Guinea Vanilla Bean Market Revenue Share (%), by Consumption Analysis 2024 & 2032
                                                                                                                                    270. Figure 270: Papua New Guinea Vanilla Bean Market Volume Share (%), by Consumption Analysis 2024 & 2032
                                                                                                                                    271. Figure 271: Papua New Guinea Vanilla Bean Market Revenue (Million), by Import Market Analysis (Value & Volume) 2024 & 2032
                                                                                                                                    272. Figure 272: Papua New Guinea Vanilla Bean Market Volume (Kiloton), by Import Market Analysis (Value & Volume) 2024 & 2032
                                                                                                                                    273. Figure 273: Papua New Guinea Vanilla Bean Market Revenue Share (%), by Import Market Analysis (Value & Volume) 2024 & 2032
                                                                                                                                    274. Figure 274: Papua New Guinea Vanilla Bean Market Volume Share (%), by Import Market Analysis (Value & Volume) 2024 & 2032
                                                                                                                                    275. Figure 275: Papua New Guinea Vanilla Bean Market Revenue (Million), by Export Market Analysis (Value & Volume) 2024 & 2032
                                                                                                                                    276. Figure 276: Papua New Guinea Vanilla Bean Market Volume (Kiloton), by Export Market Analysis (Value & Volume) 2024 & 2032
                                                                                                                                    277. Figure 277: Papua New Guinea Vanilla Bean Market Revenue Share (%), by Export Market Analysis (Value & Volume) 2024 & 2032
                                                                                                                                    278. Figure 278: Papua New Guinea Vanilla Bean Market Volume Share (%), by Export Market Analysis (Value & Volume) 2024 & 2032
                                                                                                                                    279. Figure 279: Papua New Guinea Vanilla Bean Market Revenue (Million), by Price Trend Analysis 2024 & 2032
                                                                                                                                    280. Figure 280: Papua New Guinea Vanilla Bean Market Volume (Kiloton), by Price Trend Analysis 2024 & 2032
                                                                                                                                    281. Figure 281: Papua New Guinea Vanilla Bean Market Revenue Share (%), by Price Trend Analysis 2024 & 2032
                                                                                                                                    282. Figure 282: Papua New Guinea Vanilla Bean Market Volume Share (%), by Price Trend Analysis 2024 & 2032
                                                                                                                                    283. Figure 283: Papua New Guinea Vanilla Bean Market Revenue (Million), by Country 2024 & 2032
                                                                                                                                    284. Figure 284: Papua New Guinea Vanilla Bean Market Volume (Kiloton), by Country 2024 & 2032
                                                                                                                                    285. Figure 285: Papua New Guinea Vanilla Bean Market Revenue Share (%), by Country 2024 & 2032
                                                                                                                                    286. Figure 286: Papua New Guinea Vanilla Bean Market Volume Share (%), by Country 2024 & 2032
                                                                                                                                    287. Figure 287: Uganda Vanilla Bean Market Revenue (Million), by Production Analysis 2024 & 2032
                                                                                                                                    288. Figure 288: Uganda Vanilla Bean Market Volume (Kiloton), by Production Analysis 2024 & 2032
                                                                                                                                    289. Figure 289: Uganda Vanilla Bean Market Revenue Share (%), by Production Analysis 2024 & 2032
                                                                                                                                    290. Figure 290: Uganda Vanilla Bean Market Volume Share (%), by Production Analysis 2024 & 2032
                                                                                                                                    291. Figure 291: Uganda Vanilla Bean Market Revenue (Million), by Consumption Analysis 2024 & 2032
                                                                                                                                    292. Figure 292: Uganda Vanilla Bean Market Volume (Kiloton), by Consumption Analysis 2024 & 2032
                                                                                                                                    293. Figure 293: Uganda Vanilla Bean Market Revenue Share (%), by Consumption Analysis 2024 & 2032
                                                                                                                                    294. Figure 294: Uganda Vanilla Bean Market Volume Share (%), by Consumption Analysis 2024 & 2032
                                                                                                                                    295. Figure 295: Uganda Vanilla Bean Market Revenue (Million), by Import Market Analysis (Value & Volume) 2024 & 2032
                                                                                                                                    296. Figure 296: Uganda Vanilla Bean Market Volume (Kiloton), by Import Market Analysis (Value & Volume) 2024 & 2032
                                                                                                                                    297. Figure 297: Uganda Vanilla Bean Market Revenue Share (%), by Import Market Analysis (Value & Volume) 2024 & 2032
                                                                                                                                    298. Figure 298: Uganda Vanilla Bean Market Volume Share (%), by Import Market Analysis (Value & Volume) 2024 & 2032
                                                                                                                                    299. Figure 299: Uganda Vanilla Bean Market Revenue (Million), by Export Market Analysis (Value & Volume) 2024 & 2032
                                                                                                                                    300. Figure 300: Uganda Vanilla Bean Market Volume (Kiloton), by Export Market Analysis (Value & Volume) 2024 & 2032
                                                                                                                                    301. Figure 301: Uganda Vanilla Bean Market Revenue Share (%), by Export Market Analysis (Value & Volume) 2024 & 2032
                                                                                                                                    302. Figure 302: Uganda Vanilla Bean Market Volume Share (%), by Export Market Analysis (Value & Volume) 2024 & 2032
                                                                                                                                    303. Figure 303: Uganda Vanilla Bean Market Revenue (Million), by Price Trend Analysis 2024 & 2032
                                                                                                                                    304. Figure 304: Uganda Vanilla Bean Market Volume (Kiloton), by Price Trend Analysis 2024 & 2032
                                                                                                                                    305. Figure 305: Uganda Vanilla Bean Market Revenue Share (%), by Price Trend Analysis 2024 & 2032
                                                                                                                                    306. Figure 306: Uganda Vanilla Bean Market Volume Share (%), by Price Trend Analysis 2024 & 2032
                                                                                                                                    307. Figure 307: Uganda Vanilla Bean Market Revenue (Million), by Country 2024 & 2032
                                                                                                                                    308. Figure 308: Uganda Vanilla Bean Market Volume (Kiloton), by Country 2024 & 2032
                                                                                                                                    309. Figure 309: Uganda Vanilla Bean Market Revenue Share (%), by Country 2024 & 2032
                                                                                                                                    310. Figure 310: Uganda Vanilla Bean Market Volume Share (%), by Country 2024 & 2032

                                                                                                                                    List of Tables

                                                                                                                                    1. Table 1: Global Vanilla Bean Market Revenue Million Forecast, by Region 2019 & 2032
                                                                                                                                    2. Table 2: Global Vanilla Bean Market Volume Kiloton Forecast, by Region 2019 & 2032
                                                                                                                                    3. Table 3: Global Vanilla Bean Market Revenue Million Forecast, by Production Analysis 2019 & 2032
                                                                                                                                    4. Table 4: Global Vanilla Bean Market Volume Kiloton Forecast, by Production Analysis 2019 & 2032
                                                                                                                                    5. Table 5: Global Vanilla Bean Market Revenue Million Forecast, by Consumption Analysis 2019 & 2032
                                                                                                                                    6. Table 6: Global Vanilla Bean Market Volume Kiloton Forecast, by Consumption Analysis 2019 & 2032
                                                                                                                                    7. Table 7: Global Vanilla Bean Market Revenue Million Forecast, by Import Market Analysis (Value & Volume) 2019 & 2032
                                                                                                                                    8. Table 8: Global Vanilla Bean Market Volume Kiloton Forecast, by Import Market Analysis (Value & Volume) 2019 & 2032
                                                                                                                                    9. Table 9: Global Vanilla Bean Market Revenue Million Forecast, by Export Market Analysis (Value & Volume) 2019 & 2032
                                                                                                                                    10. Table 10: Global Vanilla Bean Market Volume Kiloton Forecast, by Export Market Analysis (Value & Volume) 2019 & 2032
                                                                                                                                    11. Table 11: Global Vanilla Bean Market Revenue Million Forecast, by Price Trend Analysis 2019 & 2032
                                                                                                                                    12. Table 12: Global Vanilla Bean Market Volume Kiloton Forecast, by Price Trend Analysis 2019 & 2032
                                                                                                                                    13. Table 13: Global Vanilla Bean Market Revenue Million Forecast, by Region 2019 & 2032
                                                                                                                                    14. Table 14: Global Vanilla Bean Market Volume Kiloton Forecast, by Region 2019 & 2032
                                                                                                                                    15. Table 15: Global Vanilla Bean Market Revenue Million Forecast, by Country 2019 & 2032
                                                                                                                                    16. Table 16: Global Vanilla Bean Market Volume Kiloton Forecast, by Country 2019 & 2032
                                                                                                                                    17. Table 17: Brazil Vanilla Bean Market Revenue (Million) Forecast, by Application 2019 & 2032
                                                                                                                                    18. Table 18: Brazil Vanilla Bean Market Volume (Kiloton) Forecast, by Application 2019 & 2032
                                                                                                                                    19. Table 19: Argentina Vanilla Bean Market Revenue (Million) Forecast, by Application 2019 & 2032
                                                                                                                                    20. Table 20: Argentina Vanilla Bean Market Volume (Kiloton) Forecast, by Application 2019 & 2032
                                                                                                                                    21. Table 21: Rest of South America Vanilla Bean Market Revenue (Million) Forecast, by Application 2019 & 2032
                                                                                                                                    22. Table 22: Rest of South America Vanilla Bean Market Volume (Kiloton) Forecast, by Application 2019 & 2032
                                                                                                                                    23. Table 23: Global Vanilla Bean Market Revenue Million Forecast, by Country 2019 & 2032
                                                                                                                                    24. Table 24: Global Vanilla Bean Market Volume Kiloton Forecast, by Country 2019 & 2032
                                                                                                                                    25. Table 25: United States Vanilla Bean Market Revenue (Million) Forecast, by Application 2019 & 2032
                                                                                                                                    26. Table 26: United States Vanilla Bean Market Volume (Kiloton) Forecast, by Application 2019 & 2032
                                                                                                                                    27. Table 27: Canada Vanilla Bean Market Revenue (Million) Forecast, by Application 2019 & 2032
                                                                                                                                    28. Table 28: Canada Vanilla Bean Market Volume (Kiloton) Forecast, by Application 2019 & 2032
                                                                                                                                    29. Table 29: Mexico Vanilla Bean Market Revenue (Million) Forecast, by Application 2019 & 2032
                                                                                                                                    30. Table 30: Mexico Vanilla Bean Market Volume (Kiloton) Forecast, by Application 2019 & 2032
                                                                                                                                    31. Table 31: Global Vanilla Bean Market Revenue Million Forecast, by Country 2019 & 2032
                                                                                                                                    32. Table 32: Global Vanilla Bean Market Volume Kiloton Forecast, by Country 2019 & 2032
                                                                                                                                    33. Table 33: China Vanilla Bean Market Revenue (Million) Forecast, by Application 2019 & 2032
                                                                                                                                    34. Table 34: China Vanilla Bean Market Volume (Kiloton) Forecast, by Application 2019 & 2032
                                                                                                                                    35. Table 35: Japan Vanilla Bean Market Revenue (Million) Forecast, by Application 2019 & 2032
                                                                                                                                    36. Table 36: Japan Vanilla Bean Market Volume (Kiloton) Forecast, by Application 2019 & 2032
                                                                                                                                    37. Table 37: India Vanilla Bean Market Revenue (Million) Forecast, by Application 2019 & 2032
                                                                                                                                    38. Table 38: India Vanilla Bean Market Volume (Kiloton) Forecast, by Application 2019 & 2032
                                                                                                                                    39. Table 39: South Korea Vanilla Bean Market Revenue (Million) Forecast, by Application 2019 & 2032
                                                                                                                                    40. Table 40: South Korea Vanilla Bean Market Volume (Kiloton) Forecast, by Application 2019 & 2032
                                                                                                                                    41. Table 41: Taiwan Vanilla Bean Market Revenue (Million) Forecast, by Application 2019 & 2032
                                                                                                                                    42. Table 42: Taiwan Vanilla Bean Market Volume (Kiloton) Forecast, by Application 2019 & 2032
                                                                                                                                    43. Table 43: Australia Vanilla Bean Market Revenue (Million) Forecast, by Application 2019 & 2032
                                                                                                                                    44. Table 44: Australia Vanilla Bean Market Volume (Kiloton) Forecast, by Application 2019 & 2032
                                                                                                                                    45. Table 45: Rest of Asia-Pacific Vanilla Bean Market Revenue (Million) Forecast, by Application 2019 & 2032
                                                                                                                                    46. Table 46: Rest of Asia-Pacific Vanilla Bean Market Volume (Kiloton) Forecast, by Application 2019 & 2032
                                                                                                                                    47. Table 47: Global Vanilla Bean Market Revenue Million Forecast, by Country 2019 & 2032
                                                                                                                                    48. Table 48: Global Vanilla Bean Market Volume Kiloton Forecast, by Country 2019 & 2032
                                                                                                                                    49. Table 49: Germany Vanilla Bean Market Revenue (Million) Forecast, by Application 2019 & 2032
                                                                                                                                    50. Table 50: Germany Vanilla Bean Market Volume (Kiloton) Forecast, by Application 2019 & 2032
                                                                                                                                    51. Table 51: France Vanilla Bean Market Revenue (Million) Forecast, by Application 2019 & 2032
                                                                                                                                    52. Table 52: France Vanilla Bean Market Volume (Kiloton) Forecast, by Application 2019 & 2032
                                                                                                                                    53. Table 53: Italy Vanilla Bean Market Revenue (Million) Forecast, by Application 2019 & 2032
                                                                                                                                    54. Table 54: Italy Vanilla Bean Market Volume (Kiloton) Forecast, by Application 2019 & 2032
                                                                                                                                    55. Table 55: United Kingdom Vanilla Bean Market Revenue (Million) Forecast, by Application 2019 & 2032
                                                                                                                                    56. Table 56: United Kingdom Vanilla Bean Market Volume (Kiloton) Forecast, by Application 2019 & 2032
                                                                                                                                    57. Table 57: Netherlands Vanilla Bean Market Revenue (Million) Forecast, by Application 2019 & 2032
                                                                                                                                    58. Table 58: Netherlands Vanilla Bean Market Volume (Kiloton) Forecast, by Application 2019 & 2032
                                                                                                                                    59. Table 59: Rest of Europe Vanilla Bean Market Revenue (Million) Forecast, by Application 2019 & 2032
                                                                                                                                    60. Table 60: Rest of Europe Vanilla Bean Market Volume (Kiloton) Forecast, by Application 2019 & 2032
                                                                                                                                    61. Table 61: Global Vanilla Bean Market Revenue Million Forecast, by Country 2019 & 2032
                                                                                                                                    62. Table 62: Global Vanilla Bean Market Volume Kiloton Forecast, by Country 2019 & 2032
                                                                                                                                    63. Table 63: Middle East Vanilla Bean Market Revenue (Million) Forecast, by Application 2019 & 2032
                                                                                                                                    64. Table 64: Middle East Vanilla Bean Market Volume (Kiloton) Forecast, by Application 2019 & 2032
                                                                                                                                    65. Table 65: Africa Vanilla Bean Market Revenue (Million) Forecast, by Application 2019 & 2032
                                                                                                                                    66. Table 66: Africa Vanilla Bean Market Volume (Kiloton) Forecast, by Application 2019 & 2032
                                                                                                                                    67. Table 67: Global Vanilla Bean Market Revenue Million Forecast, by Production Analysis 2019 & 2032
                                                                                                                                    68. Table 68: Global Vanilla Bean Market Volume Kiloton Forecast, by Production Analysis 2019 & 2032
                                                                                                                                    69. Table 69: Global Vanilla Bean Market Revenue Million Forecast, by Consumption Analysis 2019 & 2032
                                                                                                                                    70. Table 70: Global Vanilla Bean Market Volume Kiloton Forecast, by Consumption Analysis 2019 & 2032
                                                                                                                                    71. Table 71: Global Vanilla Bean Market Revenue Million Forecast, by Import Market Analysis (Value & Volume) 2019 & 2032
                                                                                                                                    72. Table 72: Global Vanilla Bean Market Volume Kiloton Forecast, by Import Market Analysis (Value & Volume) 2019 & 2032
                                                                                                                                    73. Table 73: Global Vanilla Bean Market Revenue Million Forecast, by Export Market Analysis (Value & Volume) 2019 & 2032
                                                                                                                                    74. Table 74: Global Vanilla Bean Market Volume Kiloton Forecast, by Export Market Analysis (Value & Volume) 2019 & 2032
                                                                                                                                    75. Table 75: Global Vanilla Bean Market Revenue Million Forecast, by Price Trend Analysis 2019 & 2032
                                                                                                                                    76. Table 76: Global Vanilla Bean Market Volume Kiloton Forecast, by Price Trend Analysis 2019 & 2032
                                                                                                                                    77. Table 77: Global Vanilla Bean Market Revenue Million Forecast, by Country 2019 & 2032
                                                                                                                                    78. Table 78: Global Vanilla Bean Market Volume Kiloton Forecast, by Country 2019 & 2032
                                                                                                                                    79. Table 79: Global Vanilla Bean Market Revenue Million Forecast, by Production Analysis 2019 & 2032
                                                                                                                                    80. Table 80: Global Vanilla Bean Market Volume Kiloton Forecast, by Production Analysis 2019 & 2032
                                                                                                                                    81. Table 81: Global Vanilla Bean Market Revenue Million Forecast, by Consumption Analysis 2019 & 2032
                                                                                                                                    82. Table 82: Global Vanilla Bean Market Volume Kiloton Forecast, by Consumption Analysis 2019 & 2032
                                                                                                                                    83. Table 83: Global Vanilla Bean Market Revenue Million Forecast, by Import Market Analysis (Value & Volume) 2019 & 2032
                                                                                                                                    84. Table 84: Global Vanilla Bean Market Volume Kiloton Forecast, by Import Market Analysis (Value & Volume) 2019 & 2032
                                                                                                                                    85. Table 85: Global Vanilla Bean Market Revenue Million Forecast, by Export Market Analysis (Value & Volume) 2019 & 2032
                                                                                                                                    86. Table 86: Global Vanilla Bean Market Volume Kiloton Forecast, by Export Market Analysis (Value & Volume) 2019 & 2032
                                                                                                                                    87. Table 87: Global Vanilla Bean Market Revenue Million Forecast, by Price Trend Analysis 2019 & 2032
                                                                                                                                    88. Table 88: Global Vanilla Bean Market Volume Kiloton Forecast, by Price Trend Analysis 2019 & 2032
                                                                                                                                    89. Table 89: Global Vanilla Bean Market Revenue Million Forecast, by Country 2019 & 2032
                                                                                                                                    90. Table 90: Global Vanilla Bean Market Volume Kiloton Forecast, by Country 2019 & 2032
                                                                                                                                    91. Table 91: Global Vanilla Bean Market Revenue Million Forecast, by Production Analysis 2019 & 2032
                                                                                                                                    92. Table 92: Global Vanilla Bean Market Volume Kiloton Forecast, by Production Analysis 2019 & 2032
                                                                                                                                    93. Table 93: Global Vanilla Bean Market Revenue Million Forecast, by Consumption Analysis 2019 & 2032
                                                                                                                                    94. Table 94: Global Vanilla Bean Market Volume Kiloton Forecast, by Consumption Analysis 2019 & 2032
                                                                                                                                    95. Table 95: Global Vanilla Bean Market Revenue Million Forecast, by Import Market Analysis (Value & Volume) 2019 & 2032
                                                                                                                                    96. Table 96: Global Vanilla Bean Market Volume Kiloton Forecast, by Import Market Analysis (Value & Volume) 2019 & 2032
                                                                                                                                    97. Table 97: Global Vanilla Bean Market Revenue Million Forecast, by Export Market Analysis (Value & Volume) 2019 & 2032
                                                                                                                                    98. Table 98: Global Vanilla Bean Market Volume Kiloton Forecast, by Export Market Analysis (Value & Volume) 2019 & 2032
                                                                                                                                    99. Table 99: Global Vanilla Bean Market Revenue Million Forecast, by Price Trend Analysis 2019 & 2032
                                                                                                                                    100. Table 100: Global Vanilla Bean Market Volume Kiloton Forecast, by Price Trend Analysis 2019 & 2032
                                                                                                                                    101. Table 101: Global Vanilla Bean Market Revenue Million Forecast, by Country 2019 & 2032
                                                                                                                                    102. Table 102: Global Vanilla Bean Market Volume Kiloton Forecast, by Country 2019 & 2032
                                                                                                                                    103. Table 103: Global Vanilla Bean Market Revenue Million Forecast, by Production Analysis 2019 & 2032
                                                                                                                                    104. Table 104: Global Vanilla Bean Market Volume Kiloton Forecast, by Production Analysis 2019 & 2032
                                                                                                                                    105. Table 105: Global Vanilla Bean Market Revenue Million Forecast, by Consumption Analysis 2019 & 2032
                                                                                                                                    106. Table 106: Global Vanilla Bean Market Volume Kiloton Forecast, by Consumption Analysis 2019 & 2032
                                                                                                                                    107. Table 107: Global Vanilla Bean Market Revenue Million Forecast, by Import Market Analysis (Value & Volume) 2019 & 2032
                                                                                                                                    108. Table 108: Global Vanilla Bean Market Volume Kiloton Forecast, by Import Market Analysis (Value & Volume) 2019 & 2032
                                                                                                                                    109. Table 109: Global Vanilla Bean Market Revenue Million Forecast, by Export Market Analysis (Value & Volume) 2019 & 2032
                                                                                                                                    110. Table 110: Global Vanilla Bean Market Volume Kiloton Forecast, by Export Market Analysis (Value & Volume) 2019 & 2032
                                                                                                                                    111. Table 111: Global Vanilla Bean Market Revenue Million Forecast, by Price Trend Analysis 2019 & 2032
                                                                                                                                    112. Table 112: Global Vanilla Bean Market Volume Kiloton Forecast, by Price Trend Analysis 2019 & 2032
                                                                                                                                    113. Table 113: Global Vanilla Bean Market Revenue Million Forecast, by Country 2019 & 2032
                                                                                                                                    114. Table 114: Global Vanilla Bean Market Volume Kiloton Forecast, by Country 2019 & 2032
                                                                                                                                    115. Table 115: Global Vanilla Bean Market Revenue Million Forecast, by Production Analysis 2019 & 2032
                                                                                                                                    116. Table 116: Global Vanilla Bean Market Volume Kiloton Forecast, by Production Analysis 2019 & 2032
                                                                                                                                    117. Table 117: Global Vanilla Bean Market Revenue Million Forecast, by Consumption Analysis 2019 & 2032
                                                                                                                                    118. Table 118: Global Vanilla Bean Market Volume Kiloton Forecast, by Consumption Analysis 2019 & 2032
                                                                                                                                    119. Table 119: Global Vanilla Bean Market Revenue Million Forecast, by Import Market Analysis (Value & Volume) 2019 & 2032
                                                                                                                                    120. Table 120: Global Vanilla Bean Market Volume Kiloton Forecast, by Import Market Analysis (Value & Volume) 2019 & 2032
                                                                                                                                    121. Table 121: Global Vanilla Bean Market Revenue Million Forecast, by Export Market Analysis (Value & Volume) 2019 & 2032
                                                                                                                                    122. Table 122: Global Vanilla Bean Market Volume Kiloton Forecast, by Export Market Analysis (Value & Volume) 2019 & 2032
                                                                                                                                    123. Table 123: Global Vanilla Bean Market Revenue Million Forecast, by Price Trend Analysis 2019 & 2032
                                                                                                                                    124. Table 124: Global Vanilla Bean Market Volume Kiloton Forecast, by Price Trend Analysis 2019 & 2032
                                                                                                                                    125. Table 125: Global Vanilla Bean Market Revenue Million Forecast, by Country 2019 & 2032
                                                                                                                                    126. Table 126: Global Vanilla Bean Market Volume Kiloton Forecast, by Country 2019 & 2032
                                                                                                                                    127. Table 127: Global Vanilla Bean Market Revenue Million Forecast, by Production Analysis 2019 & 2032
                                                                                                                                    128. Table 128: Global Vanilla Bean Market Volume Kiloton Forecast, by Production Analysis 2019 & 2032
                                                                                                                                    129. Table 129: Global Vanilla Bean Market Revenue Million Forecast, by Consumption Analysis 2019 & 2032
                                                                                                                                    130. Table 130: Global Vanilla Bean Market Volume Kiloton Forecast, by Consumption Analysis 2019 & 2032
                                                                                                                                    131. Table 131: Global Vanilla Bean Market Revenue Million Forecast, by Import Market Analysis (Value & Volume) 2019 & 2032
                                                                                                                                    132. Table 132: Global Vanilla Bean Market Volume Kiloton Forecast, by Import Market Analysis (Value & Volume) 2019 & 2032
                                                                                                                                    133. Table 133: Global Vanilla Bean Market Revenue Million Forecast, by Export Market Analysis (Value & Volume) 2019 & 2032
                                                                                                                                    134. Table 134: Global Vanilla Bean Market Volume Kiloton Forecast, by Export Market Analysis (Value & Volume) 2019 & 2032
                                                                                                                                    135. Table 135: Global Vanilla Bean Market Revenue Million Forecast, by Price Trend Analysis 2019 & 2032
                                                                                                                                    136. Table 136: Global Vanilla Bean Market Volume Kiloton Forecast, by Price Trend Analysis 2019 & 2032
                                                                                                                                    137. Table 137: Global Vanilla Bean Market Revenue Million Forecast, by Country 2019 & 2032
                                                                                                                                    138. Table 138: Global Vanilla Bean Market Volume Kiloton Forecast, by Country 2019 & 2032
                                                                                                                                    139. Table 139: Global Vanilla Bean Market Revenue Million Forecast, by Production Analysis 2019 & 2032
                                                                                                                                    140. Table 140: Global Vanilla Bean Market Volume Kiloton Forecast, by Production Analysis 2019 & 2032
                                                                                                                                    141. Table 141: Global Vanilla Bean Market Revenue Million Forecast, by Consumption Analysis 2019 & 2032
                                                                                                                                    142. Table 142: Global Vanilla Bean Market Volume Kiloton Forecast, by Consumption Analysis 2019 & 2032
                                                                                                                                    143. Table 143: Global Vanilla Bean Market Revenue Million Forecast, by Import Market Analysis (Value & Volume) 2019 & 2032
                                                                                                                                    144. Table 144: Global Vanilla Bean Market Volume Kiloton Forecast, by Import Market Analysis (Value & Volume) 2019 & 2032
                                                                                                                                    145. Table 145: Global Vanilla Bean Market Revenue Million Forecast, by Export Market Analysis (Value & Volume) 2019 & 2032
                                                                                                                                    146. Table 146: Global Vanilla Bean Market Volume Kiloton Forecast, by Export Market Analysis (Value & Volume) 2019 & 2032
                                                                                                                                    147. Table 147: Global Vanilla Bean Market Revenue Million Forecast, by Price Trend Analysis 2019 & 2032
                                                                                                                                    148. Table 148: Global Vanilla Bean Market Volume Kiloton Forecast, by Price Trend Analysis 2019 & 2032
                                                                                                                                    149. Table 149: Global Vanilla Bean Market Revenue Million Forecast, by Country 2019 & 2032
                                                                                                                                    150. Table 150: Global Vanilla Bean Market Volume Kiloton Forecast, by Country 2019 & 2032
                                                                                                                                    151. Table 151: Global Vanilla Bean Market Revenue Million Forecast, by Production Analysis 2019 & 2032
                                                                                                                                    152. Table 152: Global Vanilla Bean Market Volume Kiloton Forecast, by Production Analysis 2019 & 2032
                                                                                                                                    153. Table 153: Global Vanilla Bean Market Revenue Million Forecast, by Consumption Analysis 2019 & 2032
                                                                                                                                    154. Table 154: Global Vanilla Bean Market Volume Kiloton Forecast, by Consumption Analysis 2019 & 2032
                                                                                                                                    155. Table 155: Global Vanilla Bean Market Revenue Million Forecast, by Import Market Analysis (Value & Volume) 2019 & 2032
                                                                                                                                    156. Table 156: Global Vanilla Bean Market Volume Kiloton Forecast, by Import Market Analysis (Value & Volume) 2019 & 2032
                                                                                                                                    157. Table 157: Global Vanilla Bean Market Revenue Million Forecast, by Export Market Analysis (Value & Volume) 2019 & 2032
                                                                                                                                    158. Table 158: Global Vanilla Bean Market Volume Kiloton Forecast, by Export Market Analysis (Value & Volume) 2019 & 2032
                                                                                                                                    159. Table 159: Global Vanilla Bean Market Revenue Million Forecast, by Price Trend Analysis 2019 & 2032
                                                                                                                                    160. Table 160: Global Vanilla Bean Market Volume Kiloton Forecast, by Price Trend Analysis 2019 & 2032
                                                                                                                                    161. Table 161: Global Vanilla Bean Market Revenue Million Forecast, by Country 2019 & 2032
                                                                                                                                    162. Table 162: Global Vanilla Bean Market Volume Kiloton Forecast, by Country 2019 & 2032
                                                                                                                                    163. Table 163: Global Vanilla Bean Market Revenue Million Forecast, by Production Analysis 2019 & 2032
                                                                                                                                    164. Table 164: Global Vanilla Bean Market Volume Kiloton Forecast, by Production Analysis 2019 & 2032
                                                                                                                                    165. Table 165: Global Vanilla Bean Market Revenue Million Forecast, by Consumption Analysis 2019 & 2032
                                                                                                                                    166. Table 166: Global Vanilla Bean Market Volume Kiloton Forecast, by Consumption Analysis 2019 & 2032
                                                                                                                                    167. Table 167: Global Vanilla Bean Market Revenue Million Forecast, by Import Market Analysis (Value & Volume) 2019 & 2032
                                                                                                                                    168. Table 168: Global Vanilla Bean Market Volume Kiloton Forecast, by Import Market Analysis (Value & Volume) 2019 & 2032
                                                                                                                                    169. Table 169: Global Vanilla Bean Market Revenue Million Forecast, by Export Market Analysis (Value & Volume) 2019 & 2032
                                                                                                                                    170. Table 170: Global Vanilla Bean Market Volume Kiloton Forecast, by Export Market Analysis (Value & Volume) 2019 & 2032
                                                                                                                                    171. Table 171: Global Vanilla Bean Market Revenue Million Forecast, by Price Trend Analysis 2019 & 2032
                                                                                                                                    172. Table 172: Global Vanilla Bean Market Volume Kiloton Forecast, by Price Trend Analysis 2019 & 2032
                                                                                                                                    173. Table 173: Global Vanilla Bean Market Revenue Million Forecast, by Country 2019 & 2032
                                                                                                                                    174. Table 174: Global Vanilla Bean Market Volume Kiloton Forecast, by Country 2019 & 2032
                                                                                                                                    175. Table 175: Global Vanilla Bean Market Revenue Million Forecast, by Production Analysis 2019 & 2032
                                                                                                                                    176. Table 176: Global Vanilla Bean Market Volume Kiloton Forecast, by Production Analysis 2019 & 2032
                                                                                                                                    177. Table 177: Global Vanilla Bean Market Revenue Million Forecast, by Consumption Analysis 2019 & 2032
                                                                                                                                    178. Table 178: Global Vanilla Bean Market Volume Kiloton Forecast, by Consumption Analysis 2019 & 2032
                                                                                                                                    179. Table 179: Global Vanilla Bean Market Revenue Million Forecast, by Import Market Analysis (Value & Volume) 2019 & 2032
                                                                                                                                    180. Table 180: Global Vanilla Bean Market Volume Kiloton Forecast, by Import Market Analysis (Value & Volume) 2019 & 2032
                                                                                                                                    181. Table 181: Global Vanilla Bean Market Revenue Million Forecast, by Export Market Analysis (Value & Volume) 2019 & 2032
                                                                                                                                    182. Table 182: Global Vanilla Bean Market Volume Kiloton Forecast, by Export Market Analysis (Value & Volume) 2019 & 2032
                                                                                                                                    183. Table 183: Global Vanilla Bean Market Revenue Million Forecast, by Price Trend Analysis 2019 & 2032
                                                                                                                                    184. Table 184: Global Vanilla Bean Market Volume Kiloton Forecast, by Price Trend Analysis 2019 & 2032
                                                                                                                                    185. Table 185: Global Vanilla Bean Market Revenue Million Forecast, by Country 2019 & 2032
                                                                                                                                    186. Table 186: Global Vanilla Bean Market Volume Kiloton Forecast, by Country 2019 & 2032
                                                                                                                                    187. Table 187: Global Vanilla Bean Market Revenue Million Forecast, by Production Analysis 2019 & 2032
                                                                                                                                    188. Table 188: Global Vanilla Bean Market Volume Kiloton Forecast, by Production Analysis 2019 & 2032
                                                                                                                                    189. Table 189: Global Vanilla Bean Market Revenue Million Forecast, by Consumption Analysis 2019 & 2032
                                                                                                                                    190. Table 190: Global Vanilla Bean Market Volume Kiloton Forecast, by Consumption Analysis 2019 & 2032
                                                                                                                                    191. Table 191: Global Vanilla Bean Market Revenue Million Forecast, by Import Market Analysis (Value & Volume) 2019 & 2032
                                                                                                                                    192. Table 192: Global Vanilla Bean Market Volume Kiloton Forecast, by Import Market Analysis (Value & Volume) 2019 & 2032
                                                                                                                                    193. Table 193: Global Vanilla Bean Market Revenue Million Forecast, by Export Market Analysis (Value & Volume) 2019 & 2032
                                                                                                                                    194. Table 194: Global Vanilla Bean Market Volume Kiloton Forecast, by Export Market Analysis (Value & Volume) 2019 & 2032
                                                                                                                                    195. Table 195: Global Vanilla Bean Market Revenue Million Forecast, by Price Trend Analysis 2019 & 2032
                                                                                                                                    196. Table 196: Global Vanilla Bean Market Volume Kiloton Forecast, by Price Trend Analysis 2019 & 2032
                                                                                                                                    197. Table 197: Global Vanilla Bean Market Revenue Million Forecast, by Country 2019 & 2032
                                                                                                                                    198. Table 198: Global Vanilla Bean Market Volume Kiloton Forecast, by Country 2019 & 2032
                                                                                                                                    199. Table 199: Global Vanilla Bean Market Revenue Million Forecast, by Production Analysis 2019 & 2032
                                                                                                                                    200. Table 200: Global Vanilla Bean Market Volume Kiloton Forecast, by Production Analysis 2019 & 2032
                                                                                                                                    201. Table 201: Global Vanilla Bean Market Revenue Million Forecast, by Consumption Analysis 2019 & 2032
                                                                                                                                    202. Table 202: Global Vanilla Bean Market Volume Kiloton Forecast, by Consumption Analysis 2019 & 2032
                                                                                                                                    203. Table 203: Global Vanilla Bean Market Revenue Million Forecast, by Import Market Analysis (Value & Volume) 2019 & 2032
                                                                                                                                    204. Table 204: Global Vanilla Bean Market Volume Kiloton Forecast, by Import Market Analysis (Value & Volume) 2019 & 2032
                                                                                                                                    205. Table 205: Global Vanilla Bean Market Revenue Million Forecast, by Export Market Analysis (Value & Volume) 2019 & 2032
                                                                                                                                    206. Table 206: Global Vanilla Bean Market Volume Kiloton Forecast, by Export Market Analysis (Value & Volume) 2019 & 2032
                                                                                                                                    207. Table 207: Global Vanilla Bean Market Revenue Million Forecast, by Price Trend Analysis 2019 & 2032
                                                                                                                                    208. Table 208: Global Vanilla Bean Market Volume Kiloton Forecast, by Price Trend Analysis 2019 & 2032
                                                                                                                                    209. Table 209: Global Vanilla Bean Market Revenue Million Forecast, by Country 2019 & 2032
                                                                                                                                    210. Table 210: Global Vanilla Bean Market Volume Kiloton Forecast, by Country 2019 & 2032


                                                                                                                                    Frequently Asked Questions

                                                                                                                                    1. What is the projected Compound Annual Growth Rate (CAGR) of the Vanilla Bean Market?

                                                                                                                                    The projected CAGR is approximately 2.60%.

                                                                                                                                    2. Which companies are prominent players in the Vanilla Bean Market?

                                                                                                                                    Key companies in the market include E. Guittard & Co., Beanilla, McCormick & Company , Madagascar Gourmet, Indriani, VanillaVida, Nielsen-Massey Vanillas .

                                                                                                                                    3. What are the main segments of the Vanilla Bean Market?

                                                                                                                                    The market segments include Production Analysis, Consumption Analysis, Import Market Analysis (Value & Volume), Export Market Analysis (Value & Volume), Price Trend Analysis.

                                                                                                                                    4. Can you provide details about the market size?

                                                                                                                                    The market size is estimated to be USD 2.16 Million as of 2022.

                                                                                                                                    5. What are some drivers contributing to market growth?

                                                                                                                                    ; Awareness About Health Benefits Associated With Pecan Consumption; Wide Application of Pecan.

                                                                                                                                    6. What are the notable trends driving market growth?

                                                                                                                                    Application in Food and Pharmaceutical Industry is Driving the Market.

                                                                                                                                    7. Are there any restraints impacting market growth?

                                                                                                                                    ; Volatility in the Prices; Adverse Weather Conditions Affecting Yield.

                                                                                                                                    8. Can you provide examples of recent developments in the market?

                                                                                                                                    June 2022: As of June 2022, around 25,000 hectares of land in Madagascar is dedicated to vanilla cultivation, engaging as many as 80,000 farmers. The majority of the world's finest beans come from the northeastern Sava region. Madagascan vanilla is mainly used in the chocolates, cakes, and ice creams sold to consumers around the globe.

                                                                                                                                    9. What pricing options are available for accessing the report?

                                                                                                                                    Pricing options include single-user, multi-user, and enterprise licenses priced at USD 4750, USD 5250, and USD 8750 respectively.

                                                                                                                                    10. Is the market size provided in terms of value or volume?

                                                                                                                                    The market size is provided in terms of value, measured in Million and volume, measured in Kiloton.

                                                                                                                                    11. Are there any specific market keywords associated with the report?

                                                                                                                                    Yes, the market keyword associated with the report is "Vanilla Bean Market," which aids in identifying and referencing the specific market segment covered.

                                                                                                                                    12. How do I determine which pricing option suits my needs best?

                                                                                                                                    The pricing options vary based on user requirements and access needs. Individual users may opt for single-user licenses, while businesses requiring broader access may choose multi-user or enterprise licenses for cost-effective access to the report.

                                                                                                                                    13. Are there any additional resources or data provided in the Vanilla Bean Market report?

                                                                                                                                    While the report offers comprehensive insights, it's advisable to review the specific contents or supplementary materials provided to ascertain if additional resources or data are available.

                                                                                                                                    14. How can I stay updated on further developments or reports in the Vanilla Bean Market?

                                                                                                                                    To stay informed about further developments, trends, and reports in the Vanilla Bean Market, consider subscribing to industry newsletters, following relevant companies and organizations, or regularly checking reputable industry news sources and publications.


                                                                                                                                    Methodology

                                                                                                                                    Step 1 - Identification of Relevant Samples Size from Population Database

                                                                                                                                    Step Chart
                                                                                                                                    Bar Chart
                                                                                                                                    Method Chart

                                                                                                                                    Step 2 - Approaches for Defining Global Market Size (Value, Volume* & Price*)

                                                                                                                                    Approach Chart
                                                                                                                                    Top-down and bottom-up approaches are used to validate the global market size and estimate the market size for manufactures, regional segments, product, and application.

                                                                                                                                    Note*: In applicable scenarios

                                                                                                                                    Step 3 - Data Sources

                                                                                                                                    Primary Research

                                                                                                                                    • Web Analytics
                                                                                                                                    • Survey Reports
                                                                                                                                    • Research Institute
                                                                                                                                    • Latest Research Reports
                                                                                                                                    • Opinion Leaders

                                                                                                                                    Secondary Research

                                                                                                                                    • Annual Reports
                                                                                                                                    • White Paper
                                                                                                                                    • Latest Press Release
                                                                                                                                    • Industry Association
                                                                                                                                    • Paid Database
                                                                                                                                    • Investor Presentations
                                                                                                                                    Analyst Chart

                                                                                                                                    Step 4 - Data Triangulation

                                                                                                                                    Involves using different sources of information in order to increase the validity of a study

                                                                                                                                    These sources are likely to be stakeholders in a program - participants, other researchers, program staff, other community members, and so on.

                                                                                                                                    Then we put all data in single framework & apply various statistical tools to find out the dynamic on the market.

                                                                                                                                    During the analysis stage, feedback from the stakeholder groups would be compared to determine areas of agreement as well as areas of divergence

                                                                                                                                    Additionally, after gathering mixed and scattered data from a wide range of sources, data is triangulated and correlated to come up with estimated figures which are further validated through primary mediums or industry experts, opinion leaders.

                                                                                                                                    About Research Axiom

                                                                                                                                    Research Axiom delivers in-depth market research, industry analysis, and consulting for pharmaceuticals, automotive, IT, and consumer goods. Our reports provide the clarity you need to make informed decisions and drive innovation.

                                                                                                                                    Our team combines primary research, advanced analytics, and sector expertise to deliver actionable intelligence. We offer syndicated reports, custom research, and consulting services tailored to your business needs.

                                                                                                                                    At Research Axiom, we are committed to quality, transparency, and client satisfaction. Every report is rigorously validated to ensure accuracy and relevance. Our global perspective and local expertise help you understand both the big picture and the finer details of your market.

                                                                                                                                    Stay informed with Research Axiom. Subscribe to our newsletter for the latest updates and research highlights, and follow us on social media for real-time insights. Research Axiom – Turning Data into Business Advantage.

                                                                                                                                    artwork spiralartwork spiralRelated Reports
                                                                                                                                    artwork underline

                                                                                                                                    Strategic Trends in Southeast Asia Seed Market Market 2025-2033

                                                                                                                                    The Southeast Asia seed market is booming, projected to reach $XX million by 2033 with a 4% CAGR. Driven by food security needs and technological advancements in hybrid seeds and protected cultivation, this market presents lucrative opportunities for investors. Learn more about key players, regional trends, and growth projections.

                                                                                                                                    July 2025
                                                                                                                                    Base Year: 2024
                                                                                                                                    No Of Pages: 197
                                                                                                                                    Price: $3800

                                                                                                                                    Strategic Planning for North America Agricultural Irrigation Machinery Market Industry Expansion

                                                                                                                                    Discover the booming North American agricultural irrigation machinery market. This in-depth analysis reveals a 5.10% CAGR, driven by water scarcity, precision agriculture, and smart irrigation technology. Learn about key players, market trends, and future projections for 2025-2033.

                                                                                                                                    July 2025
                                                                                                                                    Base Year: 2024
                                                                                                                                    No Of Pages: 234
                                                                                                                                    Price: $4750

                                                                                                                                    Qatar Aquaculture and Fisheries Market Analysis Uncovered: Market Drivers and Forecasts 2025-2033

                                                                                                                                    Discover the booming Qatar aquaculture and fisheries market, projected to reach \$252.74 million by 2033 with a 5% CAGR. This in-depth analysis covers market size, key players (Al-Khaleej Seafoods, Al Rayan Shrimp Trading), segments (pelagic fish, shrimp, caviar), and future growth drivers.

                                                                                                                                    July 2025
                                                                                                                                    Base Year: 2024
                                                                                                                                    No Of Pages: 150
                                                                                                                                    Price: $3800

                                                                                                                                    U.S. Maize Industry Market Trends and Strategic Roadmap

                                                                                                                                    Discover the dynamic U.S. maize industry outlook with our comprehensive market analysis. Explore key trends, regional breakdowns, and leading companies shaping this multi-billion dollar sector. Projecting steady growth through 2033, understand the factors driving expansion and the challenges ahead for maize producers and stakeholders.

                                                                                                                                    July 2025
                                                                                                                                    Base Year: 2024
                                                                                                                                    No Of Pages: 180
                                                                                                                                    Price: $3800

                                                                                                                                    Alfalfa Hay Market in Italy Future-proof Strategies: Trends, Competitor Dynamics, and Opportunities 2025-2033

                                                                                                                                    Discover the latest insights into Italy's thriving alfalfa hay market. Explore market size, CAGR, key drivers, trends, and competitive landscape analysis for 2025-2033. Learn about segment growth in bales, pellets, and cubes across animal feed applications.

                                                                                                                                    July 2025
                                                                                                                                    Base Year: 2024
                                                                                                                                    No Of Pages: 150
                                                                                                                                    Price: $3800

                                                                                                                                    India Biopesticides Industry Market Disruption: Competitor Insights and Trends 2025-2033

                                                                                                                                    The India biopesticides market is booming, projected to reach ₹237.3 Billion (USD 2847.6 million) by 2033, driven by growing demand for sustainable agriculture and stricter regulations. Learn about key market trends, leading companies, and regional growth forecasts in this comprehensive analysis.

                                                                                                                                    July 2025
                                                                                                                                    Base Year: 2024
                                                                                                                                    No Of Pages: 197
                                                                                                                                    Price: $3800

                                                                                                                                    Decoding Almond Market Consumer Preferences 2025-2033

                                                                                                                                    Discover the booming almond market! Explore its $10.12B valuation (2025), 5.55% CAGR, key drivers, trends, and regional insights. Learn about leading companies and diverse product types including almond butter, flour, and oil. Uncover future growth projections for the almond industry until 2033.

                                                                                                                                    July 2025
                                                                                                                                    Base Year: 2024
                                                                                                                                    No Of Pages: 234
                                                                                                                                    Price: $4750

                                                                                                                                    Bio Organic Fertilizer Market Insightful Market Analysis: Trends and Opportunities 2025-2033

                                                                                                                                    The global bio organic fertilizer market is booming, projected to reach [estimated 2033 value] by 2033 with a CAGR of 5.90%. Discover key market trends, drivers, restraints, and leading companies shaping this sustainable agriculture sector. Learn more about organic fertilizer types, applications, and regional market analysis.

                                                                                                                                    July 2025
                                                                                                                                    Base Year: 2024
                                                                                                                                    No Of Pages: 150
                                                                                                                                    Price: $4750

                                                                                                                                    Exploring Saudi Arabia Agriculture Market’s Market Size Dynamics 2025-2033

                                                                                                                                    Discover the booming Saudi Arabia agriculture market! Projected to reach \$28.3 billion by 2033 with a 5.2% CAGR, this report analyzes market size, key players (Carrefour, Lulu Group), regional trends, and growth drivers. Learn about opportunities and challenges in this dynamic sector.

                                                                                                                                    July 2025
                                                                                                                                    Base Year: 2024
                                                                                                                                    No Of Pages: 197
                                                                                                                                    Price: $3800

                                                                                                                                    Lentil Industry Charting Growth Trajectories 2025-2033: Strategic Insights and Forecasts

                                                                                                                                    Discover the booming lentil market! Explore key trends, regional insights, and leading companies driving growth in this $X billion industry (2025 estimate) projected to reach $X billion by 2033. Learn about the rising demand for whole, split, and dehulled lentils in dry, canned, and frozen forms. Get the complete market analysis now!

                                                                                                                                    July 2025
                                                                                                                                    Base Year: 2024
                                                                                                                                    No Of Pages: 234
                                                                                                                                    Price: $4750

                                                                                                                                    USA Agricultural Irrigation Machinery Market Soars to XXX Million, witnessing a CAGR of XX during the forecast period 2025-2033

                                                                                                                                    Discover the booming US agricultural irrigation machinery market! This in-depth analysis reveals key trends, growth drivers, and leading companies from 2025-2033. Learn about the impact of precision agriculture, water scarcity, and government initiatives on the market's future. Explore segments like drip, sprinkler, and pivot irrigation systems.

                                                                                                                                    July 2025
                                                                                                                                    Base Year: 2024
                                                                                                                                    No Of Pages: 150
                                                                                                                                    Price: $3800

                                                                                                                                    Exploring Barriers in North American Olives Market Market: Trends and Analysis 2025-2033

                                                                                                                                    Discover the booming North American olives market! This comprehensive analysis reveals a $6.9B market with a 5.74% CAGR (2025-2033), driven by health trends & Mediterranean diet popularity. Explore market segmentation, key players (Napa Valley Olive Oil, Musco Family Olive Co., etc.), and future growth projections for olive oil, table olives, and more.

                                                                                                                                    July 2025
                                                                                                                                    Base Year: 2024
                                                                                                                                    No Of Pages: 180
                                                                                                                                    Price: $4750

                                                                                                                                    South America Biological Organic Fertilizers Industry 2025 to Grow at XX CAGR with XXX Million Market Size: Analysis and Forecasts 2033

                                                                                                                                    Discover the booming South American biological organic fertilizer market! Projected to reach [estimated 2033 value based on CAGR] by 2033, this market is driven by sustainable agriculture trends and growing demand for eco-friendly farming. Learn about key players, market segments (cereals, legumes, fruits & vegetables), and growth opportunities in Brazil, Argentina, and beyond.

                                                                                                                                    July 2025
                                                                                                                                    Base Year: 2024
                                                                                                                                    No Of Pages: 150
                                                                                                                                    Price: $4750

                                                                                                                                    Analyzing Competitor Moves: Iran Agricultural Sector Analysis Growth Outlook 2025-2033

                                                                                                                                    Discover the growth opportunities and challenges within Iran's agricultural sector. This comprehensive analysis covers market size, CAGR, key drivers, trends, and regional variations across food crops, cash crops, fruits, vegetables, dairy, and fishery from 2019-2033. Gain valuable insights into this dynamic market.

                                                                                                                                    July 2025
                                                                                                                                    Base Year: 2024
                                                                                                                                    No Of Pages: 150
                                                                                                                                    Price: $3800

                                                                                                                                    South America Agricultual Films Market Market’s Drivers and Challenges: Strategic Overview 2025-2033

                                                                                                                                    Discover the booming South American agricultural films market! This in-depth analysis reveals a CAGR of 6.10% to 2033, driven by growing demand for modern farming techniques and food security. Explore key trends, leading companies (Dow, Agroflex, etc.), and regional insights for Brazil, Argentina, and beyond. Learn how this expanding market presents lucrative opportunities.

                                                                                                                                    July 2025
                                                                                                                                    Base Year: 2024
                                                                                                                                    No Of Pages: 150
                                                                                                                                    Price: $4750

                                                                                                                                    Analyzing Coffee Trade Analysis Industry: Opportunities and Growth Patterns 2025-2033

                                                                                                                                    Discover the latest insights into the booming global coffee trade market. This comprehensive analysis reveals key trends, growth drivers, and market segmentation for Arabica, Robusta, and various coffee processing methods. Explore regional market shares and leading companies like Starbucks & Nestlé. Project your business strategy with our 2025-2033 forecast.

                                                                                                                                    July 2025
                                                                                                                                    Base Year: 2024
                                                                                                                                    No Of Pages: 150
                                                                                                                                    Price: $4750

                                                                                                                                    Kiwi Fruit Market Insightful Market Analysis: Trends and Opportunities 2025-2033

                                                                                                                                    Discover the booming kiwi fruit market! This comprehensive analysis reveals a $1.89B market in 2025, projected to reach significant heights by 2033 with a 5.02% CAGR. Explore key drivers, regional trends, and leading companies shaping this dynamic industry.

                                                                                                                                    July 2025
                                                                                                                                    Base Year: 2024
                                                                                                                                    No Of Pages: 180
                                                                                                                                    Price: $4750

                                                                                                                                    Africa Chia Seeds Industry: Growth Opportunities and Competitive Landscape Overview 2025-2033

                                                                                                                                    Discover the booming Africa chia seeds market! Explore its $13.87M valuation (2025), 2.10% CAGR, key segments (organic, food & beverage, supplements), and leading companies. Learn about growth drivers, trends, and regional insights (South Africa, UAE) in this comprehensive market analysis.

                                                                                                                                    July 2025
                                                                                                                                    Base Year: 2024
                                                                                                                                    No Of Pages: 180
                                                                                                                                    Price: $4750

                                                                                                                                    China Pesticide Industry Market Report: Strategic Insights

                                                                                                                                    Discover the booming China pesticide market, projected to reach $XX million by 2025 and grow at a CAGR of 6.60% until 2033. Analyze key trends, leading companies (Bayer, Syngenta, UPL), and market segmentation (fungicides, herbicides, insecticides, etc.) impacting this dynamic sector.

                                                                                                                                    July 2025
                                                                                                                                    Base Year: 2024
                                                                                                                                    No Of Pages: 197
                                                                                                                                    Price: $3800

                                                                                                                                    Global Metal Chelates Market Future-proof Strategies: Trends, Competitor Dynamics, and Opportunities 2025-2033

                                                                                                                                    Discover the booming global metal chelates market! This comprehensive analysis reveals a CAGR of 10.20%, driven by surging demand for efficient micronutrient delivery in agriculture. Explore market size, segmentation (crop type, product type, application), key players, and regional trends for 2025-2033.

                                                                                                                                    July 2025
                                                                                                                                    Base Year: 2024
                                                                                                                                    No Of Pages: 197
                                                                                                                                    Price: $3800
                                                                                                                                    • Home
                                                                                                                                    • About Us
                                                                                                                                    • Industries
                                                                                                                                      • Aerospace & Defense
                                                                                                                                      • Agriculture
                                                                                                                                      • Animal Nutrition & Wellness
                                                                                                                                      • Automotive
                                                                                                                                      • Chemicals & Materials
                                                                                                                                      • Consumer Goods and Services
                                                                                                                                      • Energy & Power
                                                                                                                                      • Financial Services and Investment Intelligence
                                                                                                                                      • Food & Beverage
                                                                                                                                      • Home and Property Improvement
                                                                                                                                      • Hospitality and Tourism
                                                                                                                                      • Logistics
                                                                                                                                      • Manufacturing Products and Services
                                                                                                                                      • Packaging
                                                                                                                                      • Professional and Commercial Services
                                                                                                                                      • Real Estate and Construction
                                                                                                                                      • Retail
                                                                                                                                      • Technology, Media and Telecom
                                                                                                                                      • Healthcare
                                                                                                                                    • Services
                                                                                                                                    • Contact
                                                                                                                                    Main Logo
                                                                                                                                    • Home
                                                                                                                                    • About Us
                                                                                                                                    • Industries
                                                                                                                                      • Aerospace & Defense
                                                                                                                                      • Agriculture
                                                                                                                                      • Animal Nutrition & Wellness
                                                                                                                                      • Automotive
                                                                                                                                      • Chemicals & Materials
                                                                                                                                      • Consumer Goods and Services
                                                                                                                                      • Energy & Power
                                                                                                                                      • Financial Services and Investment Intelligence
                                                                                                                                      • Food & Beverage
                                                                                                                                      • Home and Property Improvement
                                                                                                                                      • Hospitality and Tourism
                                                                                                                                      • Logistics
                                                                                                                                      • Manufacturing Products and Services
                                                                                                                                      • Packaging
                                                                                                                                      • Professional and Commercial Services
                                                                                                                                      • Real Estate and Construction
                                                                                                                                      • Retail
                                                                                                                                      • Technology, Media and Telecom
                                                                                                                                      • Healthcare
                                                                                                                                    • Services
                                                                                                                                    • Contact
                                                                                                                                    +17162654855
                                                                                                                                    [email protected]

                                                                                                                                    +17162654855

                                                                                                                                    [email protected]

                                                                                                                                    Business Address

                                                                                                                                    Head Office

                                                                                                                                    Office no. A 5010, fifth floor, Solitaire Business Hub, Near Phoenix mall, Pune, Maharashtra 411014

                                                                                                                                    Contact Information

                                                                                                                                    Craig Francis

                                                                                                                                    Business Development Head

                                                                                                                                    +17162654855

                                                                                                                                    [email protected]

                                                                                                                                    Connect With Us

                                                                                                                                    Secure Payment Partners

                                                                                                                                    payment image
                                                                                                                                    RetailLogisticsPackagingAutomotiveHealthcareAgricultureEnergy & PowerFood & BeverageAerospace & DefenseChemicals & MaterialsHospitality and TourismAnimal Nutrition & WellnessConsumer Goods and ServicesReal Estate and ConstructionHome and Property ImprovementTechnology, Media and TelecomManufacturing Products and ServicesFinancial Services and Investment Intelligence

                                                                                                                                    © 2025 All rights reserved


                                                                                                                                    Privacy Policy
                                                                                                                                    Terms and Conditions
                                                                                                                                    FAQ