

Key Insights
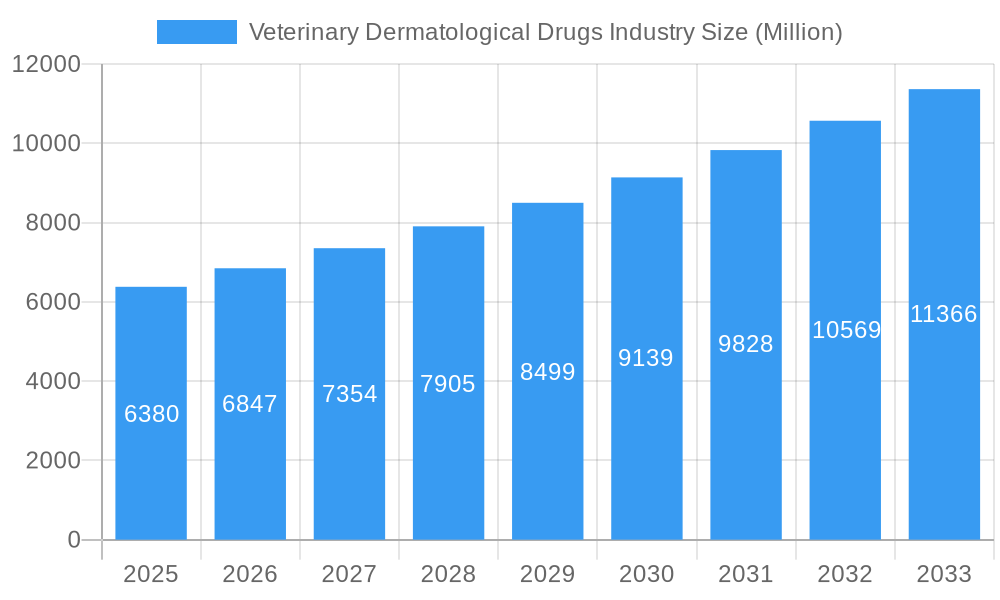
The global veterinary dermatological drugs market, valued at $6.38 billion in 2025, is projected to experience robust growth, driven by increasing pet ownership, rising pet healthcare expenditure, and a growing awareness of animal dermatological issues. The market's Compound Annual Growth Rate (CAGR) of 7.11% from 2019-2024 indicates a consistent upward trajectory, expected to continue through 2033. Key drivers include the rising prevalence of allergic and parasitic skin conditions in companion animals (dogs and cats), coupled with the increasing availability of advanced and effective treatment options, including topical, injectable, and oral medications. The retail distribution channel currently dominates, reflecting the convenient access for pet owners, but e-commerce is emerging as a significant growth driver, providing accessibility and convenience. Furthermore, the livestock animal segment demonstrates potential for expansion as preventative and therapeutic dermatological treatments for large-scale animal operations become more commonplace. However, factors like stringent regulatory approvals and the relatively high cost of certain specialized treatments may act as market restraints.
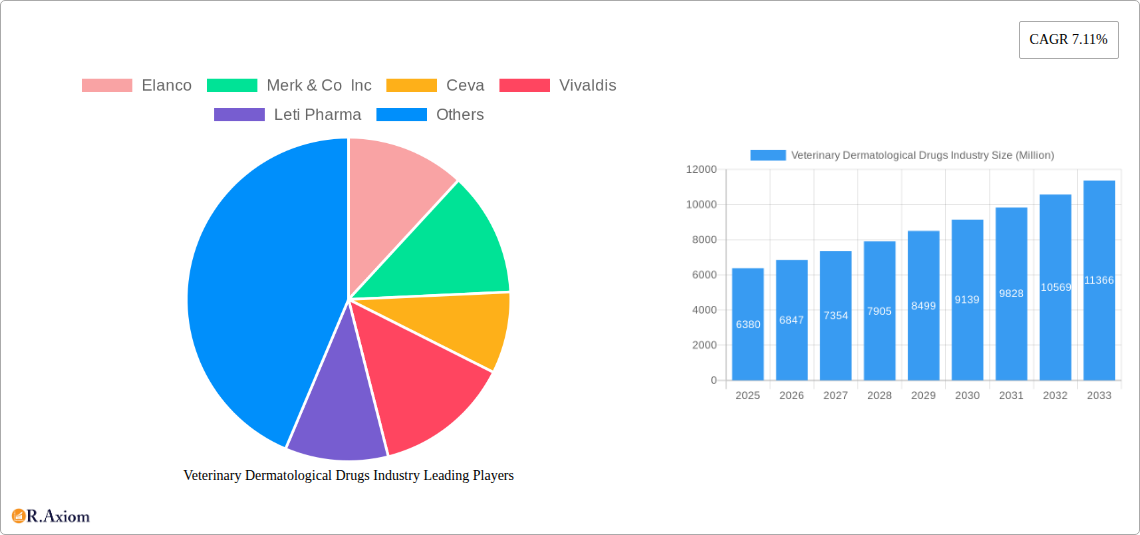
Veterinary Dermatological Drugs Industry Market Size (In Billion)
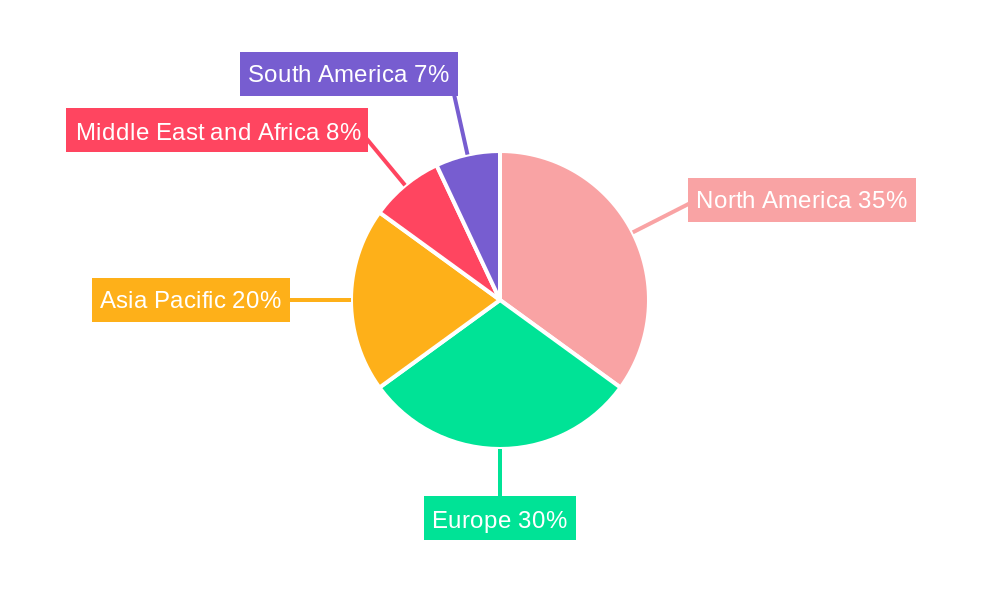
The market segmentation reveals a strong preference for topical treatments for companion animals, likely due to ease of application and better owner compliance. The parasitic infections indication segment is currently the largest, but allergic infections are exhibiting significant growth, mirroring changing lifestyles and environmental factors impacting animal health. Major players such as Zoetis, Elanco, and Merck & Co. Inc. are actively engaged in research and development, leading to innovative product launches and expanding their market presence through strategic partnerships and acquisitions. The North American and European markets currently hold the largest market share, but the Asia-Pacific region is emerging as a significant growth opportunity due to increasing pet ownership and rising disposable incomes. The forecast period (2025-2033) anticipates continued expansion across all segments and regions, with a potential for accelerated growth based on advancements in drug development and increased veterinary care access.
Veterinary Dermatological Drugs Industry Company Market Share
Veterinary Dermatological Drugs Market: A Comprehensive Report (2019-2033)
This comprehensive report provides an in-depth analysis of the veterinary dermatological drugs industry, covering market size, growth drivers, competitive landscape, and future outlook. The study period spans from 2019 to 2033, with 2025 as the base and estimated year. The forecast period is 2025-2033, and the historical period encompasses 2019-2024. The report offers actionable insights for industry stakeholders, including manufacturers, distributors, and investors.
Veterinary Dermatological Drugs Industry Market Concentration & Innovation
The veterinary dermatological drugs market exhibits a moderately concentrated landscape, with key players such as Zoetis, Elanco, Merck & Co Inc, and Virbac holding significant market share. The exact market share for each company is currently being finalized, but preliminary data suggests a combined share of approximately xx%. Innovation is a critical driver, fueled by the increasing prevalence of dermatological conditions in companion and livestock animals, demand for more effective and convenient treatment options, and ongoing research and development efforts. Regulatory frameworks, particularly those related to drug approvals and safety, significantly influence market dynamics. The market also witnesses considerable M&A activity, reflecting strategic efforts by major players to expand their product portfolios and market reach. For example, a recent M&A deal involved xx company acquiring yy company for a value of $xx Million, significantly impacting the competitive landscape. Product substitutes, such as alternative therapies and home remedies, present a challenge to the market. However, the growing preference for scientifically validated treatments and increased veterinary care access is bolstering market growth. End-user trends, particularly towards premium pet care products and improved animal welfare, influence the demand for high-quality dermatological drugs.
- Market Concentration: Moderate, with top players holding xx% market share (estimated).
- Innovation Drivers: Growing prevalence of dermatological conditions, demand for better treatments, R&D efforts.
- Regulatory Framework: Stringent drug approval and safety regulations.
- M&A Activity: Significant activity observed, with recent deals valued at $xx Million.
- Product Substitutes: Alternative therapies and home remedies pose a challenge.
- End-User Trends: Premium pet care and animal welfare driving demand.
Veterinary Dermatological Drugs Industry Industry Trends & Insights
The veterinary dermatological drugs market is experiencing robust growth, driven by several factors. The increasing pet ownership globally and rising disposable incomes in developing economies are significantly contributing to market expansion. Technological advancements, such as the development of novel drug delivery systems and improved diagnostic tools, are improving treatment efficacy and convenience. Consumer preferences are shifting towards safer, more effective, and convenient treatment options, leading to increased demand for advanced dermatological drugs. The competitive landscape is characterized by intense rivalry, with major players focusing on product innovation, strategic partnerships, and geographic expansion to gain market share. The market’s compound annual growth rate (CAGR) is estimated to be xx% during the forecast period (2025-2033), with market penetration of xx% in the key segments by 2033. This growth is further fueled by increasing awareness of animal health and welfare, along with proactive pet owner behavior. The shift towards specialized veterinary dermatology services is also enhancing market growth.
Dominant Markets & Segments in Veterinary Dermatological Drugs Industry
The companion animal segment dominates the veterinary dermatological drugs market, driven by higher pet ownership rates and increased spending on pet healthcare. Geographically, North America and Europe currently hold significant market share due to high pet ownership and developed healthcare infrastructure. However, rapidly growing economies in Asia-Pacific are witnessing significant market expansion.
Dominant Segments:
- Animal Type: Companion animals (dogs and cats) contribute the largest share due to high pet ownership and increased veterinary care.
- Route of Administration: Topical applications are dominant owing to ease of use and reduced systemic side effects.
- Indication: Parasitic infections hold a substantial market share because of high prevalence.
- Distribution Channel: Retail pharmacies and veterinary hospitals represent the dominant distribution channels.
Key Drivers:
- High Pet Ownership: Primarily in North America and Europe, fueling demand.
- Rising Disposable Incomes: In emerging economies, leading to increased pet healthcare expenditure.
- Advanced Veterinary Care: Increasing access to specialized dermatological services.
- Strong Regulatory Framework: Driving adoption of safe and effective treatments.
Veterinary Dermatological Drugs Industry Product Developments
Recent product innovations focus on improved efficacy, targeted drug delivery, and enhanced convenience. New formulations, such as chewable tablets and topical ointments with better adherence, are gaining popularity. The market is witnessing a technological shift toward personalized medicine and targeted therapies to optimize treatment outcomes and minimize adverse effects. These developments enhance market appeal by addressing specific needs and improving the patient experience.
Report Scope & Segmentation Analysis
This report segments the veterinary dermatological drugs market based on distribution channel (retail, hospital pharmacies, e-commerce), animal type (companion animals, livestock animals), route of administration (topical, injectable, oral), and indication (parasitic infections, allergic infections, other indications). Each segment's market size, growth projections, and competitive dynamics are thoroughly analyzed. The companion animal segment exhibits the highest growth potential. Topical administration remains a dominant route due to its convenience and effectiveness. Allergic infections are a rapidly expanding indication area due to rising prevalence. E-commerce sales are projected to experience the most significant growth among the distribution channels.
Key Drivers of Veterinary Dermatological Drugs Industry Growth
Several factors fuel the growth of the veterinary dermatological drugs market. Rising pet ownership and increasing pet humanization are key drivers. Technological advancements in drug delivery systems and diagnostics enhance treatment efficacy. A growing awareness of animal health and welfare among pet owners promotes proactive healthcare seeking. Favorable regulatory environments in several countries support market expansion.
Challenges in the Veterinary Dermatological Drugs Industry Sector
The veterinary dermatological drugs industry faces several challenges. Stringent regulatory approvals can delay product launches, increasing development costs. Supply chain disruptions due to geopolitical uncertainties affect product availability. Intense competition among major players necessitates continuous innovation and cost optimization. The presence of alternative therapies and home remedies also poses a challenge, but this market segment is still dominated by conventional veterinary dermatological drugs.
Emerging Opportunities in Veterinary Dermatological Drugs Industry
The market presents numerous opportunities. Expansion into emerging markets in Asia and Latin America offers significant growth potential. The development of novel therapies addressing unmet medical needs promises high returns. Personalized medicine approaches using advanced diagnostics can improve treatment outcomes. Leveraging digital technologies for marketing and distribution enhances market reach.
Leading Players in the Veterinary Dermatological Drugs Industry Market
- Elanco
- Merk & Co Inc
- Ceva
- Vivaldis
- Leti Pharma
- Mars Incorporated
- Indian Immunologicals Ltd
- Bimeda Inc
- Virbac
- Bioiberica S A U
- Zoetis Inc
Key Developments in Veterinary Dermatological Drugs Industry Industry
- June 2023: Zoetis announced FDA approval of Apoquel® Chewable for controlling pruritus and atopic dermatitis in dogs.
- April 2023: Bioiberica launched the Atopivet Collar for atopic dermatitis treatment.
Strategic Outlook for Veterinary Dermatological Drugs Industry Market
The veterinary dermatological drugs market is poised for continued growth, driven by rising pet ownership, increasing healthcare expenditure, and technological advancements. The focus will remain on developing innovative products, optimizing treatment strategies, and expanding market reach into underserved regions. Strategic partnerships and collaborations will be crucial for sustained growth and competitive advantage in the coming years. Companies focused on personalized medicine and advanced therapies will witness significant market success.
Veterinary Dermatological Drugs Industry Segmentation
-
1. Animal
- 1.1. Companion Animal
- 1.2. Livestock Animal
-
2. Route Of Administration
- 2.1. Topical
- 2.2. Injectable
- 2.3. Oral
-
3. Indication
- 3.1. Parasitic Infections
- 3.2. Allergic Infections
- 3.3. Other Indications
-
4. Distribution Channel
- 4.1. Retail
- 4.2. Hospital Pharmacies
- 4.3. E-commerce
Veterinary Dermatological Drugs Industry Segmentation By Geography
-
1. North America
- 1.1. United States
- 1.2. Canada
- 1.3. Mexico
-
2. Europe
- 2.1. United Kingdom
- 2.2. France
- 2.3. Germany
- 2.4. Italy
- 2.5. Spain
- 2.6. Rest of Europe
-
3. Asia Pacific
- 3.1. India
- 3.2. China
- 3.3. Japan
- 3.4. Australia
- 3.5. South Korea
- 3.6. Rest of Asia Pacific
-
4. Middle East and Africa
- 4.1. GCC
- 4.2. South Africa
- 4.3. Rest of Middle East and Africa
-
5. South America
- 5.1. Brazil
- 5.2. Argentina
- 5.3. Rest of South America
Veterinary Dermatological Drugs Industry Regional Market Share
Geographic Coverage of Veterinary Dermatological Drugs Industry
Veterinary Dermatological Drugs Industry REPORT HIGHLIGHTS
| Aspects | Details |
|---|---|
| Study Period | 2020-2034 |
| Base Year | 2025 |
| Estimated Year | 2026 |
| Forecast Period | 2026-2034 |
| Historical Period | 2020-2025 |
| Growth Rate | CAGR of 7.11% from 2020-2034 |
| Segmentation |
|
Table of Contents
- 1. Introduction
- 1.1. Research Scope
- 1.2. Market Segmentation
- 1.3. Research Objective
- 1.4. Definitions and Assumptions
- 2. Executive Summary
- 2.1. Market Snapshot
- 3. Market Dynamics
- 3.1. Market Drivers
- 3.2. Market Restrains
- 3.3. Market Trends
- 3.4. Market Opportunities
- 4. Market Factor Analysis
- 4.1. Porters Five Forces
- 4.1.1. Bargaining Power of Suppliers
- 4.1.2. Bargaining Power of Buyers
- 4.1.3. Threat of New Entrants
- 4.1.4. Threat of Substitutes
- 4.1.5. Competitive Rivalry
- 4.2. PESTEL analysis
- 4.3. BCG Analysis
- 4.3.1. Stars (High Growth, High Market Share)
- 4.3.2. Cash Cows (Low Growth, High Market Share)
- 4.3.3. Question Mark (High Growth, Low Market Share)
- 4.3.4. Dogs (Low Growth, Low Market Share)
- 4.4. Ansoff Matrix Analysis
- 4.5. Supply Chain Analysis
- 4.6. Regulatory Landscape
- 4.7. Current Market Potential and Opportunity Assessment (TAM–SAM–SOM Framework)
- 4.8. RAX Analyst Note
- 4.1. Porters Five Forces
- 5. Market Analysis, Insights and Forecast 2021-2033
- 5.1. Market Analysis, Insights and Forecast - by Animal
- 5.1.1. Companion Animal
- 5.1.2. Livestock Animal
- 5.2. Market Analysis, Insights and Forecast - by Route Of Administration
- 5.2.1. Topical
- 5.2.2. Injectable
- 5.2.3. Oral
- 5.3. Market Analysis, Insights and Forecast - by Indication
- 5.3.1. Parasitic Infections
- 5.3.2. Allergic Infections
- 5.3.3. Other Indications
- 5.4. Market Analysis, Insights and Forecast - by Distribution Channel
- 5.4.1. Retail
- 5.4.2. Hospital Pharmacies
- 5.4.3. E-commerce
- 5.5. Market Analysis, Insights and Forecast - by Region
- 5.5.1. North America
- 5.5.2. Europe
- 5.5.3. Asia Pacific
- 5.5.4. Middle East and Africa
- 5.5.5. South America
- 5.1. Market Analysis, Insights and Forecast - by Animal
- 6. Global Veterinary Dermatological Drugs Industry Analysis, Insights and Forecast, 2021-2033
- 6.1. Market Analysis, Insights and Forecast - by Animal
- 6.1.1. Companion Animal
- 6.1.2. Livestock Animal
- 6.2. Market Analysis, Insights and Forecast - by Route Of Administration
- 6.2.1. Topical
- 6.2.2. Injectable
- 6.2.3. Oral
- 6.3. Market Analysis, Insights and Forecast - by Indication
- 6.3.1. Parasitic Infections
- 6.3.2. Allergic Infections
- 6.3.3. Other Indications
- 6.4. Market Analysis, Insights and Forecast - by Distribution Channel
- 6.4.1. Retail
- 6.4.2. Hospital Pharmacies
- 6.4.3. E-commerce
- 6.1. Market Analysis, Insights and Forecast - by Animal
- 7. North America Veterinary Dermatological Drugs Industry Analysis, Insights and Forecast, 2020-2032
- 7.1. Market Analysis, Insights and Forecast - by Animal
- 7.1.1. Companion Animal
- 7.1.2. Livestock Animal
- 7.2. Market Analysis, Insights and Forecast - by Route Of Administration
- 7.2.1. Topical
- 7.2.2. Injectable
- 7.2.3. Oral
- 7.3. Market Analysis, Insights and Forecast - by Indication
- 7.3.1. Parasitic Infections
- 7.3.2. Allergic Infections
- 7.3.3. Other Indications
- 7.4. Market Analysis, Insights and Forecast - by Distribution Channel
- 7.4.1. Retail
- 7.4.2. Hospital Pharmacies
- 7.4.3. E-commerce
- 7.1. Market Analysis, Insights and Forecast - by Animal
- 8. Europe Veterinary Dermatological Drugs Industry Analysis, Insights and Forecast, 2020-2032
- 8.1. Market Analysis, Insights and Forecast - by Animal
- 8.1.1. Companion Animal
- 8.1.2. Livestock Animal
- 8.2. Market Analysis, Insights and Forecast - by Route Of Administration
- 8.2.1. Topical
- 8.2.2. Injectable
- 8.2.3. Oral
- 8.3. Market Analysis, Insights and Forecast - by Indication
- 8.3.1. Parasitic Infections
- 8.3.2. Allergic Infections
- 8.3.3. Other Indications
- 8.4. Market Analysis, Insights and Forecast - by Distribution Channel
- 8.4.1. Retail
- 8.4.2. Hospital Pharmacies
- 8.4.3. E-commerce
- 8.1. Market Analysis, Insights and Forecast - by Animal
- 9. Asia Pacific Veterinary Dermatological Drugs Industry Analysis, Insights and Forecast, 2020-2032
- 9.1. Market Analysis, Insights and Forecast - by Animal
- 9.1.1. Companion Animal
- 9.1.2. Livestock Animal
- 9.2. Market Analysis, Insights and Forecast - by Route Of Administration
- 9.2.1. Topical
- 9.2.2. Injectable
- 9.2.3. Oral
- 9.3. Market Analysis, Insights and Forecast - by Indication
- 9.3.1. Parasitic Infections
- 9.3.2. Allergic Infections
- 9.3.3. Other Indications
- 9.4. Market Analysis, Insights and Forecast - by Distribution Channel
- 9.4.1. Retail
- 9.4.2. Hospital Pharmacies
- 9.4.3. E-commerce
- 9.1. Market Analysis, Insights and Forecast - by Animal
- 10. Middle East and Africa Veterinary Dermatological Drugs Industry Analysis, Insights and Forecast, 2020-2032
- 10.1. Market Analysis, Insights and Forecast - by Animal
- 10.1.1. Companion Animal
- 10.1.2. Livestock Animal
- 10.2. Market Analysis, Insights and Forecast - by Route Of Administration
- 10.2.1. Topical
- 10.2.2. Injectable
- 10.2.3. Oral
- 10.3. Market Analysis, Insights and Forecast - by Indication
- 10.3.1. Parasitic Infections
- 10.3.2. Allergic Infections
- 10.3.3. Other Indications
- 10.4. Market Analysis, Insights and Forecast - by Distribution Channel
- 10.4.1. Retail
- 10.4.2. Hospital Pharmacies
- 10.4.3. E-commerce
- 10.1. Market Analysis, Insights and Forecast - by Animal
- 11. South America Veterinary Dermatological Drugs Industry Analysis, Insights and Forecast, 2020-2032
- 11.1. Market Analysis, Insights and Forecast - by Animal
- 11.1.1. Companion Animal
- 11.1.2. Livestock Animal
- 11.2. Market Analysis, Insights and Forecast - by Route Of Administration
- 11.2.1. Topical
- 11.2.2. Injectable
- 11.2.3. Oral
- 11.3. Market Analysis, Insights and Forecast - by Indication
- 11.3.1. Parasitic Infections
- 11.3.2. Allergic Infections
- 11.3.3. Other Indications
- 11.4. Market Analysis, Insights and Forecast - by Distribution Channel
- 11.4.1. Retail
- 11.4.2. Hospital Pharmacies
- 11.4.3. E-commerce
- 11.1. Market Analysis, Insights and Forecast - by Animal
- 12. Competitive Analysis
- 12.1. Company Profiles
- 12.1.1 Elanco
- 12.1.1.1. Company Overview
- 12.1.1.2. Products
- 12.1.1.3. Company Financials
- 12.1.1.4. SWOT Analysis
- 12.1.2 Merk & Co Inc
- 12.1.2.1. Company Overview
- 12.1.2.2. Products
- 12.1.2.3. Company Financials
- 12.1.2.4. SWOT Analysis
- 12.1.3 Ceva
- 12.1.3.1. Company Overview
- 12.1.3.2. Products
- 12.1.3.3. Company Financials
- 12.1.3.4. SWOT Analysis
- 12.1.4 Vivaldis
- 12.1.4.1. Company Overview
- 12.1.4.2. Products
- 12.1.4.3. Company Financials
- 12.1.4.4. SWOT Analysis
- 12.1.5 Leti Pharma
- 12.1.5.1. Company Overview
- 12.1.5.2. Products
- 12.1.5.3. Company Financials
- 12.1.5.4. SWOT Analysis
- 12.1.6 Mars Incorporated
- 12.1.6.1. Company Overview
- 12.1.6.2. Products
- 12.1.6.3. Company Financials
- 12.1.6.4. SWOT Analysis
- 12.1.7 Indian Immunologicals Ltd
- 12.1.7.1. Company Overview
- 12.1.7.2. Products
- 12.1.7.3. Company Financials
- 12.1.7.4. SWOT Analysis
- 12.1.8 Bimeda Inc
- 12.1.8.1. Company Overview
- 12.1.8.2. Products
- 12.1.8.3. Company Financials
- 12.1.8.4. SWOT Analysis
- 12.1.9 Virbac
- 12.1.9.1. Company Overview
- 12.1.9.2. Products
- 12.1.9.3. Company Financials
- 12.1.9.4. SWOT Analysis
- 12.1.10 Bioiberica S A U
- 12.1.10.1. Company Overview
- 12.1.10.2. Products
- 12.1.10.3. Company Financials
- 12.1.10.4. SWOT Analysis
- 12.1.11 Zoetis Inc
- 12.1.11.1. Company Overview
- 12.1.11.2. Products
- 12.1.11.3. Company Financials
- 12.1.11.4. SWOT Analysis
- 12.1.1 Elanco
- 12.2. Market Entropy
- 12.2.1 Company's Key Areas Served
- 12.2.2 Recent Developments
- 12.3. Company Market Share Analysis 2025
- 12.3.1 Top 5 Companies Market Share Analysis
- 12.3.2 Top 3 Companies Market Share Analysis
- 12.4. List of Potential Customers
- 13. Research Methodology
List of Figures
- Figure 1: Global Veterinary Dermatological Drugs Industry Revenue Breakdown (Million, %) by Region 2025 & 2033
- Figure 2: Global Veterinary Dermatological Drugs Industry Volume Breakdown (Dosage, %) by Region 2025 & 2033
- Figure 3: North America Veterinary Dermatological Drugs Industry Revenue (Million), by Animal 2025 & 2033
- Figure 4: North America Veterinary Dermatological Drugs Industry Volume (Dosage), by Animal 2025 & 2033
- Figure 5: North America Veterinary Dermatological Drugs Industry Revenue Share (%), by Animal 2025 & 2033
- Figure 6: North America Veterinary Dermatological Drugs Industry Volume Share (%), by Animal 2025 & 2033
- Figure 7: North America Veterinary Dermatological Drugs Industry Revenue (Million), by Route Of Administration 2025 & 2033
- Figure 8: North America Veterinary Dermatological Drugs Industry Volume (Dosage), by Route Of Administration 2025 & 2033
- Figure 9: North America Veterinary Dermatological Drugs Industry Revenue Share (%), by Route Of Administration 2025 & 2033
- Figure 10: North America Veterinary Dermatological Drugs Industry Volume Share (%), by Route Of Administration 2025 & 2033
- Figure 11: North America Veterinary Dermatological Drugs Industry Revenue (Million), by Indication 2025 & 2033
- Figure 12: North America Veterinary Dermatological Drugs Industry Volume (Dosage), by Indication 2025 & 2033
- Figure 13: North America Veterinary Dermatological Drugs Industry Revenue Share (%), by Indication 2025 & 2033
- Figure 14: North America Veterinary Dermatological Drugs Industry Volume Share (%), by Indication 2025 & 2033
- Figure 15: North America Veterinary Dermatological Drugs Industry Revenue (Million), by Distribution Channel 2025 & 2033
- Figure 16: North America Veterinary Dermatological Drugs Industry Volume (Dosage), by Distribution Channel 2025 & 2033
- Figure 17: North America Veterinary Dermatological Drugs Industry Revenue Share (%), by Distribution Channel 2025 & 2033
- Figure 18: North America Veterinary Dermatological Drugs Industry Volume Share (%), by Distribution Channel 2025 & 2033
- Figure 19: North America Veterinary Dermatological Drugs Industry Revenue (Million), by Country 2025 & 2033
- Figure 20: North America Veterinary Dermatological Drugs Industry Volume (Dosage), by Country 2025 & 2033
- Figure 21: North America Veterinary Dermatological Drugs Industry Revenue Share (%), by Country 2025 & 2033
- Figure 22: North America Veterinary Dermatological Drugs Industry Volume Share (%), by Country 2025 & 2033
- Figure 23: Europe Veterinary Dermatological Drugs Industry Revenue (Million), by Animal 2025 & 2033
- Figure 24: Europe Veterinary Dermatological Drugs Industry Volume (Dosage), by Animal 2025 & 2033
- Figure 25: Europe Veterinary Dermatological Drugs Industry Revenue Share (%), by Animal 2025 & 2033
- Figure 26: Europe Veterinary Dermatological Drugs Industry Volume Share (%), by Animal 2025 & 2033
- Figure 27: Europe Veterinary Dermatological Drugs Industry Revenue (Million), by Route Of Administration 2025 & 2033
- Figure 28: Europe Veterinary Dermatological Drugs Industry Volume (Dosage), by Route Of Administration 2025 & 2033
- Figure 29: Europe Veterinary Dermatological Drugs Industry Revenue Share (%), by Route Of Administration 2025 & 2033
- Figure 30: Europe Veterinary Dermatological Drugs Industry Volume Share (%), by Route Of Administration 2025 & 2033
- Figure 31: Europe Veterinary Dermatological Drugs Industry Revenue (Million), by Indication 2025 & 2033
- Figure 32: Europe Veterinary Dermatological Drugs Industry Volume (Dosage), by Indication 2025 & 2033
- Figure 33: Europe Veterinary Dermatological Drugs Industry Revenue Share (%), by Indication 2025 & 2033
- Figure 34: Europe Veterinary Dermatological Drugs Industry Volume Share (%), by Indication 2025 & 2033
- Figure 35: Europe Veterinary Dermatological Drugs Industry Revenue (Million), by Distribution Channel 2025 & 2033
- Figure 36: Europe Veterinary Dermatological Drugs Industry Volume (Dosage), by Distribution Channel 2025 & 2033
- Figure 37: Europe Veterinary Dermatological Drugs Industry Revenue Share (%), by Distribution Channel 2025 & 2033
- Figure 38: Europe Veterinary Dermatological Drugs Industry Volume Share (%), by Distribution Channel 2025 & 2033
- Figure 39: Europe Veterinary Dermatological Drugs Industry Revenue (Million), by Country 2025 & 2033
- Figure 40: Europe Veterinary Dermatological Drugs Industry Volume (Dosage), by Country 2025 & 2033
- Figure 41: Europe Veterinary Dermatological Drugs Industry Revenue Share (%), by Country 2025 & 2033
- Figure 42: Europe Veterinary Dermatological Drugs Industry Volume Share (%), by Country 2025 & 2033
- Figure 43: Asia Pacific Veterinary Dermatological Drugs Industry Revenue (Million), by Animal 2025 & 2033
- Figure 44: Asia Pacific Veterinary Dermatological Drugs Industry Volume (Dosage), by Animal 2025 & 2033
- Figure 45: Asia Pacific Veterinary Dermatological Drugs Industry Revenue Share (%), by Animal 2025 & 2033
- Figure 46: Asia Pacific Veterinary Dermatological Drugs Industry Volume Share (%), by Animal 2025 & 2033
- Figure 47: Asia Pacific Veterinary Dermatological Drugs Industry Revenue (Million), by Route Of Administration 2025 & 2033
- Figure 48: Asia Pacific Veterinary Dermatological Drugs Industry Volume (Dosage), by Route Of Administration 2025 & 2033
- Figure 49: Asia Pacific Veterinary Dermatological Drugs Industry Revenue Share (%), by Route Of Administration 2025 & 2033
- Figure 50: Asia Pacific Veterinary Dermatological Drugs Industry Volume Share (%), by Route Of Administration 2025 & 2033
- Figure 51: Asia Pacific Veterinary Dermatological Drugs Industry Revenue (Million), by Indication 2025 & 2033
- Figure 52: Asia Pacific Veterinary Dermatological Drugs Industry Volume (Dosage), by Indication 2025 & 2033
- Figure 53: Asia Pacific Veterinary Dermatological Drugs Industry Revenue Share (%), by Indication 2025 & 2033
- Figure 54: Asia Pacific Veterinary Dermatological Drugs Industry Volume Share (%), by Indication 2025 & 2033
- Figure 55: Asia Pacific Veterinary Dermatological Drugs Industry Revenue (Million), by Distribution Channel 2025 & 2033
- Figure 56: Asia Pacific Veterinary Dermatological Drugs Industry Volume (Dosage), by Distribution Channel 2025 & 2033
- Figure 57: Asia Pacific Veterinary Dermatological Drugs Industry Revenue Share (%), by Distribution Channel 2025 & 2033
- Figure 58: Asia Pacific Veterinary Dermatological Drugs Industry Volume Share (%), by Distribution Channel 2025 & 2033
- Figure 59: Asia Pacific Veterinary Dermatological Drugs Industry Revenue (Million), by Country 2025 & 2033
- Figure 60: Asia Pacific Veterinary Dermatological Drugs Industry Volume (Dosage), by Country 2025 & 2033
- Figure 61: Asia Pacific Veterinary Dermatological Drugs Industry Revenue Share (%), by Country 2025 & 2033
- Figure 62: Asia Pacific Veterinary Dermatological Drugs Industry Volume Share (%), by Country 2025 & 2033
- Figure 63: Middle East and Africa Veterinary Dermatological Drugs Industry Revenue (Million), by Animal 2025 & 2033
- Figure 64: Middle East and Africa Veterinary Dermatological Drugs Industry Volume (Dosage), by Animal 2025 & 2033
- Figure 65: Middle East and Africa Veterinary Dermatological Drugs Industry Revenue Share (%), by Animal 2025 & 2033
- Figure 66: Middle East and Africa Veterinary Dermatological Drugs Industry Volume Share (%), by Animal 2025 & 2033
- Figure 67: Middle East and Africa Veterinary Dermatological Drugs Industry Revenue (Million), by Route Of Administration 2025 & 2033
- Figure 68: Middle East and Africa Veterinary Dermatological Drugs Industry Volume (Dosage), by Route Of Administration 2025 & 2033
- Figure 69: Middle East and Africa Veterinary Dermatological Drugs Industry Revenue Share (%), by Route Of Administration 2025 & 2033
- Figure 70: Middle East and Africa Veterinary Dermatological Drugs Industry Volume Share (%), by Route Of Administration 2025 & 2033
- Figure 71: Middle East and Africa Veterinary Dermatological Drugs Industry Revenue (Million), by Indication 2025 & 2033
- Figure 72: Middle East and Africa Veterinary Dermatological Drugs Industry Volume (Dosage), by Indication 2025 & 2033
- Figure 73: Middle East and Africa Veterinary Dermatological Drugs Industry Revenue Share (%), by Indication 2025 & 2033
- Figure 74: Middle East and Africa Veterinary Dermatological Drugs Industry Volume Share (%), by Indication 2025 & 2033
- Figure 75: Middle East and Africa Veterinary Dermatological Drugs Industry Revenue (Million), by Distribution Channel 2025 & 2033
- Figure 76: Middle East and Africa Veterinary Dermatological Drugs Industry Volume (Dosage), by Distribution Channel 2025 & 2033
- Figure 77: Middle East and Africa Veterinary Dermatological Drugs Industry Revenue Share (%), by Distribution Channel 2025 & 2033
- Figure 78: Middle East and Africa Veterinary Dermatological Drugs Industry Volume Share (%), by Distribution Channel 2025 & 2033
- Figure 79: Middle East and Africa Veterinary Dermatological Drugs Industry Revenue (Million), by Country 2025 & 2033
- Figure 80: Middle East and Africa Veterinary Dermatological Drugs Industry Volume (Dosage), by Country 2025 & 2033
- Figure 81: Middle East and Africa Veterinary Dermatological Drugs Industry Revenue Share (%), by Country 2025 & 2033
- Figure 82: Middle East and Africa Veterinary Dermatological Drugs Industry Volume Share (%), by Country 2025 & 2033
- Figure 83: South America Veterinary Dermatological Drugs Industry Revenue (Million), by Animal 2025 & 2033
- Figure 84: South America Veterinary Dermatological Drugs Industry Volume (Dosage), by Animal 2025 & 2033
- Figure 85: South America Veterinary Dermatological Drugs Industry Revenue Share (%), by Animal 2025 & 2033
- Figure 86: South America Veterinary Dermatological Drugs Industry Volume Share (%), by Animal 2025 & 2033
- Figure 87: South America Veterinary Dermatological Drugs Industry Revenue (Million), by Route Of Administration 2025 & 2033
- Figure 88: South America Veterinary Dermatological Drugs Industry Volume (Dosage), by Route Of Administration 2025 & 2033
- Figure 89: South America Veterinary Dermatological Drugs Industry Revenue Share (%), by Route Of Administration 2025 & 2033
- Figure 90: South America Veterinary Dermatological Drugs Industry Volume Share (%), by Route Of Administration 2025 & 2033
- Figure 91: South America Veterinary Dermatological Drugs Industry Revenue (Million), by Indication 2025 & 2033
- Figure 92: South America Veterinary Dermatological Drugs Industry Volume (Dosage), by Indication 2025 & 2033
- Figure 93: South America Veterinary Dermatological Drugs Industry Revenue Share (%), by Indication 2025 & 2033
- Figure 94: South America Veterinary Dermatological Drugs Industry Volume Share (%), by Indication 2025 & 2033
- Figure 95: South America Veterinary Dermatological Drugs Industry Revenue (Million), by Distribution Channel 2025 & 2033
- Figure 96: South America Veterinary Dermatological Drugs Industry Volume (Dosage), by Distribution Channel 2025 & 2033
- Figure 97: South America Veterinary Dermatological Drugs Industry Revenue Share (%), by Distribution Channel 2025 & 2033
- Figure 98: South America Veterinary Dermatological Drugs Industry Volume Share (%), by Distribution Channel 2025 & 2033
- Figure 99: South America Veterinary Dermatological Drugs Industry Revenue (Million), by Country 2025 & 2033
- Figure 100: South America Veterinary Dermatological Drugs Industry Volume (Dosage), by Country 2025 & 2033
- Figure 101: South America Veterinary Dermatological Drugs Industry Revenue Share (%), by Country 2025 & 2033
- Figure 102: South America Veterinary Dermatological Drugs Industry Volume Share (%), by Country 2025 & 2033
List of Tables
- Table 1: Global Veterinary Dermatological Drugs Industry Revenue Million Forecast, by Animal 2020 & 2033
- Table 2: Global Veterinary Dermatological Drugs Industry Volume Dosage Forecast, by Animal 2020 & 2033
- Table 3: Global Veterinary Dermatological Drugs Industry Revenue Million Forecast, by Route Of Administration 2020 & 2033
- Table 4: Global Veterinary Dermatological Drugs Industry Volume Dosage Forecast, by Route Of Administration 2020 & 2033
- Table 5: Global Veterinary Dermatological Drugs Industry Revenue Million Forecast, by Indication 2020 & 2033
- Table 6: Global Veterinary Dermatological Drugs Industry Volume Dosage Forecast, by Indication 2020 & 2033
- Table 7: Global Veterinary Dermatological Drugs Industry Revenue Million Forecast, by Distribution Channel 2020 & 2033
- Table 8: Global Veterinary Dermatological Drugs Industry Volume Dosage Forecast, by Distribution Channel 2020 & 2033
- Table 9: Global Veterinary Dermatological Drugs Industry Revenue Million Forecast, by Region 2020 & 2033
- Table 10: Global Veterinary Dermatological Drugs Industry Volume Dosage Forecast, by Region 2020 & 2033
- Table 11: Global Veterinary Dermatological Drugs Industry Revenue Million Forecast, by Animal 2020 & 2033
- Table 12: Global Veterinary Dermatological Drugs Industry Volume Dosage Forecast, by Animal 2020 & 2033
- Table 13: Global Veterinary Dermatological Drugs Industry Revenue Million Forecast, by Route Of Administration 2020 & 2033
- Table 14: Global Veterinary Dermatological Drugs Industry Volume Dosage Forecast, by Route Of Administration 2020 & 2033
- Table 15: Global Veterinary Dermatological Drugs Industry Revenue Million Forecast, by Indication 2020 & 2033
- Table 16: Global Veterinary Dermatological Drugs Industry Volume Dosage Forecast, by Indication 2020 & 2033
- Table 17: Global Veterinary Dermatological Drugs Industry Revenue Million Forecast, by Distribution Channel 2020 & 2033
- Table 18: Global Veterinary Dermatological Drugs Industry Volume Dosage Forecast, by Distribution Channel 2020 & 2033
- Table 19: Global Veterinary Dermatological Drugs Industry Revenue Million Forecast, by Country 2020 & 2033
- Table 20: Global Veterinary Dermatological Drugs Industry Volume Dosage Forecast, by Country 2020 & 2033
- Table 21: United States Veterinary Dermatological Drugs Industry Revenue (Million) Forecast, by Application 2020 & 2033
- Table 22: United States Veterinary Dermatological Drugs Industry Volume (Dosage) Forecast, by Application 2020 & 2033
- Table 23: Canada Veterinary Dermatological Drugs Industry Revenue (Million) Forecast, by Application 2020 & 2033
- Table 24: Canada Veterinary Dermatological Drugs Industry Volume (Dosage) Forecast, by Application 2020 & 2033
- Table 25: Mexico Veterinary Dermatological Drugs Industry Revenue (Million) Forecast, by Application 2020 & 2033
- Table 26: Mexico Veterinary Dermatological Drugs Industry Volume (Dosage) Forecast, by Application 2020 & 2033
- Table 27: Global Veterinary Dermatological Drugs Industry Revenue Million Forecast, by Animal 2020 & 2033
- Table 28: Global Veterinary Dermatological Drugs Industry Volume Dosage Forecast, by Animal 2020 & 2033
- Table 29: Global Veterinary Dermatological Drugs Industry Revenue Million Forecast, by Route Of Administration 2020 & 2033
- Table 30: Global Veterinary Dermatological Drugs Industry Volume Dosage Forecast, by Route Of Administration 2020 & 2033
- Table 31: Global Veterinary Dermatological Drugs Industry Revenue Million Forecast, by Indication 2020 & 2033
- Table 32: Global Veterinary Dermatological Drugs Industry Volume Dosage Forecast, by Indication 2020 & 2033
- Table 33: Global Veterinary Dermatological Drugs Industry Revenue Million Forecast, by Distribution Channel 2020 & 2033
- Table 34: Global Veterinary Dermatological Drugs Industry Volume Dosage Forecast, by Distribution Channel 2020 & 2033
- Table 35: Global Veterinary Dermatological Drugs Industry Revenue Million Forecast, by Country 2020 & 2033
- Table 36: Global Veterinary Dermatological Drugs Industry Volume Dosage Forecast, by Country 2020 & 2033
- Table 37: United Kingdom Veterinary Dermatological Drugs Industry Revenue (Million) Forecast, by Application 2020 & 2033
- Table 38: United Kingdom Veterinary Dermatological Drugs Industry Volume (Dosage) Forecast, by Application 2020 & 2033
- Table 39: France Veterinary Dermatological Drugs Industry Revenue (Million) Forecast, by Application 2020 & 2033
- Table 40: France Veterinary Dermatological Drugs Industry Volume (Dosage) Forecast, by Application 2020 & 2033
- Table 41: Germany Veterinary Dermatological Drugs Industry Revenue (Million) Forecast, by Application 2020 & 2033
- Table 42: Germany Veterinary Dermatological Drugs Industry Volume (Dosage) Forecast, by Application 2020 & 2033
- Table 43: Italy Veterinary Dermatological Drugs Industry Revenue (Million) Forecast, by Application 2020 & 2033
- Table 44: Italy Veterinary Dermatological Drugs Industry Volume (Dosage) Forecast, by Application 2020 & 2033
- Table 45: Spain Veterinary Dermatological Drugs Industry Revenue (Million) Forecast, by Application 2020 & 2033
- Table 46: Spain Veterinary Dermatological Drugs Industry Volume (Dosage) Forecast, by Application 2020 & 2033
- Table 47: Rest of Europe Veterinary Dermatological Drugs Industry Revenue (Million) Forecast, by Application 2020 & 2033
- Table 48: Rest of Europe Veterinary Dermatological Drugs Industry Volume (Dosage) Forecast, by Application 2020 & 2033
- Table 49: Global Veterinary Dermatological Drugs Industry Revenue Million Forecast, by Animal 2020 & 2033
- Table 50: Global Veterinary Dermatological Drugs Industry Volume Dosage Forecast, by Animal 2020 & 2033
- Table 51: Global Veterinary Dermatological Drugs Industry Revenue Million Forecast, by Route Of Administration 2020 & 2033
- Table 52: Global Veterinary Dermatological Drugs Industry Volume Dosage Forecast, by Route Of Administration 2020 & 2033
- Table 53: Global Veterinary Dermatological Drugs Industry Revenue Million Forecast, by Indication 2020 & 2033
- Table 54: Global Veterinary Dermatological Drugs Industry Volume Dosage Forecast, by Indication 2020 & 2033
- Table 55: Global Veterinary Dermatological Drugs Industry Revenue Million Forecast, by Distribution Channel 2020 & 2033
- Table 56: Global Veterinary Dermatological Drugs Industry Volume Dosage Forecast, by Distribution Channel 2020 & 2033
- Table 57: Global Veterinary Dermatological Drugs Industry Revenue Million Forecast, by Country 2020 & 2033
- Table 58: Global Veterinary Dermatological Drugs Industry Volume Dosage Forecast, by Country 2020 & 2033
- Table 59: India Veterinary Dermatological Drugs Industry Revenue (Million) Forecast, by Application 2020 & 2033
- Table 60: India Veterinary Dermatological Drugs Industry Volume (Dosage) Forecast, by Application 2020 & 2033
- Table 61: China Veterinary Dermatological Drugs Industry Revenue (Million) Forecast, by Application 2020 & 2033
- Table 62: China Veterinary Dermatological Drugs Industry Volume (Dosage) Forecast, by Application 2020 & 2033
- Table 63: Japan Veterinary Dermatological Drugs Industry Revenue (Million) Forecast, by Application 2020 & 2033
- Table 64: Japan Veterinary Dermatological Drugs Industry Volume (Dosage) Forecast, by Application 2020 & 2033
- Table 65: Australia Veterinary Dermatological Drugs Industry Revenue (Million) Forecast, by Application 2020 & 2033
- Table 66: Australia Veterinary Dermatological Drugs Industry Volume (Dosage) Forecast, by Application 2020 & 2033
- Table 67: South Korea Veterinary Dermatological Drugs Industry Revenue (Million) Forecast, by Application 2020 & 2033
- Table 68: South Korea Veterinary Dermatological Drugs Industry Volume (Dosage) Forecast, by Application 2020 & 2033
- Table 69: Rest of Asia Pacific Veterinary Dermatological Drugs Industry Revenue (Million) Forecast, by Application 2020 & 2033
- Table 70: Rest of Asia Pacific Veterinary Dermatological Drugs Industry Volume (Dosage) Forecast, by Application 2020 & 2033
- Table 71: Global Veterinary Dermatological Drugs Industry Revenue Million Forecast, by Animal 2020 & 2033
- Table 72: Global Veterinary Dermatological Drugs Industry Volume Dosage Forecast, by Animal 2020 & 2033
- Table 73: Global Veterinary Dermatological Drugs Industry Revenue Million Forecast, by Route Of Administration 2020 & 2033
- Table 74: Global Veterinary Dermatological Drugs Industry Volume Dosage Forecast, by Route Of Administration 2020 & 2033
- Table 75: Global Veterinary Dermatological Drugs Industry Revenue Million Forecast, by Indication 2020 & 2033
- Table 76: Global Veterinary Dermatological Drugs Industry Volume Dosage Forecast, by Indication 2020 & 2033
- Table 77: Global Veterinary Dermatological Drugs Industry Revenue Million Forecast, by Distribution Channel 2020 & 2033
- Table 78: Global Veterinary Dermatological Drugs Industry Volume Dosage Forecast, by Distribution Channel 2020 & 2033
- Table 79: Global Veterinary Dermatological Drugs Industry Revenue Million Forecast, by Country 2020 & 2033
- Table 80: Global Veterinary Dermatological Drugs Industry Volume Dosage Forecast, by Country 2020 & 2033
- Table 81: GCC Veterinary Dermatological Drugs Industry Revenue (Million) Forecast, by Application 2020 & 2033
- Table 82: GCC Veterinary Dermatological Drugs Industry Volume (Dosage) Forecast, by Application 2020 & 2033
- Table 83: South Africa Veterinary Dermatological Drugs Industry Revenue (Million) Forecast, by Application 2020 & 2033
- Table 84: South Africa Veterinary Dermatological Drugs Industry Volume (Dosage) Forecast, by Application 2020 & 2033
- Table 85: Rest of Middle East and Africa Veterinary Dermatological Drugs Industry Revenue (Million) Forecast, by Application 2020 & 2033
- Table 86: Rest of Middle East and Africa Veterinary Dermatological Drugs Industry Volume (Dosage) Forecast, by Application 2020 & 2033
- Table 87: Global Veterinary Dermatological Drugs Industry Revenue Million Forecast, by Animal 2020 & 2033
- Table 88: Global Veterinary Dermatological Drugs Industry Volume Dosage Forecast, by Animal 2020 & 2033
- Table 89: Global Veterinary Dermatological Drugs Industry Revenue Million Forecast, by Route Of Administration 2020 & 2033
- Table 90: Global Veterinary Dermatological Drugs Industry Volume Dosage Forecast, by Route Of Administration 2020 & 2033
- Table 91: Global Veterinary Dermatological Drugs Industry Revenue Million Forecast, by Indication 2020 & 2033
- Table 92: Global Veterinary Dermatological Drugs Industry Volume Dosage Forecast, by Indication 2020 & 2033
- Table 93: Global Veterinary Dermatological Drugs Industry Revenue Million Forecast, by Distribution Channel 2020 & 2033
- Table 94: Global Veterinary Dermatological Drugs Industry Volume Dosage Forecast, by Distribution Channel 2020 & 2033
- Table 95: Global Veterinary Dermatological Drugs Industry Revenue Million Forecast, by Country 2020 & 2033
- Table 96: Global Veterinary Dermatological Drugs Industry Volume Dosage Forecast, by Country 2020 & 2033
- Table 97: Brazil Veterinary Dermatological Drugs Industry Revenue (Million) Forecast, by Application 2020 & 2033
- Table 98: Brazil Veterinary Dermatological Drugs Industry Volume (Dosage) Forecast, by Application 2020 & 2033
- Table 99: Argentina Veterinary Dermatological Drugs Industry Revenue (Million) Forecast, by Application 2020 & 2033
- Table 100: Argentina Veterinary Dermatological Drugs Industry Volume (Dosage) Forecast, by Application 2020 & 2033
- Table 101: Rest of South America Veterinary Dermatological Drugs Industry Revenue (Million) Forecast, by Application 2020 & 2033
- Table 102: Rest of South America Veterinary Dermatological Drugs Industry Volume (Dosage) Forecast, by Application 2020 & 2033
Frequently Asked Questions
1. What is the projected Compound Annual Growth Rate (CAGR) of the Veterinary Dermatological Drugs Industry?
The projected CAGR is approximately 7.11%.
2. Which companies are prominent players in the Veterinary Dermatological Drugs Industry?
Key companies in the market include Elanco, Merk & Co Inc, Ceva, Vivaldis, Leti Pharma, Mars Incorporated, Indian Immunologicals Ltd, Bimeda Inc, Virbac, Bioiberica S A U, Zoetis Inc.
3. What are the main segments of the Veterinary Dermatological Drugs Industry?
The market segments include Animal, Route Of Administration, Indication, Distribution Channel.
4. Can you provide details about the market size?
The market size is estimated to be USD 6.38 Million as of 2022.
5. What are some drivers contributing to market growth?
Increasing Burden of Dermatological Diseases in Pets; Increasing Pet adoption and Animal Care.
6. What are the notable trends driving market growth?
Companion Animal Segment is Expected to have Significant Growth Over the Forecast period.
7. Are there any restraints impacting market growth?
Low availability and Lack of awareness of the drugs.
8. Can you provide examples of recent developments in the market?
In June 2023: Zoetis Announced FDA Approval of Apoquel® Chewable (oclacitinib chewable tablet) for Control of Pruritus Associated With Allergic Dermatitis and Control of Atopic Dermatitis in Dogs
9. What pricing options are available for accessing the report?
Pricing options include single-user, multi-user, and enterprise licenses priced at USD 4750, USD 5250, and USD 8750 respectively.
10. Is the market size provided in terms of value or volume?
The market size is provided in terms of value, measured in Million and volume, measured in Dosage.
11. Are there any specific market keywords associated with the report?
Yes, the market keyword associated with the report is "Veterinary Dermatological Drugs Industry," which aids in identifying and referencing the specific market segment covered.
12. How do I determine which pricing option suits my needs best?
The pricing options vary based on user requirements and access needs. Individual users may opt for single-user licenses, while businesses requiring broader access may choose multi-user or enterprise licenses for cost-effective access to the report.
13. Are there any additional resources or data provided in the Veterinary Dermatological Drugs Industry report?
While the report offers comprehensive insights, it's advisable to review the specific contents or supplementary materials provided to ascertain if additional resources or data are available.
14. How can I stay updated on further developments or reports in the Veterinary Dermatological Drugs Industry?
To stay informed about further developments, trends, and reports in the Veterinary Dermatological Drugs Industry, consider subscribing to industry newsletters, following relevant companies and organizations, or regularly checking reputable industry news sources and publications.
Methodology
Step 1 - Identification of Relevant Samples Size from Population Database


Step 2 - Approaches for Defining Global Market Size (Value, Volume* & Price*)

Note*: In applicable scenarios
Step 3 - Data Sources
Primary Research
- Web Analytics
- Survey Reports
- Research Institute
- Latest Research Reports
- Opinion Leaders
Secondary Research
- Annual Reports
- White Paper
- Latest Press Release
- Industry Association
- Paid Database
- Investor Presentations

Step 4 - Data Triangulation
Involves using different sources of information in order to increase the validity of a study
These sources are likely to be stakeholders in a program - participants, other researchers, program staff, other community members, and so on.
Then we put all data in single framework & apply various statistical tools to find out the dynamic on the market.
During the analysis stage, feedback from the stakeholder groups would be compared to determine areas of agreement as well as areas of divergence