

Key Insights
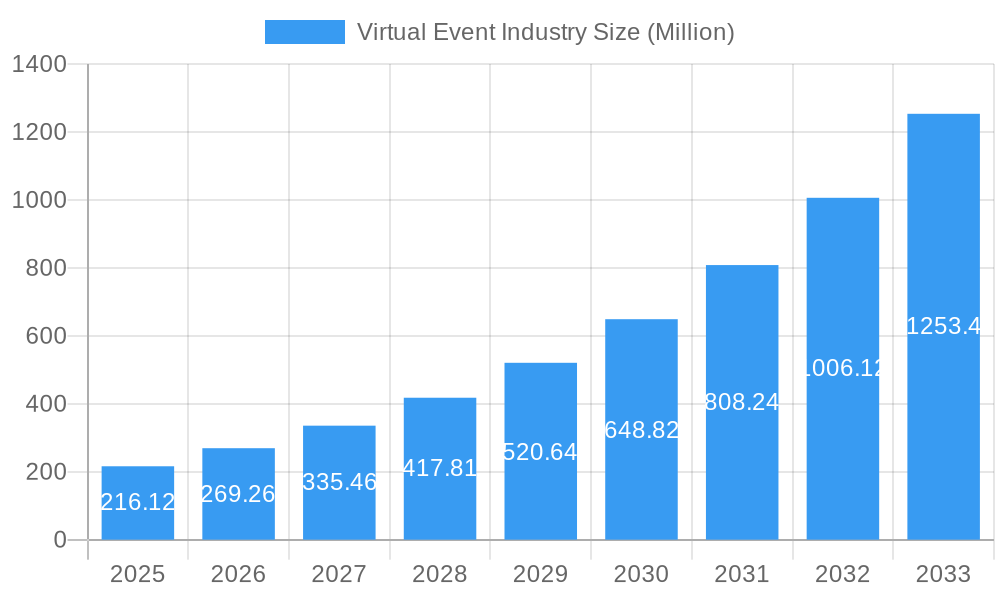
The virtual event industry is experiencing explosive growth, projected to reach a market size of $216.12 million in 2025, exhibiting a remarkable Compound Annual Growth Rate (CAGR) of 24.92%. This surge is driven by several key factors. The increasing adoption of digital technologies across various sectors, particularly in education and enterprise, fuels demand for cost-effective and geographically accessible virtual events. Furthermore, the inherent scalability and flexibility of virtual platforms allow for wider audience reach and enhanced engagement compared to traditional in-person events. The industry's segmentation across service types (communication, recruitment, sales & marketing, training) and applications (conferences, exhibitions, summits) reflects its diverse utility and adaptability. Leading players like Zoom, Cvent, and 6Connex are capitalizing on this growth, continually innovating to improve user experience and expand functionality. The geographic distribution demonstrates a strong North American presence, but significant growth potential exists in the Asia-Pacific region, driven by increasing internet penetration and technological advancements.
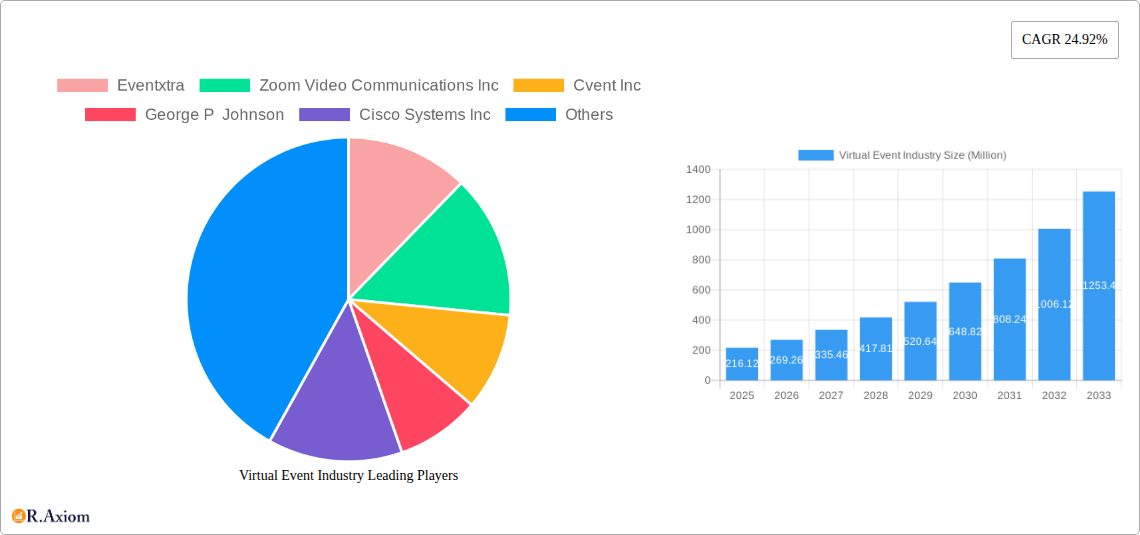
Virtual Event Industry Market Size (In Million)
Sustained growth throughout the forecast period (2025-2033) is anticipated, propelled by ongoing technological advancements such as enhanced virtual reality (VR) and augmented reality (AR) integration. These developments will further enhance audience immersion and interaction. The continued focus on improving accessibility and inclusivity in event participation will also drive growth. However, potential challenges exist, such as ensuring robust cybersecurity and mitigating potential technical glitches. Overcoming these obstacles and fostering trust in the reliability of virtual platforms will be crucial for continued market expansion. Competition among existing players and the emergence of new entrants will necessitate ongoing innovation and strategic partnerships to maintain a competitive edge in this dynamic market landscape. Effective marketing and branding will be vital to attract and retain both event organizers and participants.
Virtual Event Industry Company Market Share
Virtual Event Industry Market Report: 2019-2033
This comprehensive report provides an in-depth analysis of the global virtual event industry, projecting a market valuation exceeding $XX Million by 2033. The study covers the period from 2019 to 2033, with 2025 as the base and estimated year. It offers actionable insights into market dynamics, key players, emerging trends, and future growth opportunities, enabling stakeholders to make informed strategic decisions.
Virtual Event Industry Market Concentration & Innovation
The virtual event industry exhibits a moderately concentrated market structure, with several major players holding significant market share. Companies such as Zoom Video Communications Inc, Cvent Inc, and 6Connex International sp z o o, control a substantial portion of the market, while numerous smaller players contribute to the overall landscape. Market share data for 2024 indicates Zoom holds approximately xx%, Cvent xx%, and 6Connex xx%, while the remaining share is distributed among other players including Eventxtra, George P Johnson, Cisco Systems Inc, GES, Alive Events Agency, Avaya LLC, Arkadin Cloud Communications, and ALE International. Innovation is driven by advancements in video conferencing technology, immersive experiences (like the metaverse), and AI-powered features for attendee engagement and analytics. Regulatory frameworks focusing on data privacy and security significantly influence market practices. Product substitutes include traditional in-person events, but the increasing preference for virtual events due to cost-effectiveness and accessibility is limiting their impact. The industry witnesses frequent M&A activities, with deal values exceeding $XX Million annually in recent years. For instance, the acquisition of [Company A] by [Company B] in [Year] valued at $XX Million exemplifies the industry’s consolidation trend.
- Key Market Drivers: Technological advancements, cost-effectiveness, increased accessibility
- Key Challenges: Data security concerns, competition from established players, and evolving technological landscape.
- Key M&A Activities: xx major deals exceeding $XX Million each in the last five years.
Virtual Event Industry Industry Trends & Insights
The virtual event industry exhibits robust growth, with a projected Compound Annual Growth Rate (CAGR) of xx% from 2025 to 2033. This growth is propelled by several factors, including the increasing adoption of virtual events by various end-user industries (Educational Institutions, Enterprise, Organizations, etc.), cost savings compared to physical events, and the ability to reach a wider global audience. Technological disruptions, such as the rise of the metaverse and enhanced virtual reality (VR) and augmented reality (AR) integration, are transforming the industry landscape, fostering immersive and interactive experiences. Consumer preference is shifting towards more engaging and personalized virtual events, demanding sophisticated platforms and features. The competitive dynamics are characterized by intense rivalry among established players and the emergence of innovative startups. Market penetration of virtual events across various sectors is steadily increasing, with xx% of businesses now incorporating them into their strategies. The shift to hybrid event models, combining both virtual and physical elements, is gaining significant traction, further driving industry growth.
Dominant Markets & Segments in Virtual Event Industry
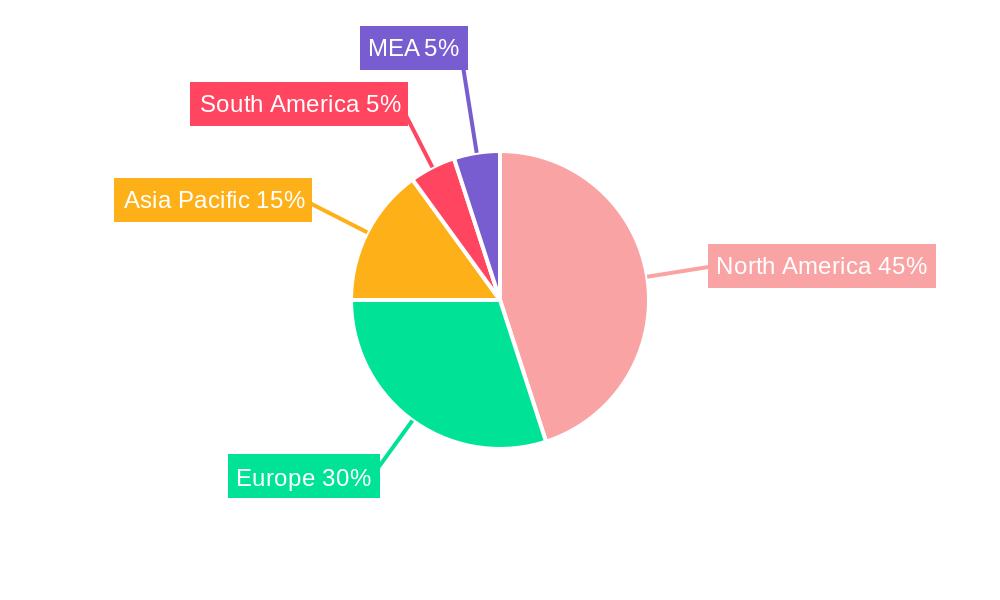
The North American region currently dominates the virtual event market, driven by robust technological infrastructure, high internet penetration, and a significant concentration of key players. However, Asia-Pacific is poised for rapid growth due to increasing internet access and a burgeoning tech-savvy population. Among segments, the "Communication" service type holds the largest market share, followed by "Sales & Marketing" and "Training." Conferences and exhibitions/trade shows constitute the highest demand application areas. Enterprise end-users form the largest segment, followed by educational institutions and other organizations.
- Key Drivers of North American Dominance: Advanced technological infrastructure, high internet penetration, presence of major players.
- Key Drivers of Asia-Pacific Growth: Increasing internet penetration, growing tech-savvy population, cost advantages.
- High-growth segments: Sales & Marketing virtual events and the use of virtual events in the Training sector.
Virtual Event Industry Product Developments
Recent product innovations focus on enhancing interactivity, engagement, and analytics within virtual event platforms. Features such as advanced networking tools, gamification, AI-powered chatbots, and comprehensive data analytics dashboards are becoming standard. These enhancements cater to evolving user preferences and maximize the return on investment for event organizers. The integration of VR/AR technologies offers immersive experiences, while advancements in broadcasting technology enable seamless high-quality streaming across multiple platforms.
Report Scope & Segmentation Analysis
This report segments the virtual event industry by service type (Communication, Recruitment, Sales & Marketing, Training), application (Conferences, Exhibitions/Trade Shows, Summits, Others), and end-user industry (Educational Institutions, Enterprise, Organizations, Other End-User Industries). Growth projections, market sizes, and competitive dynamics are analyzed for each segment. The Communication segment is expected to maintain its dominance with a CAGR of xx%, driven by the growing adoption of virtual communication tools across various industries. The Training and Sales & Marketing segments also exhibit significant growth potential due to the increasing need for remote learning and virtual sales strategies.
Key Drivers of Virtual Event Industry Growth
The virtual event industry's growth is propelled by several factors. Technological advancements, such as improved video conferencing and interactive features, enhance user experience. Cost savings compared to physical events make virtual events an attractive alternative for businesses of all sizes. The ability to reach a global audience expands market reach. Moreover, favorable government policies promoting digitalization in some regions further fuel the market’s expansion.
Challenges in the Virtual Event Industry Sector
Significant challenges include ensuring robust cybersecurity measures and data privacy to counter potential breaches. Maintaining attendee engagement and creating a sense of community in a virtual environment requires creative solutions. Intense competition among numerous providers presents a challenge for smaller players. The digital divide in certain regions also limits market penetration, creating accessibility barriers.
Emerging Opportunities in Virtual Event Industry
The metaverse presents a significant opportunity, offering immersive virtual experiences. The integration of AI and machine learning for personalized event experiences will drive innovation. Hybrid event models combining virtual and in-person elements cater to diverse needs. Expansion into untapped markets, especially in developing economies, represents considerable growth potential.
Leading Players in the Virtual Event Industry Market
- Eventxtra
- Zoom Video Communications Inc
- Cvent Inc
- George P Johnson
- Cisco Systems Inc
- 6Connex International sp z o o
- GES
- Alive Events Agency
- Avaya LLC
- Arkadin Cloud Communications
- ALE International
Key Developments in Virtual Event Industry Industry
- October 2022: Zoom launched 'Zoom Events' in India, offering customizable virtual event capabilities.
- May 2023: VOSMOS launched VOSMOS.Events, a platform for user-created virtual events, targeting individuals and organizations of various sizes.
Strategic Outlook for Virtual Event Industry Market
The virtual event industry is poised for sustained growth, driven by continuous technological innovation and evolving consumer preferences. The expanding adoption of hybrid event models and the potential of the metaverse will shape the industry's future. Focusing on enhanced user experiences, personalized content, and seamless integration across platforms will be crucial for success in this dynamic market. The market is expected to reach $XX Million by 2033, presenting significant opportunities for established players and new entrants alike.
Virtual Event Industry Segmentation
-
1. Service Type
- 1.1. Communication
- 1.2. Recruitment
- 1.3. Sales and Marketing
- 1.4. Training
-
2. Application
- 2.1. Conferences
- 2.2. Exhibitions/Trade Shows
- 2.3. Summits
- 2.4. Other Applications
-
3. End-User Industry
- 3.1. Educational Institutions
- 3.2. Enterprise
- 3.3. Organizations
- 3.4. Other End-User Industries
Virtual Event Industry Segmentation By Geography
- 1. North America
- 2. Europe
- 3. Asia
- 4. Australia and New Zealand
- 5. Latin America
- 6. Middle East and Africa
Virtual Event Industry Regional Market Share
Geographic Coverage of Virtual Event Industry
Virtual Event Industry REPORT HIGHLIGHTS
| Aspects | Details |
|---|---|
| Study Period | 2020-2034 |
| Base Year | 2025 |
| Estimated Year | 2026 |
| Forecast Period | 2026-2034 |
| Historical Period | 2020-2025 |
| Growth Rate | CAGR of 24.92% from 2020-2034 |
| Segmentation |
|
Table of Contents
- 1. Introduction
- 1.1. Research Scope
- 1.2. Market Segmentation
- 1.3. Research Objective
- 1.4. Definitions and Assumptions
- 2. Executive Summary
- 2.1. Market Snapshot
- 3. Market Dynamics
- 3.1. Market Drivers
- 3.2. Market Restrains
- 3.3. Market Trends
- 3.4. Market Opportunities
- 4. Market Factor Analysis
- 4.1. Porters Five Forces
- 4.1.1. Bargaining Power of Suppliers
- 4.1.2. Bargaining Power of Buyers
- 4.1.3. Threat of New Entrants
- 4.1.4. Threat of Substitutes
- 4.1.5. Competitive Rivalry
- 4.2. PESTEL analysis
- 4.3. BCG Analysis
- 4.3.1. Stars (High Growth, High Market Share)
- 4.3.2. Cash Cows (Low Growth, High Market Share)
- 4.3.3. Question Mark (High Growth, Low Market Share)
- 4.3.4. Dogs (Low Growth, Low Market Share)
- 4.4. Ansoff Matrix Analysis
- 4.5. Supply Chain Analysis
- 4.6. Regulatory Landscape
- 4.7. Current Market Potential and Opportunity Assessment (TAM–SAM–SOM Framework)
- 4.8. RAX Analyst Note
- 4.1. Porters Five Forces
- 5. Market Analysis, Insights and Forecast 2021-2033
- 5.1. Market Analysis, Insights and Forecast - by Service Type
- 5.1.1. Communication
- 5.1.2. Recruitment
- 5.1.3. Sales and Marketing
- 5.1.4. Training
- 5.2. Market Analysis, Insights and Forecast - by Application
- 5.2.1. Conferences
- 5.2.2. Exhibitions/Trade Shows
- 5.2.3. Summits
- 5.2.4. Other Applications
- 5.3. Market Analysis, Insights and Forecast - by End-User Industry
- 5.3.1. Educational Institutions
- 5.3.2. Enterprise
- 5.3.3. Organizations
- 5.3.4. Other End-User Industries
- 5.4. Market Analysis, Insights and Forecast - by Region
- 5.4.1. North America
- 5.4.2. Europe
- 5.4.3. Asia
- 5.4.4. Australia and New Zealand
- 5.4.5. Latin America
- 5.4.6. Middle East and Africa
- 5.1. Market Analysis, Insights and Forecast - by Service Type
- 6. Global Virtual Event Industry Analysis, Insights and Forecast, 2021-2033
- 6.1. Market Analysis, Insights and Forecast - by Service Type
- 6.1.1. Communication
- 6.1.2. Recruitment
- 6.1.3. Sales and Marketing
- 6.1.4. Training
- 6.2. Market Analysis, Insights and Forecast - by Application
- 6.2.1. Conferences
- 6.2.2. Exhibitions/Trade Shows
- 6.2.3. Summits
- 6.2.4. Other Applications
- 6.3. Market Analysis, Insights and Forecast - by End-User Industry
- 6.3.1. Educational Institutions
- 6.3.2. Enterprise
- 6.3.3. Organizations
- 6.3.4. Other End-User Industries
- 6.1. Market Analysis, Insights and Forecast - by Service Type
- 7. North America Virtual Event Industry Analysis, Insights and Forecast, 2020-2032
- 7.1. Market Analysis, Insights and Forecast - by Service Type
- 7.1.1. Communication
- 7.1.2. Recruitment
- 7.1.3. Sales and Marketing
- 7.1.4. Training
- 7.2. Market Analysis, Insights and Forecast - by Application
- 7.2.1. Conferences
- 7.2.2. Exhibitions/Trade Shows
- 7.2.3. Summits
- 7.2.4. Other Applications
- 7.3. Market Analysis, Insights and Forecast - by End-User Industry
- 7.3.1. Educational Institutions
- 7.3.2. Enterprise
- 7.3.3. Organizations
- 7.3.4. Other End-User Industries
- 7.1. Market Analysis, Insights and Forecast - by Service Type
- 8. Europe Virtual Event Industry Analysis, Insights and Forecast, 2020-2032
- 8.1. Market Analysis, Insights and Forecast - by Service Type
- 8.1.1. Communication
- 8.1.2. Recruitment
- 8.1.3. Sales and Marketing
- 8.1.4. Training
- 8.2. Market Analysis, Insights and Forecast - by Application
- 8.2.1. Conferences
- 8.2.2. Exhibitions/Trade Shows
- 8.2.3. Summits
- 8.2.4. Other Applications
- 8.3. Market Analysis, Insights and Forecast - by End-User Industry
- 8.3.1. Educational Institutions
- 8.3.2. Enterprise
- 8.3.3. Organizations
- 8.3.4. Other End-User Industries
- 8.1. Market Analysis, Insights and Forecast - by Service Type
- 9. Asia Virtual Event Industry Analysis, Insights and Forecast, 2020-2032
- 9.1. Market Analysis, Insights and Forecast - by Service Type
- 9.1.1. Communication
- 9.1.2. Recruitment
- 9.1.3. Sales and Marketing
- 9.1.4. Training
- 9.2. Market Analysis, Insights and Forecast - by Application
- 9.2.1. Conferences
- 9.2.2. Exhibitions/Trade Shows
- 9.2.3. Summits
- 9.2.4. Other Applications
- 9.3. Market Analysis, Insights and Forecast - by End-User Industry
- 9.3.1. Educational Institutions
- 9.3.2. Enterprise
- 9.3.3. Organizations
- 9.3.4. Other End-User Industries
- 9.1. Market Analysis, Insights and Forecast - by Service Type
- 10. Australia and New Zealand Virtual Event Industry Analysis, Insights and Forecast, 2020-2032
- 10.1. Market Analysis, Insights and Forecast - by Service Type
- 10.1.1. Communication
- 10.1.2. Recruitment
- 10.1.3. Sales and Marketing
- 10.1.4. Training
- 10.2. Market Analysis, Insights and Forecast - by Application
- 10.2.1. Conferences
- 10.2.2. Exhibitions/Trade Shows
- 10.2.3. Summits
- 10.2.4. Other Applications
- 10.3. Market Analysis, Insights and Forecast - by End-User Industry
- 10.3.1. Educational Institutions
- 10.3.2. Enterprise
- 10.3.3. Organizations
- 10.3.4. Other End-User Industries
- 10.1. Market Analysis, Insights and Forecast - by Service Type
- 11. Latin America Virtual Event Industry Analysis, Insights and Forecast, 2020-2032
- 11.1. Market Analysis, Insights and Forecast - by Service Type
- 11.1.1. Communication
- 11.1.2. Recruitment
- 11.1.3. Sales and Marketing
- 11.1.4. Training
- 11.2. Market Analysis, Insights and Forecast - by Application
- 11.2.1. Conferences
- 11.2.2. Exhibitions/Trade Shows
- 11.2.3. Summits
- 11.2.4. Other Applications
- 11.3. Market Analysis, Insights and Forecast - by End-User Industry
- 11.3.1. Educational Institutions
- 11.3.2. Enterprise
- 11.3.3. Organizations
- 11.3.4. Other End-User Industries
- 11.1. Market Analysis, Insights and Forecast - by Service Type
- 12. Middle East and Africa Virtual Event Industry Analysis, Insights and Forecast, 2020-2032
- 12.1. Market Analysis, Insights and Forecast - by Service Type
- 12.1.1. Communication
- 12.1.2. Recruitment
- 12.1.3. Sales and Marketing
- 12.1.4. Training
- 12.2. Market Analysis, Insights and Forecast - by Application
- 12.2.1. Conferences
- 12.2.2. Exhibitions/Trade Shows
- 12.2.3. Summits
- 12.2.4. Other Applications
- 12.3. Market Analysis, Insights and Forecast - by End-User Industry
- 12.3.1. Educational Institutions
- 12.3.2. Enterprise
- 12.3.3. Organizations
- 12.3.4. Other End-User Industries
- 12.1. Market Analysis, Insights and Forecast - by Service Type
- 13. Competitive Analysis
- 13.1. Company Profiles
- 13.1.1 Eventxtra
- 13.1.1.1. Company Overview
- 13.1.1.2. Products
- 13.1.1.3. Company Financials
- 13.1.1.4. SWOT Analysis
- 13.1.2 Zoom Video Communications Inc
- 13.1.2.1. Company Overview
- 13.1.2.2. Products
- 13.1.2.3. Company Financials
- 13.1.2.4. SWOT Analysis
- 13.1.3 Cvent Inc
- 13.1.3.1. Company Overview
- 13.1.3.2. Products
- 13.1.3.3. Company Financials
- 13.1.3.4. SWOT Analysis
- 13.1.4 George P Johnson
- 13.1.4.1. Company Overview
- 13.1.4.2. Products
- 13.1.4.3. Company Financials
- 13.1.4.4. SWOT Analysis
- 13.1.5 Cisco Systems Inc
- 13.1.5.1. Company Overview
- 13.1.5.2. Products
- 13.1.5.3. Company Financials
- 13.1.5.4. SWOT Analysis
- 13.1.6 6Connex International sp z o o
- 13.1.6.1. Company Overview
- 13.1.6.2. Products
- 13.1.6.3. Company Financials
- 13.1.6.4. SWOT Analysis
- 13.1.7 GES*List Not Exhaustive
- 13.1.7.1. Company Overview
- 13.1.7.2. Products
- 13.1.7.3. Company Financials
- 13.1.7.4. SWOT Analysis
- 13.1.8 Alive Events Agency
- 13.1.8.1. Company Overview
- 13.1.8.2. Products
- 13.1.8.3. Company Financials
- 13.1.8.4. SWOT Analysis
- 13.1.9 Avaya LLC
- 13.1.9.1. Company Overview
- 13.1.9.2. Products
- 13.1.9.3. Company Financials
- 13.1.9.4. SWOT Analysis
- 13.1.10 Arkadin Cloud Communications
- 13.1.10.1. Company Overview
- 13.1.10.2. Products
- 13.1.10.3. Company Financials
- 13.1.10.4. SWOT Analysis
- 13.1.11 ALE International
- 13.1.11.1. Company Overview
- 13.1.11.2. Products
- 13.1.11.3. Company Financials
- 13.1.11.4. SWOT Analysis
- 13.1.1 Eventxtra
- 13.2. Market Entropy
- 13.2.1 Company's Key Areas Served
- 13.2.2 Recent Developments
- 13.3. Company Market Share Analysis 2025
- 13.3.1 Top 5 Companies Market Share Analysis
- 13.3.2 Top 3 Companies Market Share Analysis
- 13.4. List of Potential Customers
- 14. Research Methodology
List of Figures
- Figure 1: Global Virtual Event Industry Revenue Breakdown (Million, %) by Region 2025 & 2033
- Figure 2: North America Virtual Event Industry Revenue (Million), by Service Type 2025 & 2033
- Figure 3: North America Virtual Event Industry Revenue Share (%), by Service Type 2025 & 2033
- Figure 4: North America Virtual Event Industry Revenue (Million), by Application 2025 & 2033
- Figure 5: North America Virtual Event Industry Revenue Share (%), by Application 2025 & 2033
- Figure 6: North America Virtual Event Industry Revenue (Million), by End-User Industry 2025 & 2033
- Figure 7: North America Virtual Event Industry Revenue Share (%), by End-User Industry 2025 & 2033
- Figure 8: North America Virtual Event Industry Revenue (Million), by Country 2025 & 2033
- Figure 9: North America Virtual Event Industry Revenue Share (%), by Country 2025 & 2033
- Figure 10: Europe Virtual Event Industry Revenue (Million), by Service Type 2025 & 2033
- Figure 11: Europe Virtual Event Industry Revenue Share (%), by Service Type 2025 & 2033
- Figure 12: Europe Virtual Event Industry Revenue (Million), by Application 2025 & 2033
- Figure 13: Europe Virtual Event Industry Revenue Share (%), by Application 2025 & 2033
- Figure 14: Europe Virtual Event Industry Revenue (Million), by End-User Industry 2025 & 2033
- Figure 15: Europe Virtual Event Industry Revenue Share (%), by End-User Industry 2025 & 2033
- Figure 16: Europe Virtual Event Industry Revenue (Million), by Country 2025 & 2033
- Figure 17: Europe Virtual Event Industry Revenue Share (%), by Country 2025 & 2033
- Figure 18: Asia Virtual Event Industry Revenue (Million), by Service Type 2025 & 2033
- Figure 19: Asia Virtual Event Industry Revenue Share (%), by Service Type 2025 & 2033
- Figure 20: Asia Virtual Event Industry Revenue (Million), by Application 2025 & 2033
- Figure 21: Asia Virtual Event Industry Revenue Share (%), by Application 2025 & 2033
- Figure 22: Asia Virtual Event Industry Revenue (Million), by End-User Industry 2025 & 2033
- Figure 23: Asia Virtual Event Industry Revenue Share (%), by End-User Industry 2025 & 2033
- Figure 24: Asia Virtual Event Industry Revenue (Million), by Country 2025 & 2033
- Figure 25: Asia Virtual Event Industry Revenue Share (%), by Country 2025 & 2033
- Figure 26: Australia and New Zealand Virtual Event Industry Revenue (Million), by Service Type 2025 & 2033
- Figure 27: Australia and New Zealand Virtual Event Industry Revenue Share (%), by Service Type 2025 & 2033
- Figure 28: Australia and New Zealand Virtual Event Industry Revenue (Million), by Application 2025 & 2033
- Figure 29: Australia and New Zealand Virtual Event Industry Revenue Share (%), by Application 2025 & 2033
- Figure 30: Australia and New Zealand Virtual Event Industry Revenue (Million), by End-User Industry 2025 & 2033
- Figure 31: Australia and New Zealand Virtual Event Industry Revenue Share (%), by End-User Industry 2025 & 2033
- Figure 32: Australia and New Zealand Virtual Event Industry Revenue (Million), by Country 2025 & 2033
- Figure 33: Australia and New Zealand Virtual Event Industry Revenue Share (%), by Country 2025 & 2033
- Figure 34: Latin America Virtual Event Industry Revenue (Million), by Service Type 2025 & 2033
- Figure 35: Latin America Virtual Event Industry Revenue Share (%), by Service Type 2025 & 2033
- Figure 36: Latin America Virtual Event Industry Revenue (Million), by Application 2025 & 2033
- Figure 37: Latin America Virtual Event Industry Revenue Share (%), by Application 2025 & 2033
- Figure 38: Latin America Virtual Event Industry Revenue (Million), by End-User Industry 2025 & 2033
- Figure 39: Latin America Virtual Event Industry Revenue Share (%), by End-User Industry 2025 & 2033
- Figure 40: Latin America Virtual Event Industry Revenue (Million), by Country 2025 & 2033
- Figure 41: Latin America Virtual Event Industry Revenue Share (%), by Country 2025 & 2033
- Figure 42: Middle East and Africa Virtual Event Industry Revenue (Million), by Service Type 2025 & 2033
- Figure 43: Middle East and Africa Virtual Event Industry Revenue Share (%), by Service Type 2025 & 2033
- Figure 44: Middle East and Africa Virtual Event Industry Revenue (Million), by Application 2025 & 2033
- Figure 45: Middle East and Africa Virtual Event Industry Revenue Share (%), by Application 2025 & 2033
- Figure 46: Middle East and Africa Virtual Event Industry Revenue (Million), by End-User Industry 2025 & 2033
- Figure 47: Middle East and Africa Virtual Event Industry Revenue Share (%), by End-User Industry 2025 & 2033
- Figure 48: Middle East and Africa Virtual Event Industry Revenue (Million), by Country 2025 & 2033
- Figure 49: Middle East and Africa Virtual Event Industry Revenue Share (%), by Country 2025 & 2033
List of Tables
- Table 1: Global Virtual Event Industry Revenue Million Forecast, by Service Type 2020 & 2033
- Table 2: Global Virtual Event Industry Revenue Million Forecast, by Application 2020 & 2033
- Table 3: Global Virtual Event Industry Revenue Million Forecast, by End-User Industry 2020 & 2033
- Table 4: Global Virtual Event Industry Revenue Million Forecast, by Region 2020 & 2033
- Table 5: Global Virtual Event Industry Revenue Million Forecast, by Service Type 2020 & 2033
- Table 6: Global Virtual Event Industry Revenue Million Forecast, by Application 2020 & 2033
- Table 7: Global Virtual Event Industry Revenue Million Forecast, by End-User Industry 2020 & 2033
- Table 8: Global Virtual Event Industry Revenue Million Forecast, by Country 2020 & 2033
- Table 9: Global Virtual Event Industry Revenue Million Forecast, by Service Type 2020 & 2033
- Table 10: Global Virtual Event Industry Revenue Million Forecast, by Application 2020 & 2033
- Table 11: Global Virtual Event Industry Revenue Million Forecast, by End-User Industry 2020 & 2033
- Table 12: Global Virtual Event Industry Revenue Million Forecast, by Country 2020 & 2033
- Table 13: Global Virtual Event Industry Revenue Million Forecast, by Service Type 2020 & 2033
- Table 14: Global Virtual Event Industry Revenue Million Forecast, by Application 2020 & 2033
- Table 15: Global Virtual Event Industry Revenue Million Forecast, by End-User Industry 2020 & 2033
- Table 16: Global Virtual Event Industry Revenue Million Forecast, by Country 2020 & 2033
- Table 17: Global Virtual Event Industry Revenue Million Forecast, by Service Type 2020 & 2033
- Table 18: Global Virtual Event Industry Revenue Million Forecast, by Application 2020 & 2033
- Table 19: Global Virtual Event Industry Revenue Million Forecast, by End-User Industry 2020 & 2033
- Table 20: Global Virtual Event Industry Revenue Million Forecast, by Country 2020 & 2033
- Table 21: Global Virtual Event Industry Revenue Million Forecast, by Service Type 2020 & 2033
- Table 22: Global Virtual Event Industry Revenue Million Forecast, by Application 2020 & 2033
- Table 23: Global Virtual Event Industry Revenue Million Forecast, by End-User Industry 2020 & 2033
- Table 24: Global Virtual Event Industry Revenue Million Forecast, by Country 2020 & 2033
- Table 25: Global Virtual Event Industry Revenue Million Forecast, by Service Type 2020 & 2033
- Table 26: Global Virtual Event Industry Revenue Million Forecast, by Application 2020 & 2033
- Table 27: Global Virtual Event Industry Revenue Million Forecast, by End-User Industry 2020 & 2033
- Table 28: Global Virtual Event Industry Revenue Million Forecast, by Country 2020 & 2033
Frequently Asked Questions
1. What is the projected Compound Annual Growth Rate (CAGR) of the Virtual Event Industry?
The projected CAGR is approximately 24.92%.
2. Which companies are prominent players in the Virtual Event Industry?
Key companies in the market include Eventxtra, Zoom Video Communications Inc, Cvent Inc, George P Johnson, Cisco Systems Inc, 6Connex International sp z o o, GES*List Not Exhaustive, Alive Events Agency, Avaya LLC, Arkadin Cloud Communications, ALE International.
3. What are the main segments of the Virtual Event Industry?
The market segments include Service Type, Application, End-User Industry.
4. Can you provide details about the market size?
The market size is estimated to be USD 216.12 Million as of 2022.
5. What are some drivers contributing to market growth?
Technology Advancements such as Growing Acceptance of Unified Communication as a Service (UCAAS). VR. etc.; Increased Frequency of Business Events; Global Reach. Accessibility. and Cost Efficiency.
6. What are the notable trends driving market growth?
Increased Frequency of Business Events may Drive the Market Growth.
7. Are there any restraints impacting market growth?
Data Security and Privacy Issues; Technology Constraints and Experiential Limitations.
8. Can you provide examples of recent developments in the market?
May 2023: Tech startup VOSMOS, which focuses on the metaverse and virtual experiences, has introduced VOSMOS. Events, a platform for user-created virtual events Individuals and organizations may organize dynamic, secure virtual events of any size with the help of VOSMOS.Events. The offering, created by the Indian company VOSMOS, provides a subscription-based business model and allows customers to conduct virtual events with anywhere between 100 and more than 1 lakh participants.
9. What pricing options are available for accessing the report?
Pricing options include single-user, multi-user, and enterprise licenses priced at USD 4750, USD 5250, and USD 8750 respectively.
10. Is the market size provided in terms of value or volume?
The market size is provided in terms of value, measured in Million.
11. Are there any specific market keywords associated with the report?
Yes, the market keyword associated with the report is "Virtual Event Industry," which aids in identifying and referencing the specific market segment covered.
12. How do I determine which pricing option suits my needs best?
The pricing options vary based on user requirements and access needs. Individual users may opt for single-user licenses, while businesses requiring broader access may choose multi-user or enterprise licenses for cost-effective access to the report.
13. Are there any additional resources or data provided in the Virtual Event Industry report?
While the report offers comprehensive insights, it's advisable to review the specific contents or supplementary materials provided to ascertain if additional resources or data are available.
14. How can I stay updated on further developments or reports in the Virtual Event Industry?
To stay informed about further developments, trends, and reports in the Virtual Event Industry, consider subscribing to industry newsletters, following relevant companies and organizations, or regularly checking reputable industry news sources and publications.
Methodology
Step 1 - Identification of Relevant Samples Size from Population Database


Step 2 - Approaches for Defining Global Market Size (Value, Volume* & Price*)

Note*: In applicable scenarios
Step 3 - Data Sources
Primary Research
- Web Analytics
- Survey Reports
- Research Institute
- Latest Research Reports
- Opinion Leaders
Secondary Research
- Annual Reports
- White Paper
- Latest Press Release
- Industry Association
- Paid Database
- Investor Presentations

Step 4 - Data Triangulation
Involves using different sources of information in order to increase the validity of a study
These sources are likely to be stakeholders in a program - participants, other researchers, program staff, other community members, and so on.
Then we put all data in single framework & apply various statistical tools to find out the dynamic on the market.
During the analysis stage, feedback from the stakeholder groups would be compared to determine areas of agreement as well as areas of divergence