Key Insights
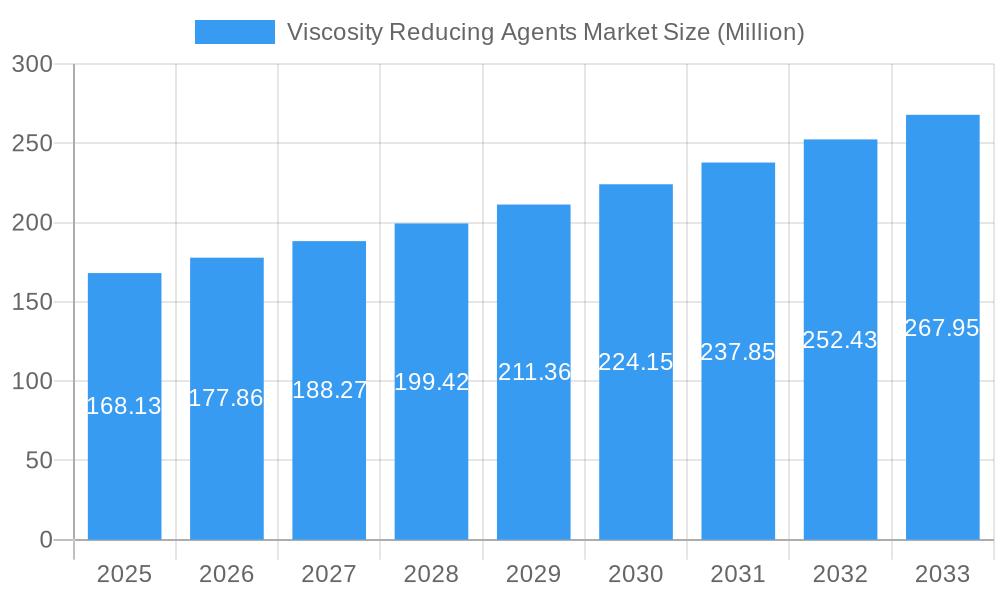
The global viscosity reducing agents market, valued at $168.13 million in 2025, is projected to experience robust growth, driven by a compound annual growth rate (CAGR) of 5.68% from 2025 to 2033. This expansion is fueled by several key factors. The increasing demand for enhanced efficiency in various industries, particularly oil & gas and paints & coatings, is a significant driver. The oil and gas sector's need for improved pipeline flow and reduced energy consumption is stimulating the adoption of these agents. Simultaneously, the paints and coatings industry benefits from improved application properties, resulting in smoother finishes and reduced material waste. Technological advancements leading to the development of more sustainable and environmentally friendly viscosity reducing agents are also contributing to market growth. Furthermore, the expanding plastics manufacturing sector, with its focus on optimizing processing efficiency and material properties, represents a significant growth opportunity. While certain regulatory hurdles and fluctuations in raw material prices might pose challenges, the overall market outlook remains positive.
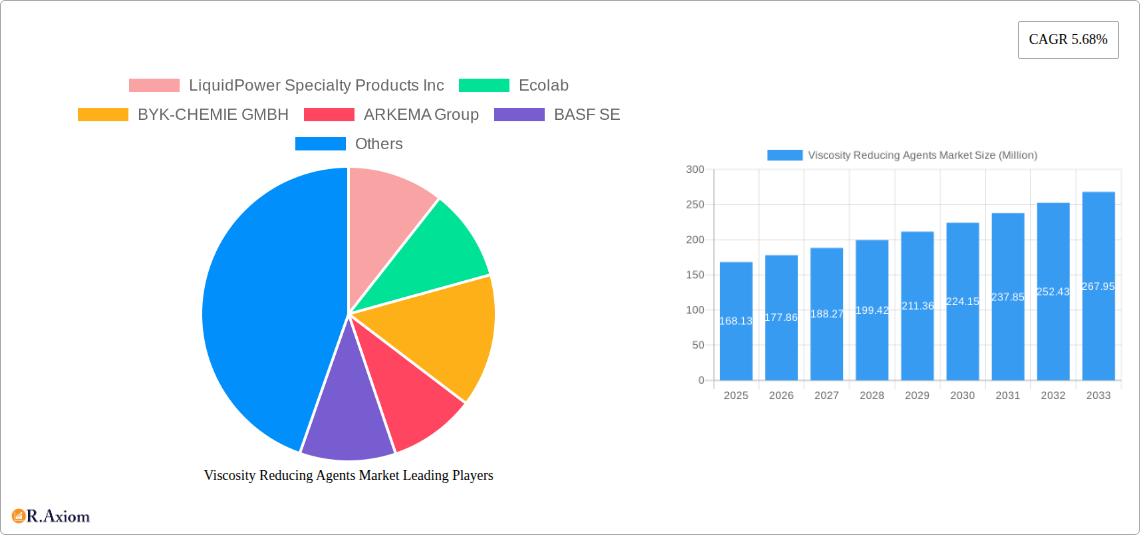
Viscosity Reducing Agents Market Market Size (In Million)
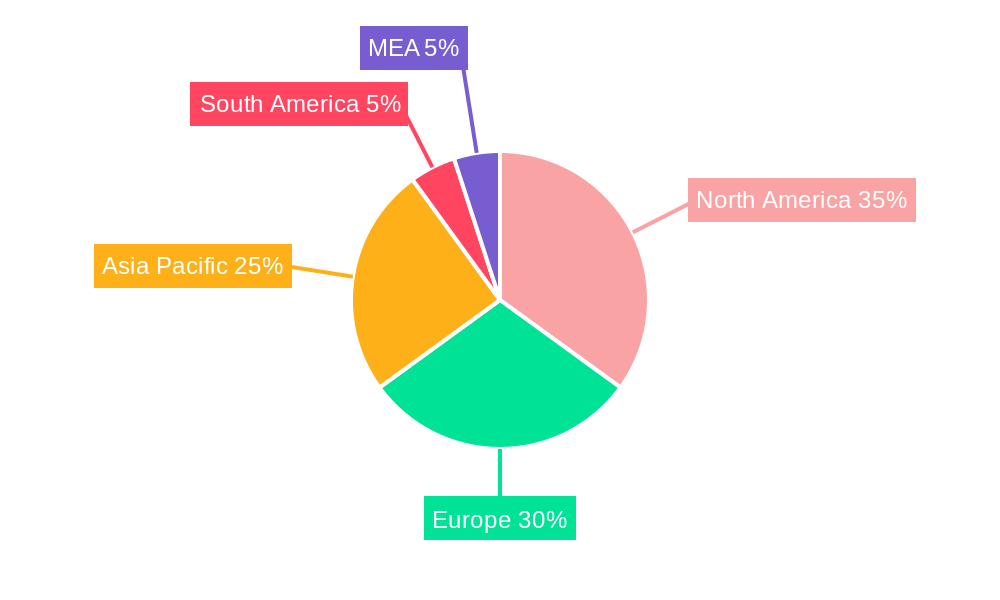
The market segmentation reveals a dynamic landscape. Drag reducing agents, surfactants & additives, and dispersing agents are major product segments, each catering to specific industrial needs. Geographically, North America and Europe currently hold substantial market shares, driven by established industries and technological advancements. However, the Asia-Pacific region is anticipated to exhibit significant growth potential due to rapid industrialization and increasing infrastructure development in countries like China and India. Key players in the market, including LiquidPower Specialty Products Inc, Ecolab, BYK-CHEMIE GMBH, and BASF SE, are actively engaged in research and development, striving to introduce innovative products and expand their market presence through strategic partnerships and acquisitions. Competitive intensity is expected to increase as new entrants and technological breakthroughs reshape the market dynamics over the forecast period.
Viscosity Reducing Agents Market Company Market Share
This in-depth report provides a comprehensive analysis of the global Viscosity Reducing Agents market, offering valuable insights for stakeholders across the value chain. The study covers the period from 2019 to 2033, with 2025 serving as the base and estimated year. The report meticulously segments the market by type (Drag Reducing Agents, Surfactants & Additives, Dispersing Agents, Others) and end-user industry (Oil & Gas, Paints & Coatings, Plastics, Other Manufacturing Industries), providing a granular understanding of market dynamics and growth projections. This report is essential for businesses seeking to understand market trends, identify growth opportunities, and make informed strategic decisions within this dynamic sector.
Viscosity Reducing Agents Market Concentration & Innovation
The global viscosity reducing agents market exhibits a moderately concentrated landscape, with a few major players holding significant market share. Ecolab, BASF SE, and The Lubrizol Corporation are among the dominant players, collectively accounting for approximately xx% of the market in 2025. However, the market also accommodates numerous smaller, specialized players, particularly in niche segments. Innovation is a key driver, with companies continuously developing new formulations to improve efficacy, reduce environmental impact, and meet evolving end-user demands.
- Market Share: Ecolab holds an estimated xx% market share, followed by BASF SE with xx% and Lubrizol with xx%.
- Innovation Drivers: Stringent environmental regulations are pushing innovation towards bio-based and sustainable viscosity reducers. Furthermore, advancements in nanotechnology and polymer chemistry are leading to more efficient and versatile products.
- Regulatory Frameworks: Regulations concerning VOC emissions and environmental safety are crucial factors shaping product development and market dynamics. Compliance costs can vary significantly across regions, influencing market competitiveness.
- Product Substitutes: While direct substitutes are limited, some applications may utilize alternative techniques or materials to achieve similar results, creating subtle competitive pressure.
- End-User Trends: The growing demand for high-performance coatings, improved oil recovery techniques, and sustainable manufacturing practices are driving the growth of the viscosity reducing agents market.
- M&A Activities: The market has witnessed several mergers and acquisitions in recent years, with deal values ranging from xx Million to xx Million. These activities primarily focused on expanding product portfolios and market reach.
Viscosity Reducing Agents Market Industry Trends & Insights
The global viscosity reducing agents market is experiencing robust growth, projected to reach xx Million by 2033, exhibiting a CAGR of xx% during the forecast period (2025-2033). This growth is fueled by several key factors: The increasing demand for high-performance coatings in various industries, particularly construction and automotive, is a significant driver. Advancements in oil and gas extraction technologies, requiring specialized viscosity modifiers, further contribute to market expansion. Growing environmental concerns are propelling the adoption of bio-based and sustainable viscosity reducing agents. Furthermore, continuous innovations in polymer chemistry are leading to the development of high-performance products with enhanced efficiency and reduced environmental impact. The market is characterized by intense competition among established players and emerging companies, resulting in continuous product improvements and price adjustments. Market penetration for bio-based viscosity reducers is currently low but is expected to increase significantly by 2033 driven by stricter environmental regulations and consumer preference. The technological disruption in the field is primarily driven by the introduction of advanced polymers and nanomaterials enhancing the performance of existing products.
Dominant Markets & Segments in Viscosity Reducing Agents Market
The Oil & Gas industry currently represents the largest end-user segment, driven by the need for efficient oil and gas extraction and transportation. The Paints & Coatings segment is also a significant contributor, fuelled by the growing construction and automotive industries. Geographically, North America and Europe hold a substantial share of the market, primarily due to their established manufacturing base and stringent environmental regulations driving innovation. However, the Asia-Pacific region is anticipated to experience the fastest growth, driven by rapid industrialization and infrastructure development.
- Key Drivers in Oil & Gas: Increasing oil and gas exploration activities, improved drilling techniques, and the need for enhanced oil recovery (EOR) are driving demand.
- Key Drivers in Paints & Coatings: Growth in construction, automotive, and furniture industries are boosting demand for high-performance coatings.
- Key Drivers in Plastics: The expansion of the plastic industry, particularly in packaging and consumer goods, contributes to the demand for viscosity reducing agents.
- Dominance Analysis: North America currently holds the largest market share, followed by Europe. However, the Asia-Pacific region is expected to exhibit the highest growth rate in the forecast period due to rapid industrialization.
Viscosity Reducing Agents Market Product Developments
Recent product developments focus on eco-friendly, high-performance formulations. Companies are investing heavily in research and development to produce bio-based alternatives, reduce VOC emissions, and improve the efficiency of their products. These advancements cater to growing environmental concerns and increasingly stringent regulations, providing a competitive edge in the market. The emphasis on tailor-made solutions for specific applications is another key trend.
Report Scope & Segmentation Analysis
This report segments the Viscosity Reducing Agents market based on Type and End-user Industry.
Type:
- Drag Reducing Agents: This segment is expected to witness significant growth driven by the increasing demand from the oil and gas industry. The market size is projected to reach xx Million by 2033.
- Surfactants & Additives: The demand for surfactants and additives is driven by their use in various applications, including paints and coatings. The market size is predicted to reach xx Million by 2033.
- Dispersing Agents: Growth in this segment is expected to be driven by the rising demand from the construction industry and increased use in paints and coatings. The market size is projected to be xx Million by 2033.
- Others: This segment includes other types of viscosity reducing agents and is expected to show steady growth. The market size is predicted to be xx Million by 2033.
End-user Industry:
- Oil & Gas: This segment currently dominates the market due to the extensive use of viscosity reducing agents in drilling and pipeline operations.
- Paints & Coatings: The demand for high-performance coatings is driving the growth of this segment.
- Plastics: This segment is witnessing a steady growth owing to the increasing demand for plastics in various applications.
- Other Manufacturing Industries: This segment includes various other industries using viscosity reducing agents, demonstrating consistent growth.
Key Drivers of Viscosity Reducing Agents Market Growth
The growth of the viscosity reducing agents market is primarily driven by factors such as increasing demand from the oil & gas sector (especially enhanced oil recovery techniques), the booming construction industry stimulating demand for paints and coatings, stringent environmental regulations necessitating eco-friendly formulations, and continuous technological advancements resulting in superior performance products. Furthermore, expanding applications across various industries contribute to market expansion.
Challenges in the Viscosity Reducing Agents Market Sector
The market faces challenges such as fluctuating raw material prices, stringent environmental regulations requiring costly compliance, and intense competition among existing players, often leading to price wars. Supply chain disruptions can also impact product availability and cost. These factors can constrain market growth and profitability.
Emerging Opportunities in Viscosity Reducing Agents Market
Emerging opportunities exist in the development and adoption of bio-based and sustainable viscosity reducers, catering to growing environmental concerns. Expansion into new and growing markets, particularly in developing economies, offers significant potential. Technological advancements leading to high-performance, specialized products for niche applications also create lucrative opportunities.
Leading Players in the Viscosity Reducing Agents Market Market
- LiquidPower Specialty Products Inc
- Ecolab
- BYK-CHEMIE GMBH
- ARKEMA Group
- BASF SE
- Alberta Treating Chemicals LTD
- Qflo
- The Lubrizol Corporation
- Oil Flux
- Baker Hughes Company
- NuGenTecx
- CHINAFLOC
- Innospec
Key Developments in Viscosity Reducing Agents Market Industry
- January 2023: BASF SE launched a new line of bio-based viscosity reducing agents.
- April 2022: Ecolab acquired a smaller viscosity reducing agent producer, expanding its market share.
- July 2021: Lubrizol announced a new partnership to develop advanced polymer-based viscosity reducers.
- October 2020: A new regulatory framework on VOC emissions came into effect in Europe.
Strategic Outlook for Viscosity Reducing Agents Market Market
The future of the viscosity reducing agents market looks promising, driven by sustained growth in key end-user industries, particularly oil and gas and construction. The increasing focus on sustainability and the development of eco-friendly products will further fuel market expansion. Strategic partnerships, R&D investments, and expansion into new markets will be critical for success in this dynamic and competitive landscape. The market anticipates continued consolidation as larger players acquire smaller companies to broaden product offerings and expand geographical reach.
Viscosity Reducing Agents Market Segmentation
-
1. Type
- 1.1. Drag Reducing Agents
- 1.2. Surfactants & Additives
- 1.3. Dispersing Agents
- 1.4. Others
-
2. End-user Industry
- 2.1. Oil & Gas
- 2.2. Paints & Coatings
- 2.3. Plastics
- 2.4. Other Manufacturing Industries
Viscosity Reducing Agents Market Segmentation By Geography
-
1. Asia Pacific
- 1.1. China
- 1.2. India
- 1.3. Japan
- 1.4. South Korea
- 1.5. Rest of Asia Pacific
-
2. North America
- 2.1. United States
- 2.2. Canada
- 2.3. Mexico
-
3. Europe
- 3.1. Germany
- 3.2. United Kingdom
- 3.3. Italy
- 3.4. France
- 3.5. Rest of Europe
-
4. South America
- 4.1. Brazil
- 4.2. Argentina
- 4.3. Rest of South America
-
5. Middle East and Africa
- 5.1. Saudi Arabia
- 5.2. South Africa
- 5.3. Rest of Middle East and Africa
Viscosity Reducing Agents Market Regional Market Share
Geographic Coverage of Viscosity Reducing Agents Market
Viscosity Reducing Agents Market REPORT HIGHLIGHTS
| Aspects | Details |
|---|---|
| Study Period | 2020-2034 |
| Base Year | 2025 |
| Estimated Year | 2026 |
| Forecast Period | 2026-2034 |
| Historical Period | 2020-2025 |
| Growth Rate | CAGR of 5.68% from 2020-2034 |
| Segmentation |
|
Table of Contents
- 1. Introduction
- 1.1. Research Scope
- 1.2. Market Segmentation
- 1.3. Research Objective
- 1.4. Definitions and Assumptions
- 2. Executive Summary
- 2.1. Market Snapshot
- 3. Market Dynamics
- 3.1. Market Drivers
- 3.2. Market Restrains
- 3.3. Market Trends
- 3.4. Market Opportunities
- 4. Market Factor Analysis
- 4.1. Porters Five Forces
- 4.1.1. Bargaining Power of Suppliers
- 4.1.2. Bargaining Power of Buyers
- 4.1.3. Threat of New Entrants
- 4.1.4. Threat of Substitutes
- 4.1.5. Competitive Rivalry
- 4.2. PESTEL analysis
- 4.3. BCG Analysis
- 4.3.1. Stars (High Growth, High Market Share)
- 4.3.2. Cash Cows (Low Growth, High Market Share)
- 4.3.3. Question Mark (High Growth, Low Market Share)
- 4.3.4. Dogs (Low Growth, Low Market Share)
- 4.4. Ansoff Matrix Analysis
- 4.5. Supply Chain Analysis
- 4.6. Regulatory Landscape
- 4.7. Current Market Potential and Opportunity Assessment (TAM–SAM–SOM Framework)
- 4.8. RAX Analyst Note
- 4.1. Porters Five Forces
- 5. Market Analysis, Insights and Forecast 2021-2033
- 5.1. Market Analysis, Insights and Forecast - by Type
- 5.1.1. Drag Reducing Agents
- 5.1.2. Surfactants & Additives
- 5.1.3. Dispersing Agents
- 5.1.4. Others
- 5.2. Market Analysis, Insights and Forecast - by End-user Industry
- 5.2.1. Oil & Gas
- 5.2.2. Paints & Coatings
- 5.2.3. Plastics
- 5.2.4. Other Manufacturing Industries
- 5.3. Market Analysis, Insights and Forecast - by Region
- 5.3.1. Asia Pacific
- 5.3.2. North America
- 5.3.3. Europe
- 5.3.4. South America
- 5.3.5. Middle East and Africa
- 5.1. Market Analysis, Insights and Forecast - by Type
- 6. Global Viscosity Reducing Agents Market Analysis, Insights and Forecast, 2021-2033
- 6.1. Market Analysis, Insights and Forecast - by Type
- 6.1.1. Drag Reducing Agents
- 6.1.2. Surfactants & Additives
- 6.1.3. Dispersing Agents
- 6.1.4. Others
- 6.2. Market Analysis, Insights and Forecast - by End-user Industry
- 6.2.1. Oil & Gas
- 6.2.2. Paints & Coatings
- 6.2.3. Plastics
- 6.2.4. Other Manufacturing Industries
- 6.1. Market Analysis, Insights and Forecast - by Type
- 7. Asia Pacific Viscosity Reducing Agents Market Analysis, Insights and Forecast, 2020-2032
- 7.1. Market Analysis, Insights and Forecast - by Type
- 7.1.1. Drag Reducing Agents
- 7.1.2. Surfactants & Additives
- 7.1.3. Dispersing Agents
- 7.1.4. Others
- 7.2. Market Analysis, Insights and Forecast - by End-user Industry
- 7.2.1. Oil & Gas
- 7.2.2. Paints & Coatings
- 7.2.3. Plastics
- 7.2.4. Other Manufacturing Industries
- 7.1. Market Analysis, Insights and Forecast - by Type
- 8. North America Viscosity Reducing Agents Market Analysis, Insights and Forecast, 2020-2032
- 8.1. Market Analysis, Insights and Forecast - by Type
- 8.1.1. Drag Reducing Agents
- 8.1.2. Surfactants & Additives
- 8.1.3. Dispersing Agents
- 8.1.4. Others
- 8.2. Market Analysis, Insights and Forecast - by End-user Industry
- 8.2.1. Oil & Gas
- 8.2.2. Paints & Coatings
- 8.2.3. Plastics
- 8.2.4. Other Manufacturing Industries
- 8.1. Market Analysis, Insights and Forecast - by Type
- 9. Europe Viscosity Reducing Agents Market Analysis, Insights and Forecast, 2020-2032
- 9.1. Market Analysis, Insights and Forecast - by Type
- 9.1.1. Drag Reducing Agents
- 9.1.2. Surfactants & Additives
- 9.1.3. Dispersing Agents
- 9.1.4. Others
- 9.2. Market Analysis, Insights and Forecast - by End-user Industry
- 9.2.1. Oil & Gas
- 9.2.2. Paints & Coatings
- 9.2.3. Plastics
- 9.2.4. Other Manufacturing Industries
- 9.1. Market Analysis, Insights and Forecast - by Type
- 10. South America Viscosity Reducing Agents Market Analysis, Insights and Forecast, 2020-2032
- 10.1. Market Analysis, Insights and Forecast - by Type
- 10.1.1. Drag Reducing Agents
- 10.1.2. Surfactants & Additives
- 10.1.3. Dispersing Agents
- 10.1.4. Others
- 10.2. Market Analysis, Insights and Forecast - by End-user Industry
- 10.2.1. Oil & Gas
- 10.2.2. Paints & Coatings
- 10.2.3. Plastics
- 10.2.4. Other Manufacturing Industries
- 10.1. Market Analysis, Insights and Forecast - by Type
- 11. Middle East and Africa Viscosity Reducing Agents Market Analysis, Insights and Forecast, 2020-2032
- 11.1. Market Analysis, Insights and Forecast - by Type
- 11.1.1. Drag Reducing Agents
- 11.1.2. Surfactants & Additives
- 11.1.3. Dispersing Agents
- 11.1.4. Others
- 11.2. Market Analysis, Insights and Forecast - by End-user Industry
- 11.2.1. Oil & Gas
- 11.2.2. Paints & Coatings
- 11.2.3. Plastics
- 11.2.4. Other Manufacturing Industries
- 11.1. Market Analysis, Insights and Forecast - by Type
- 12. Competitive Analysis
- 12.1. Company Profiles
- 12.1.1 LiquidPower Specialty Products Inc
- 12.1.1.1. Company Overview
- 12.1.1.2. Products
- 12.1.1.3. Company Financials
- 12.1.1.4. SWOT Analysis
- 12.1.2 Ecolab
- 12.1.2.1. Company Overview
- 12.1.2.2. Products
- 12.1.2.3. Company Financials
- 12.1.2.4. SWOT Analysis
- 12.1.3 BYK-CHEMIE GMBH
- 12.1.3.1. Company Overview
- 12.1.3.2. Products
- 12.1.3.3. Company Financials
- 12.1.3.4. SWOT Analysis
- 12.1.4 ARKEMA Group
- 12.1.4.1. Company Overview
- 12.1.4.2. Products
- 12.1.4.3. Company Financials
- 12.1.4.4. SWOT Analysis
- 12.1.5 BASF SE
- 12.1.5.1. Company Overview
- 12.1.5.2. Products
- 12.1.5.3. Company Financials
- 12.1.5.4. SWOT Analysis
- 12.1.6 Alberta Treating Chemicals LTD
- 12.1.6.1. Company Overview
- 12.1.6.2. Products
- 12.1.6.3. Company Financials
- 12.1.6.4. SWOT Analysis
- 12.1.7 Qflo
- 12.1.7.1. Company Overview
- 12.1.7.2. Products
- 12.1.7.3. Company Financials
- 12.1.7.4. SWOT Analysis
- 12.1.8 The Lubrizol Corporation
- 12.1.8.1. Company Overview
- 12.1.8.2. Products
- 12.1.8.3. Company Financials
- 12.1.8.4. SWOT Analysis
- 12.1.9 Oil Flux
- 12.1.9.1. Company Overview
- 12.1.9.2. Products
- 12.1.9.3. Company Financials
- 12.1.9.4. SWOT Analysis
- 12.1.10 Baker Hughes Company
- 12.1.10.1. Company Overview
- 12.1.10.2. Products
- 12.1.10.3. Company Financials
- 12.1.10.4. SWOT Analysis
- 12.1.11 NuGenTecx
- 12.1.11.1. Company Overview
- 12.1.11.2. Products
- 12.1.11.3. Company Financials
- 12.1.11.4. SWOT Analysis
- 12.1.12 CHINAFLOC
- 12.1.12.1. Company Overview
- 12.1.12.2. Products
- 12.1.12.3. Company Financials
- 12.1.12.4. SWOT Analysis
- 12.1.13 Innospec
- 12.1.13.1. Company Overview
- 12.1.13.2. Products
- 12.1.13.3. Company Financials
- 12.1.13.4. SWOT Analysis
- 12.1.1 LiquidPower Specialty Products Inc
- 12.2. Market Entropy
- 12.2.1 Company's Key Areas Served
- 12.2.2 Recent Developments
- 12.3. Company Market Share Analysis 2025
- 12.3.1 Top 5 Companies Market Share Analysis
- 12.3.2 Top 3 Companies Market Share Analysis
- 12.4. List of Potential Customers
- 13. Research Methodology
List of Figures
- Figure 1: Global Viscosity Reducing Agents Market Revenue Breakdown (Million, %) by Region 2025 & 2033
- Figure 2: Global Viscosity Reducing Agents Market Volume Breakdown (K Tons, %) by Region 2025 & 2033
- Figure 3: Asia Pacific Viscosity Reducing Agents Market Revenue (Million), by Type 2025 & 2033
- Figure 4: Asia Pacific Viscosity Reducing Agents Market Volume (K Tons), by Type 2025 & 2033
- Figure 5: Asia Pacific Viscosity Reducing Agents Market Revenue Share (%), by Type 2025 & 2033
- Figure 6: Asia Pacific Viscosity Reducing Agents Market Volume Share (%), by Type 2025 & 2033
- Figure 7: Asia Pacific Viscosity Reducing Agents Market Revenue (Million), by End-user Industry 2025 & 2033
- Figure 8: Asia Pacific Viscosity Reducing Agents Market Volume (K Tons), by End-user Industry 2025 & 2033
- Figure 9: Asia Pacific Viscosity Reducing Agents Market Revenue Share (%), by End-user Industry 2025 & 2033
- Figure 10: Asia Pacific Viscosity Reducing Agents Market Volume Share (%), by End-user Industry 2025 & 2033
- Figure 11: Asia Pacific Viscosity Reducing Agents Market Revenue (Million), by Country 2025 & 2033
- Figure 12: Asia Pacific Viscosity Reducing Agents Market Volume (K Tons), by Country 2025 & 2033
- Figure 13: Asia Pacific Viscosity Reducing Agents Market Revenue Share (%), by Country 2025 & 2033
- Figure 14: Asia Pacific Viscosity Reducing Agents Market Volume Share (%), by Country 2025 & 2033
- Figure 15: North America Viscosity Reducing Agents Market Revenue (Million), by Type 2025 & 2033
- Figure 16: North America Viscosity Reducing Agents Market Volume (K Tons), by Type 2025 & 2033
- Figure 17: North America Viscosity Reducing Agents Market Revenue Share (%), by Type 2025 & 2033
- Figure 18: North America Viscosity Reducing Agents Market Volume Share (%), by Type 2025 & 2033
- Figure 19: North America Viscosity Reducing Agents Market Revenue (Million), by End-user Industry 2025 & 2033
- Figure 20: North America Viscosity Reducing Agents Market Volume (K Tons), by End-user Industry 2025 & 2033
- Figure 21: North America Viscosity Reducing Agents Market Revenue Share (%), by End-user Industry 2025 & 2033
- Figure 22: North America Viscosity Reducing Agents Market Volume Share (%), by End-user Industry 2025 & 2033
- Figure 23: North America Viscosity Reducing Agents Market Revenue (Million), by Country 2025 & 2033
- Figure 24: North America Viscosity Reducing Agents Market Volume (K Tons), by Country 2025 & 2033
- Figure 25: North America Viscosity Reducing Agents Market Revenue Share (%), by Country 2025 & 2033
- Figure 26: North America Viscosity Reducing Agents Market Volume Share (%), by Country 2025 & 2033
- Figure 27: Europe Viscosity Reducing Agents Market Revenue (Million), by Type 2025 & 2033
- Figure 28: Europe Viscosity Reducing Agents Market Volume (K Tons), by Type 2025 & 2033
- Figure 29: Europe Viscosity Reducing Agents Market Revenue Share (%), by Type 2025 & 2033
- Figure 30: Europe Viscosity Reducing Agents Market Volume Share (%), by Type 2025 & 2033
- Figure 31: Europe Viscosity Reducing Agents Market Revenue (Million), by End-user Industry 2025 & 2033
- Figure 32: Europe Viscosity Reducing Agents Market Volume (K Tons), by End-user Industry 2025 & 2033
- Figure 33: Europe Viscosity Reducing Agents Market Revenue Share (%), by End-user Industry 2025 & 2033
- Figure 34: Europe Viscosity Reducing Agents Market Volume Share (%), by End-user Industry 2025 & 2033
- Figure 35: Europe Viscosity Reducing Agents Market Revenue (Million), by Country 2025 & 2033
- Figure 36: Europe Viscosity Reducing Agents Market Volume (K Tons), by Country 2025 & 2033
- Figure 37: Europe Viscosity Reducing Agents Market Revenue Share (%), by Country 2025 & 2033
- Figure 38: Europe Viscosity Reducing Agents Market Volume Share (%), by Country 2025 & 2033
- Figure 39: South America Viscosity Reducing Agents Market Revenue (Million), by Type 2025 & 2033
- Figure 40: South America Viscosity Reducing Agents Market Volume (K Tons), by Type 2025 & 2033
- Figure 41: South America Viscosity Reducing Agents Market Revenue Share (%), by Type 2025 & 2033
- Figure 42: South America Viscosity Reducing Agents Market Volume Share (%), by Type 2025 & 2033
- Figure 43: South America Viscosity Reducing Agents Market Revenue (Million), by End-user Industry 2025 & 2033
- Figure 44: South America Viscosity Reducing Agents Market Volume (K Tons), by End-user Industry 2025 & 2033
- Figure 45: South America Viscosity Reducing Agents Market Revenue Share (%), by End-user Industry 2025 & 2033
- Figure 46: South America Viscosity Reducing Agents Market Volume Share (%), by End-user Industry 2025 & 2033
- Figure 47: South America Viscosity Reducing Agents Market Revenue (Million), by Country 2025 & 2033
- Figure 48: South America Viscosity Reducing Agents Market Volume (K Tons), by Country 2025 & 2033
- Figure 49: South America Viscosity Reducing Agents Market Revenue Share (%), by Country 2025 & 2033
- Figure 50: South America Viscosity Reducing Agents Market Volume Share (%), by Country 2025 & 2033
- Figure 51: Middle East and Africa Viscosity Reducing Agents Market Revenue (Million), by Type 2025 & 2033
- Figure 52: Middle East and Africa Viscosity Reducing Agents Market Volume (K Tons), by Type 2025 & 2033
- Figure 53: Middle East and Africa Viscosity Reducing Agents Market Revenue Share (%), by Type 2025 & 2033
- Figure 54: Middle East and Africa Viscosity Reducing Agents Market Volume Share (%), by Type 2025 & 2033
- Figure 55: Middle East and Africa Viscosity Reducing Agents Market Revenue (Million), by End-user Industry 2025 & 2033
- Figure 56: Middle East and Africa Viscosity Reducing Agents Market Volume (K Tons), by End-user Industry 2025 & 2033
- Figure 57: Middle East and Africa Viscosity Reducing Agents Market Revenue Share (%), by End-user Industry 2025 & 2033
- Figure 58: Middle East and Africa Viscosity Reducing Agents Market Volume Share (%), by End-user Industry 2025 & 2033
- Figure 59: Middle East and Africa Viscosity Reducing Agents Market Revenue (Million), by Country 2025 & 2033
- Figure 60: Middle East and Africa Viscosity Reducing Agents Market Volume (K Tons), by Country 2025 & 2033
- Figure 61: Middle East and Africa Viscosity Reducing Agents Market Revenue Share (%), by Country 2025 & 2033
- Figure 62: Middle East and Africa Viscosity Reducing Agents Market Volume Share (%), by Country 2025 & 2033
List of Tables
- Table 1: Global Viscosity Reducing Agents Market Revenue Million Forecast, by Type 2020 & 2033
- Table 2: Global Viscosity Reducing Agents Market Volume K Tons Forecast, by Type 2020 & 2033
- Table 3: Global Viscosity Reducing Agents Market Revenue Million Forecast, by End-user Industry 2020 & 2033
- Table 4: Global Viscosity Reducing Agents Market Volume K Tons Forecast, by End-user Industry 2020 & 2033
- Table 5: Global Viscosity Reducing Agents Market Revenue Million Forecast, by Region 2020 & 2033
- Table 6: Global Viscosity Reducing Agents Market Volume K Tons Forecast, by Region 2020 & 2033
- Table 7: Global Viscosity Reducing Agents Market Revenue Million Forecast, by Type 2020 & 2033
- Table 8: Global Viscosity Reducing Agents Market Volume K Tons Forecast, by Type 2020 & 2033
- Table 9: Global Viscosity Reducing Agents Market Revenue Million Forecast, by End-user Industry 2020 & 2033
- Table 10: Global Viscosity Reducing Agents Market Volume K Tons Forecast, by End-user Industry 2020 & 2033
- Table 11: Global Viscosity Reducing Agents Market Revenue Million Forecast, by Country 2020 & 2033
- Table 12: Global Viscosity Reducing Agents Market Volume K Tons Forecast, by Country 2020 & 2033
- Table 13: China Viscosity Reducing Agents Market Revenue (Million) Forecast, by Application 2020 & 2033
- Table 14: China Viscosity Reducing Agents Market Volume (K Tons) Forecast, by Application 2020 & 2033
- Table 15: India Viscosity Reducing Agents Market Revenue (Million) Forecast, by Application 2020 & 2033
- Table 16: India Viscosity Reducing Agents Market Volume (K Tons) Forecast, by Application 2020 & 2033
- Table 17: Japan Viscosity Reducing Agents Market Revenue (Million) Forecast, by Application 2020 & 2033
- Table 18: Japan Viscosity Reducing Agents Market Volume (K Tons) Forecast, by Application 2020 & 2033
- Table 19: South Korea Viscosity Reducing Agents Market Revenue (Million) Forecast, by Application 2020 & 2033
- Table 20: South Korea Viscosity Reducing Agents Market Volume (K Tons) Forecast, by Application 2020 & 2033
- Table 21: Rest of Asia Pacific Viscosity Reducing Agents Market Revenue (Million) Forecast, by Application 2020 & 2033
- Table 22: Rest of Asia Pacific Viscosity Reducing Agents Market Volume (K Tons) Forecast, by Application 2020 & 2033
- Table 23: Global Viscosity Reducing Agents Market Revenue Million Forecast, by Type 2020 & 2033
- Table 24: Global Viscosity Reducing Agents Market Volume K Tons Forecast, by Type 2020 & 2033
- Table 25: Global Viscosity Reducing Agents Market Revenue Million Forecast, by End-user Industry 2020 & 2033
- Table 26: Global Viscosity Reducing Agents Market Volume K Tons Forecast, by End-user Industry 2020 & 2033
- Table 27: Global Viscosity Reducing Agents Market Revenue Million Forecast, by Country 2020 & 2033
- Table 28: Global Viscosity Reducing Agents Market Volume K Tons Forecast, by Country 2020 & 2033
- Table 29: United States Viscosity Reducing Agents Market Revenue (Million) Forecast, by Application 2020 & 2033
- Table 30: United States Viscosity Reducing Agents Market Volume (K Tons) Forecast, by Application 2020 & 2033
- Table 31: Canada Viscosity Reducing Agents Market Revenue (Million) Forecast, by Application 2020 & 2033
- Table 32: Canada Viscosity Reducing Agents Market Volume (K Tons) Forecast, by Application 2020 & 2033
- Table 33: Mexico Viscosity Reducing Agents Market Revenue (Million) Forecast, by Application 2020 & 2033
- Table 34: Mexico Viscosity Reducing Agents Market Volume (K Tons) Forecast, by Application 2020 & 2033
- Table 35: Global Viscosity Reducing Agents Market Revenue Million Forecast, by Type 2020 & 2033
- Table 36: Global Viscosity Reducing Agents Market Volume K Tons Forecast, by Type 2020 & 2033
- Table 37: Global Viscosity Reducing Agents Market Revenue Million Forecast, by End-user Industry 2020 & 2033
- Table 38: Global Viscosity Reducing Agents Market Volume K Tons Forecast, by End-user Industry 2020 & 2033
- Table 39: Global Viscosity Reducing Agents Market Revenue Million Forecast, by Country 2020 & 2033
- Table 40: Global Viscosity Reducing Agents Market Volume K Tons Forecast, by Country 2020 & 2033
- Table 41: Germany Viscosity Reducing Agents Market Revenue (Million) Forecast, by Application 2020 & 2033
- Table 42: Germany Viscosity Reducing Agents Market Volume (K Tons) Forecast, by Application 2020 & 2033
- Table 43: United Kingdom Viscosity Reducing Agents Market Revenue (Million) Forecast, by Application 2020 & 2033
- Table 44: United Kingdom Viscosity Reducing Agents Market Volume (K Tons) Forecast, by Application 2020 & 2033
- Table 45: Italy Viscosity Reducing Agents Market Revenue (Million) Forecast, by Application 2020 & 2033
- Table 46: Italy Viscosity Reducing Agents Market Volume (K Tons) Forecast, by Application 2020 & 2033
- Table 47: France Viscosity Reducing Agents Market Revenue (Million) Forecast, by Application 2020 & 2033
- Table 48: France Viscosity Reducing Agents Market Volume (K Tons) Forecast, by Application 2020 & 2033
- Table 49: Rest of Europe Viscosity Reducing Agents Market Revenue (Million) Forecast, by Application 2020 & 2033
- Table 50: Rest of Europe Viscosity Reducing Agents Market Volume (K Tons) Forecast, by Application 2020 & 2033
- Table 51: Global Viscosity Reducing Agents Market Revenue Million Forecast, by Type 2020 & 2033
- Table 52: Global Viscosity Reducing Agents Market Volume K Tons Forecast, by Type 2020 & 2033
- Table 53: Global Viscosity Reducing Agents Market Revenue Million Forecast, by End-user Industry 2020 & 2033
- Table 54: Global Viscosity Reducing Agents Market Volume K Tons Forecast, by End-user Industry 2020 & 2033
- Table 55: Global Viscosity Reducing Agents Market Revenue Million Forecast, by Country 2020 & 2033
- Table 56: Global Viscosity Reducing Agents Market Volume K Tons Forecast, by Country 2020 & 2033
- Table 57: Brazil Viscosity Reducing Agents Market Revenue (Million) Forecast, by Application 2020 & 2033
- Table 58: Brazil Viscosity Reducing Agents Market Volume (K Tons) Forecast, by Application 2020 & 2033
- Table 59: Argentina Viscosity Reducing Agents Market Revenue (Million) Forecast, by Application 2020 & 2033
- Table 60: Argentina Viscosity Reducing Agents Market Volume (K Tons) Forecast, by Application 2020 & 2033
- Table 61: Rest of South America Viscosity Reducing Agents Market Revenue (Million) Forecast, by Application 2020 & 2033
- Table 62: Rest of South America Viscosity Reducing Agents Market Volume (K Tons) Forecast, by Application 2020 & 2033
- Table 63: Global Viscosity Reducing Agents Market Revenue Million Forecast, by Type 2020 & 2033
- Table 64: Global Viscosity Reducing Agents Market Volume K Tons Forecast, by Type 2020 & 2033
- Table 65: Global Viscosity Reducing Agents Market Revenue Million Forecast, by End-user Industry 2020 & 2033
- Table 66: Global Viscosity Reducing Agents Market Volume K Tons Forecast, by End-user Industry 2020 & 2033
- Table 67: Global Viscosity Reducing Agents Market Revenue Million Forecast, by Country 2020 & 2033
- Table 68: Global Viscosity Reducing Agents Market Volume K Tons Forecast, by Country 2020 & 2033
- Table 69: Saudi Arabia Viscosity Reducing Agents Market Revenue (Million) Forecast, by Application 2020 & 2033
- Table 70: Saudi Arabia Viscosity Reducing Agents Market Volume (K Tons) Forecast, by Application 2020 & 2033
- Table 71: South Africa Viscosity Reducing Agents Market Revenue (Million) Forecast, by Application 2020 & 2033
- Table 72: South Africa Viscosity Reducing Agents Market Volume (K Tons) Forecast, by Application 2020 & 2033
- Table 73: Rest of Middle East and Africa Viscosity Reducing Agents Market Revenue (Million) Forecast, by Application 2020 & 2033
- Table 74: Rest of Middle East and Africa Viscosity Reducing Agents Market Volume (K Tons) Forecast, by Application 2020 & 2033
Frequently Asked Questions
1. What is the projected Compound Annual Growth Rate (CAGR) of the Viscosity Reducing Agents Market?
The projected CAGR is approximately 5.68%.
2. Which companies are prominent players in the Viscosity Reducing Agents Market?
Key companies in the market include LiquidPower Specialty Products Inc, Ecolab, BYK-CHEMIE GMBH, ARKEMA Group, BASF SE, Alberta Treating Chemicals LTD, Qflo, The Lubrizol Corporation, Oil Flux, Baker Hughes Company, NuGenTecx, CHINAFLOC, Innospec.
3. What are the main segments of the Viscosity Reducing Agents Market?
The market segments include Type, End-user Industry.
4. Can you provide details about the market size?
The market size is estimated to be USD 168.13 Million as of 2022.
5. What are some drivers contributing to market growth?
; Growing Demand From the Oil & Gas Industry; Other Drivers.
6. What are the notable trends driving market growth?
Growing Demand from the Oil & Gas Industry.
7. Are there any restraints impacting market growth?
; Stringent Environmental Regulations; Unfavourable Conditions Arising Due to the COVID-19 Outbreak.
8. Can you provide examples of recent developments in the market?
N/A
9. What pricing options are available for accessing the report?
Pricing options include single-user, multi-user, and enterprise licenses priced at USD 3,950, USD 4,950, and USD 6,950 respectively.
10. Is the market size provided in terms of value or volume?
The market size is provided in terms of value, measured in Million and volume, measured in K Tons.
11. Are there any specific market keywords associated with the report?
Yes, the market keyword associated with the report is "Viscosity Reducing Agents Market," which aids in identifying and referencing the specific market segment covered.
12. How do I determine which pricing option suits my needs best?
The pricing options vary based on user requirements and access needs. Individual users may opt for single-user licenses, while businesses requiring broader access may choose multi-user or enterprise licenses for cost-effective access to the report.
13. Are there any additional resources or data provided in the Viscosity Reducing Agents Market report?
While the report offers comprehensive insights, it's advisable to review the specific contents or supplementary materials provided to ascertain if additional resources or data are available.
14. How can I stay updated on further developments or reports in the Viscosity Reducing Agents Market?
To stay informed about further developments, trends, and reports in the Viscosity Reducing Agents Market, consider subscribing to industry newsletters, following relevant companies and organizations, or regularly checking reputable industry news sources and publications.
Methodology
Step 1 - Identification of Relevant Samples Size from Population Database


Step 2 - Approaches for Defining Global Market Size (Value, Volume* & Price*)

Note*: In applicable scenarios
Step 3 - Data Sources
Primary Research
- Web Analytics
- Survey Reports
- Research Institute
- Latest Research Reports
- Opinion Leaders
Secondary Research
- Annual Reports
- White Paper
- Latest Press Release
- Industry Association
- Paid Database
- Investor Presentations

Step 4 - Data Triangulation
Involves using different sources of information in order to increase the validity of a study
These sources are likely to be stakeholders in a program - participants, other researchers, program staff, other community members, and so on.
Then we put all data in single framework & apply various statistical tools to find out the dynamic on the market.
During the analysis stage, feedback from the stakeholder groups would be compared to determine areas of agreement as well as areas of divergence

